


概述
MAT,下载地址,Eclipse Memory Analysis Tools,一个分析Java堆数据的专业工具,可以计算出内存中对象的实例数量、占用空间大小、引用关系等,可得知哪些线程阻止垃圾收集器的回收工作,从而定位内存泄漏的原因。
什么时候会用到MAT?
- OutOfMemoryError时,触发Full GC,但空间却回收不了,引发内存泄露
- Java服务器系统异常,如load飙高,io异常,或线程死锁等,都可能通过分析堆中的内存对象来定位原因
分析堆转储文件需要消耗很多的堆空间,为保证分析的效率和性能,建议给MAT分配尽可能多的内存资源。两种方式:
- 修改启动参数
MemoryAnalyzer.exe -vmargs -Xmx4g - 编辑文件
MemoryAnalyzer.ini添加-vmargs –Xmx4g
生成堆转储文件
简单来说使用jmap -dump命令可以生成堆转储文件。首先需要执行进程ID,即PID。通过top或jps命令拿到Java进程pid。
具体执行命令:jmap -dump:format=b,file=heap.hprof <pid>
如果执行命令报错:
Unable to open socket file: target process not responding or HotSpot VM not loaded.The -F option can be used when the target process is not responding
则执行命令:jmap -F -dump:format=b,file=heap.hprof <pid>
命令执行时,JVM会将整个heap的信息dump写入到一个文件,heap如果比较大的话,就会导致这个过程比较耗时,且执行过程中为保证dump的信息是可靠的,会暂停应用。
可通过-d64来解决:jmap -F -J -d64 -dump:format=b,file=dump.bin PID
一般dump下来的文件有几个G,如果dump下来的文件只有一两百M,说明jmap命令执行有问题,需多执行几次才能得出正常结果,这个时候可以选用gcore把整个内存dump出来,然后再使用jmap把core dump转换成heap dump。
做法就是用gcore 1234命令来生成c版的core文件,再用命令jmap -dump:format=b,file=heap.hprof /bin/java core.1234
概念
Shallow Size
Shallow size就是对象本身占用内存的大小,不包含其引用的对象。常规对象(非数组)的 Shallow size 由其成员变量的数量和类型决定。数组的 shallow size 由数组元素的类型(对象类型、基本类型)和数组长度决定。
在32位系统上,对象头占用8字节。int占用4字节,不管成员变量(对象或数组)是否引用其他对象(实例)或赋值为null,它始终占用4字节。对于String对象实例来说,它有三个int成员(3*4=12字节)、一个char[]成员(1*4=4字节)以及一个对象头(8字节),总共3*4+1*4+8=24字节。
注意JDK 版本区别:
public final class String implements java.io.Serializable, Comparable<String>, CharSequence {
    /** The value is used for character storage. */
    private final char value[];

    /** The offset is the first index of the storage that is used. */
    private final int offset;

    /** The count is the number of characters in the String. */
    private final int count;

    /** Cache the hash code for the string */
    private int hash; // Default to 0
}
Retained Size
对象的 Retained Size = 对象本身的 Shallow Size + 对象能直接或间接访问到对象的 Shallow Size。即,Retained Size 就是该对象被GC之后所能回收内存的总和。即,该对象到其他对象有引用关系并且该引用对象到GC Root节点是不可达的。总之,Retained size是一个整体度量,能反映内存结构和对象图的依赖关系,还可以找到根节点。在进行GC时,如果实例对象到GC Root不可达的,那么该对象会被回收。
Heap Size
堆的大小,当资源增加,当前堆的空间不够时,系统会增加堆的大小,若超过上限(如64M,阈值视平台而定)则会被杀掉。
Allocated Size
堆中已分配的大小,即App应用实际占用的内存大小,资源回收后,此项数据会变小。
建议:若单一操作反复进行,堆大小一直增加,则有内存泄露的隐患,可采用 MAT 进一步查看。
incoming references
以对象A作为分析目标,所谓incoming references,就是别的其他对象引用A。某些条件下,A也是A本身的incoming references,如:
public class A {
	private A a = new A();
}
outgoing references
以对象A作为分析目标,所谓outgoing references,就是A对象引用别的其他对象。某些条件下,A也是A本身的outgoing references,如:
public class A {
	private A a = new A();
}
问题
Java heap space
打开dump1.phrof文件失败,报错信息如下:
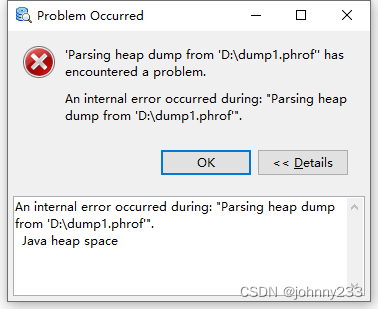
解决方案:
编辑MemoryAnalyzer.ini文件,修改-Xmx1024m为-Xmx2048m,当然也可以修改为其他数值,大于1024即可,然后得是2的n次方。参考链接见文末。
The HPROF parser encountered a violation
打开dump1.phrof文件失败,报错信息如下:
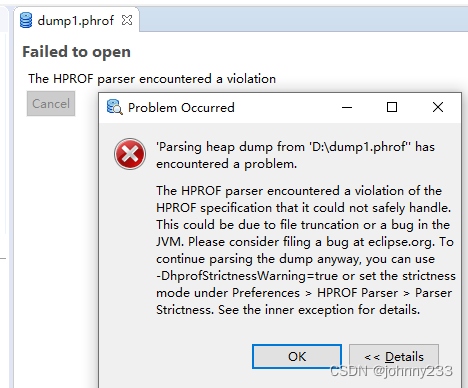
详细的报错日志:
The HPROF parser encountered a violation of the HPROF specification that it could not safely handle. This could be due to file truncation or a bug in the JVM. Please consider filing a bug at eclipse.org. To continue parsing the dump anyway, you can use -DhprofStrictnessWarning=true or set the strictness mode under Preferences > HPROF Parser > Parser Strictness. See the inner exception for details.
The HPROF parser encountered a violation of the HPROF specification that it could not safely handle. This could be due to file truncation or a bug in the JVM. Please consider filing a bug at eclipse.org. To continue parsing the dump anyway, you can use -DhprofStrictnessWarning=true or set the strictness mode under Preferences > HPROF Parser > Parser Strictness. See the inner exception for details.
(Possibly) Invalid HPROF file: Expected to read another 3,458,508,632 bytes, but only 125,883,023 bytes are available for heap dump record 0x21 at 0x8114f34a.
(Possibly) Invalid HPROF file: Expected to read another 3,458,508,632 bytes, but only 125,883,023 bytes are available for heap dump record 0x21 at 0x8114f34a.
解决方案:
考虑到上面的问题1,没有Google搜索,直接在配置文件MemoryAnalyzer.ini里面增加一行配置:-DhprofStrictnessWarning=true,重启MAT,重新打开dump1.phrof文件,解析成功。
实战
打开一个.hprof文件,主要有三个模块,左侧顶部的Inspector,左侧底部如下信息:
右侧主面板:
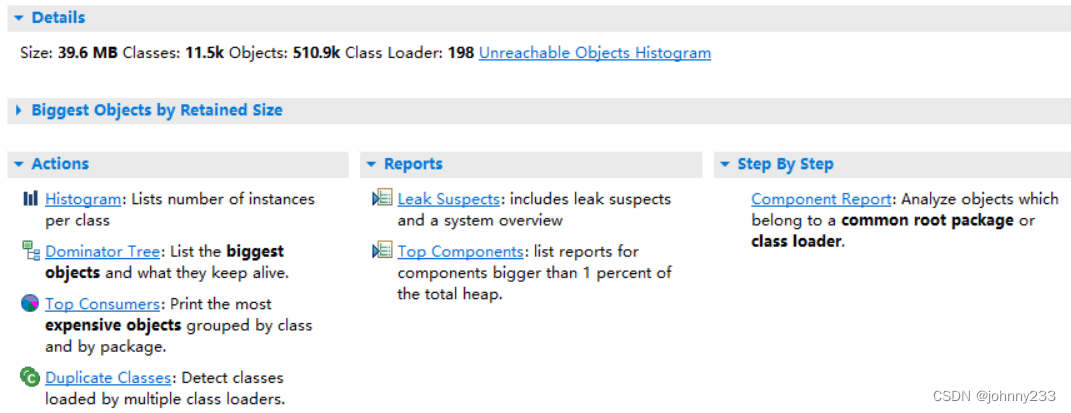
- 工具栏及Overview
- Details:概要信息,如空间大小、类的数量、对象实例数量、类加载器等
- Biggest Objects by Retained Size:以饼状图给出大对象,鼠标移动到饼图某个区域上方,在左侧会看到对象的详细信息
- Atcion提供多种分析维度:
- Histogram:按类列出内存中的对象,对象的个数以及大小
- Dominator Tree:支配树,分析对象的引用关系
- Top Consumers:
- Duplicate Classes:
- Reports:
- Leak Suspects:分析内存泄漏
- Top Components:
- Step By Step:
概念:
Shallow Heap:类对象本身占用内存大小,不包含其引用的对象内存
Retained Heap:对象自己占用内存 + 关联引用对象占用大小。相对于shallow heap,RetainedHeap可以更精确的反映一个对象实际占用的大小(因为如果该对象释放,retained heap都可以被释放)。
Retained Set:指这个对象本身和他持有引用的对象以及这些引用对象的Retained Set所占内存大小的总和
Unreachable Objects Histogram
Unreachable Objects定义:
Sometimes a heap dump contains objects which would be removed at the next garbage collection. These are objects which are unreachable from the garbage collection roots. By default, Memory Analyzer removes these objects as part of the parse process as normally they are not important in determining a memory leak. If the heap dump is generated as a result of an OutOfMemoryError then the Java virtual machine will usually have performed a garbage collection operation to attempt to free space for the new object, so there will not be those objects in the heap dump file. There is a chance that the garbage collection was not performed, for example if the object to be allocated was so huge that it was obvious to the JVM that no amount of garbage collection could free enough space, or if the heap dump was triggered by another event.
Sometimes however, it is interesting to investigate these unreachable objects. For example if the application is spending a lot of time garbage collecting then it may be allocating and discarding more objects than is sensible. The types of the objects which could be discarded at the next garbage collection gives a clue as to which temporary objects the application is causing to be allocated. When acquiring a heap dump for this purpose using the Memory Analyzer, do not use the live=true option as that would discard unreachable objects before the heap dump is generated.
Another reason for unreachable objects is if Memory Analyzer has been configured to discard objects on parsing to keep the number of remaining objects small enough for Memory Analyzer to handle. See Enable discard (experimental) for details.
这个结果是一个直方图,显示了不可达的对象的类名、对象实例的数量以及它们的总大小。由于不可达的对象在分析dump文件时被删除了,只存储了类名,所以没有对应的对象图表,选定一个class,右键"List objects"也无法查看其引用列表。
要想MAT在分析dump时不删除Unreachable Objects,修改一下配置即可(当然前提是dump文件中本就包含这些对象)。
1、在Window->Preferences->Memory Analyzer中选中"Keep unreachable objects",然后点击"Apply and Close"保存配置:
Histogram
该视图以Class类的维度展示每个Class类的实例存在的个数、占用的[Shallow内存]和[Retained内存]大小,可分别降序显示(升序几乎没有什么意义),尤其是对Retained内存降序展示,还可以按照对象或Class引用和被引用展示:List objects or Show objects by class:
- with incoming references:列出哪些类引入该类
- with outgoing references:出该类引用哪些类
多数情况下,在Histogram视图看到实例对象数量比较多的类都是一些基础类型,如char[](因为其构成String)、String、byte[],所以仅从这些是无法判断出具体导致内存泄露的类或者方法的,可以使用 List objects 或 Merge Shortest Paths to GC roots–>exclude all phantom/weak/soft etc.reference(排除所有虚弱软引用)–>查看剩余未被回收的强引用对象占用原因 等功能继续钻取数据。如果Histogram视图展示的数量多的实例对象不是基础类型,是有嫌疑的某个类,如项目代码中的bean类型,那么就要重点关注了。
打开方式:
- Overview > Actions > The Histogram
- 工具栏 > Histogram
Dominator Tree
支配树,可以用于查看heap dump中占用内存最大的对象。在支配树中,对于某一层的节点来说,如果它们的parent节点没有被其他对象引用,那这些节点都会被垃圾收集器回收。
支配树可以用来排查是哪些对象导致其他对象无法被垃圾收集器回收,跟类直方图类似,支配树也从类加载器、package等角度来看。
分析对象的引用关系,对象内存占用&占比。
dominate tree -> 对象调用堆栈树-查找内存占用最高对象(Retained Heap倒叙排序) -> Paths to GC Roots -> exclude all phantom/weak/soft etc.reference(排除所有虚弱软引用) -查找GC Root线程-> 定位未释放内存代码段
Actions > dominator_tree (查看堆中内存占用最高的对象的线程调用堆栈) -> 对象调用堆栈树-查找内存占用最高对象(Retained Heap倒叙排序) -> Paths to GC Roots -> exclude all phantom/weak/soft etc.reference (排除所有虚弱软引用) -查找GC Root线程 -> 查找未释放的内存占用最高的代码逻辑段(很可能是产生内存溢出代码)
Leak Suspects
打开方式:
- Overview > Reports > Leak Suspects
- 工具栏 > Run Expect System Test > Leak Suspects
自动分析内存泄露可疑点,给出一份可疑分析报告。MAT将报告内容压缩打包到一个zip文件,并放在原始堆转储文件的目录下,一般命名为xxx_Leak_Suspects.zip,xxx是dump文件名,zip包文件很小,方便分发共享,请教他人协助排查内存泄露问题;报告是HTML文件。
以饼状图给出可疑的内存泄漏点,Details明细
OQL
Object Query Language,对象查询语言,类似于SQL,用来查询当前内存中满足指定条件的所有对象。OQL和关系型数据库具备类似的数据模型:将某个类看作是一张表,将该类的实例对象看作是该表中的行,每个对象中的属性看作是构成行的列。
OQL语言的语法结构:
SELECT *
FROM [ INSTANCEOF ] <class name="name">
[ WHERE <filter-expression> ]
OQL编辑器分为两个区域:
- 上半部分的区域用于输入查询语句
- 下半部分的区域用于展示查询语句执行的结果
示例,查询当前堆里所有的String对象的语句和结果:
select * from "java.lang.String"
Thread Overview
可看到:线程对象/线程栈信息、线程名、Shallow Heap、Retained Heap、类加载器、是否Daemon线程等信息。结合左侧的对象属性区域,可以更方便的看清线程中对象的具体情况。
打开方式:工具栏
Query Browser
对比dump堆栈文件
复杂的内存泄漏情况,需要通过对比hpof文件来进行分析。
生成第一个hpof文件,进行一段时间操作,再生成第二个hpof文件。用MAT打开这两个hpof文件。
将第一个和第二个hpof文件的Dominator Tree或者Histogram添加到Compare Basket中,之后选中2个文件对比即可
2个dump文件对比寻找波动差异(关注差异波动大的对象)


 3906
3906


 被折叠的 条评论
为什么被折叠?
被折叠的 条评论
为什么被折叠?
 到【灌水乐园】发言


