


在使用gdb调试程序的时候,有时候需要设定多个断点,重复执行某些操作,而这些操作写起来比较麻烦,这个时候就应该想起来用gdb命令脚本了,它能够很好的完成这些工作。
以设置多个断点为例,我写的命令脚本为
---------------------------------------------------
#filename: .gdbinit
#gdb will read it when starting
file test_gdbscript
set args hello
b main
b foo
r
---------------------------------------------------
有两种方式来使用这个脚本:
1)启动gdb时候
gdb在启动的时候,会在当前目录下查找".gdbinit"这个文件,并把它的内容作为gdb命令进行解释,所以如果我把脚本命名为".gdbinit",这样在启动的时候就会处理这些命令。
2)gdb运行期间
可以使用 source script-file 来解释gdb命令脚本script-file
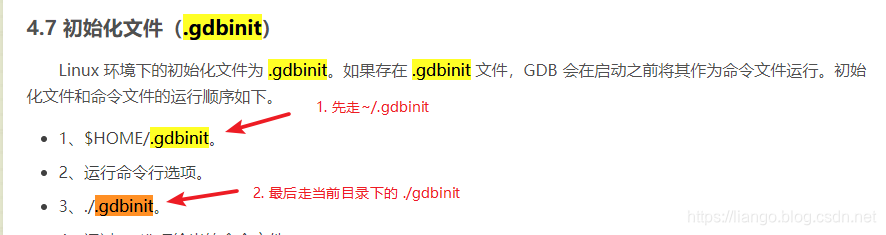
.gdbinit文件的位置:
如果不起作用,执行
source ~/.gdbinit参考: Debugging
- Special debugging commands for the assembly source code: dump_regs, dump_mem, dump_stack, dump_math (below cf. the textbook "PC Assembly Language")
- GNU Debugger gdb with graphical user interface: At the command prompt type the command "ddd executable &" , where you have to substitute "executable" by the name of the executable you want to debug, and hit enter. Then some window with the debugger will open.
- GNU Debugger gdb without the graphical user interface:
- Invocation:
- At the command prompt: Type the command "gdb executable" , where you have to substitute "executable" by the name of the executable you want to debug, and hit enter.
- Within the editor emacs: Type Alt-x, gdb and enter the name of the executable when the prompt appears.
- Starting the program: Type "g" and hit enter to move the program to the predefined breakpoint "asm_main" which is the begin of the assembler routine.
- Stepping through the program: Type "n" and hit enter.
- Customization: you may want to modify the printf command in the file .gdbinit in your home directory such that stepping through the program produces the desired output (cf. info gdb). You can reload the file .gdbinit into your current debugging session by typing "source ~/.gdbinit" and hitting enter after saving the file .gdbinit.
- Restarting the program: Type "r" and hit enter.
- Quitting the debugger: Type "q" and hit enter.
- Invocation:
下面,提供我自己写的gdb自动化脚本:直接放到HOME目录下启动gdb即可使用
特点:
- 保留历史命令信息(如同shell中的up、down)
- 记录gdb执行过程
- 可选的断点保留功能
- 会在当前调试目录下生成.gdb_history/.log.txt/.gdb_bp三个文件,同时这也意味着它们是独立的,可以随意调试任意目录下程序。
一个常用/通用的 .gdbinit 文件
# 保存历史命令
set history filename ./.gdb_history
set history save on


# 记录执行gdb的过程
set logging file ./.log.txt
set logging on


# 退出时不显示提示信息
#set confirm off


# 打印数组的索引下标
set print array-indexes on


# 每行打印一个结构体成员
set print pretty on


# 退出并保留断点
define qbp
save breakpoints ./.gdb_bp
quit
end
document qbp
Exit and save the breakpoint
end


# 保留历史工作断点
define downbp
save breakpoints ./.gdb_bp
end
document downbp
Save the historical work breakpoint
end


# 加载历史工作断点
define loadbp
source ./.gdb_bp
end
document loadbp
Load the historical work breakpoint
end
本脚本存在问题:
- 保留的.log.txt文件,是gdb执行过程的内容,所以,在长期的调试(大工程中),文件会相当庞大
GDB的print命令仅能打印基本数据类型,而像QString这样的复杂类型就无能为力了!
如果调试时不能看QString的值,很让人抓狂!!!幸好,GDB提供了扩展功能,可以自定义宏命令。
[GDB && QString - kaizen - 博客园](https://www.cnblogs.com/Braveliu/p/8426945.html)
| 【1】GDB && QString 【2】问题分析 本地使用宏命令过程中发现有问题,提示如下: "cannot resolve overloaded method `data': no arguments supplied” | 【3】修正命令 自定义宏命令内容修改如下(ps: 与上个版本差异仅在第5行): |
| define printqstring printf "(QString)0x%x (length=%i): \"",&$arg0,$arg0.d->size set $i=0 while $i < $arg0.d->size set $c=$arg0.d->data[$i++] if $c < 32 || $c > 127 printf "\\u0x%04x", $c else printf "%c", (char)$c end end printf "\"\n" end | define printqstring printf "(QString)0x%x (length=%i): \"",&$arg0,$arg0.d->size set $i=0 while $i < $arg0.d->size set $c=$arg0.d->data()[$i++] if $c < 32 || $c > 127 printf "\\u0x%04x", $c else printf "%c", (char)$c end end printf "\"\n" end |


 1686
1686

 被折叠的 条评论
为什么被折叠?
被折叠的 条评论
为什么被折叠?
 到【灌水乐园】发言


