


源代码:
##Copyright 2017 Thomas Paviot (tpaviot@gmail.com)
##
##This file is part of pythonOCC.
##
##pythonOCC is free software: you can redistribute it and/or modify
##it under the terms of the GNU Lesser General Public License as published by
##the Free Software Foundation, either version 3 of the License, or
##(at your option) any later version.
##
##pythonOCC is distributed in the hope that it will be useful,
##but WITHOUT ANY WARRANTY; without even the implied warranty of
##MERCHANTABILITY or FITNESS FOR A PARTICULAR PURPOSE.  See the
##GNU Lesser General Public License for more details.
##
##You should have received a copy of the GNU Lesser General Public License
##along with pythonOCC.  If not, see <http://www.gnu.org/licenses/>.

from __future__ import division, print_function

import math

from OCC.Core.gp import gp_Pnt
from OCC.Core.BRepBuilderAPI import (BRepBuilderAPI_MakeEdge,
                                     BRepBuilderAPI_MakeFace,
                                     BRepBuilderAPI_MakeWire)
from OCC.Core.TColgp import TColgp_Array2OfPnt
from OCC.Core.GeomAPI import GeomAPI_PointsToBSplineSurface
from OCC.Core.GeomFill import GeomFill_SimpleBound, GeomFill_ConstrainedFilling
from OCC.Core.GeomAbs import GeomAbs_C2
from OCC.Display.SimpleGui import init_display
from OCC.Core.BRepAdaptor import BRepAdaptor_CompCurve, BRepAdaptor_HCompCurve

try:
    from PIL import Image
    HAVE_PIL = True
except ImportError:
    print("PIL not found. Heightmap from image not available.")
    HAVE_PIL = False


def x2_y2(event=None):
    def f(x, y):
        """ Returns z = f(x,y)
        """
        z = x*x - y*y
        return z
    heightmap_from_equation(f)

def cosxsinxcosysiny(event=None):
    def f(x, y):
        z = 5 * math.cos(x) * math.sin(x) * math.sin(y) * math.cos(y)
        return z
    heightmap_from_equation(f, 0, math.pi, 0, math.pi)

def heightmap_from_equation(f, x_min=-1, x_max=1, y_min=-1, y_max=1):
    """ takes an equation z= f(x,y)
    and plot the related point cloud as a bspline surface
    """
    print("compute surface")
    n = 100
    # initialize x axis
    step_x = (x_max - x_min) / n
    x_ = []
    for i in range(n):
        x_.append(x_min + i* step_x)
    # initialize y axis
    step_y = (y_max - y_min) / n
    y_ = []
    for i in range(n):
        y_.append(y_min + i* step_y)
    # compute z
    array = TColgp_Array2OfPnt(1, len(x_), 1, len(y_))
    i = 1
    for x in x_:
        j = 1
        for y in y_:
            z = f(x, y)
            point_to_add = gp_Pnt(x, y, z)
            array.SetValue(i, j, point_to_add)
            j += 1
        i += 1
    print("bspline surface creation")
    bspl_surface = GeomAPI_PointsToBSplineSurface(array, 3, 8, GeomAbs_C2, 0.001).Surface()
    display.DisplayShape(bspl_surface, update=True)

def boundary_curve_from_2_points(p1, p2):
    # first create an edge
    e0 = BRepBuilderAPI_MakeEdge(p1, p2).Edge()
    w0 = BRepBuilderAPI_MakeWire(e0).Wire()
    # boundary for filling
    adap = BRepAdaptor_CompCurve(w0)
    p0_h = BRepAdaptor_HCompCurve(adap)
    boundary = GeomFill_SimpleBound(p0_h, 1e-6, 1e-6)
    return boundary

def heightmap_from_image(event=None):
    """ takes the heightmap from a jpeg file
    and apply a texture
    this example requires numpy/matplotlib
    """
    print("opening image")
    heightmap = Image.open('../assets/images/mountain_heightmap.jpg')
    heightmap.show()
    width = heightmap.size[0]
    height = heightmap.size[1]
    # create the gp_Pnt array
    print("parse image and fill in point array")
    for i in range(1, width):
        for j in range(1, height):
            # all 3 RGB values are equal, just take the first one
            # vertex 1
            height_value = heightmap.getpixel((i-1, j-1))[0]
            v1 = gp_Pnt(i, j, float(height_value)/10)
            # vertex 2
            height_value = heightmap.getpixel((i, j-1))[0]
            v2 = gp_Pnt(i+1, j, float(height_value)/10)
            # vertex 3
            height_value = heightmap.getpixel((i, j))[0]
            v3 = gp_Pnt(i+1, j+1, float(height_value)/10)
            # vertex 4
            height_value = heightmap.getpixel((i-1, j))[0]
            v4 = gp_Pnt(i, j+1, float(height_value)/10)
            # boundaries
            b1 = boundary_curve_from_2_points(v1, v2)
            b2 = boundary_curve_from_2_points(v2, v3)
            b3 = boundary_curve_from_2_points(v3, v4)
            b4 = boundary_curve_from_2_points(v4, v1)
            #
            bConstrainedFilling = GeomFill_ConstrainedFilling(8, 2)
            bConstrainedFilling.Init(b1, b2, b3, b4, False)
            srf1 = bConstrainedFilling.Surface()
            # make a face from this srf
            patch = BRepBuilderAPI_MakeFace()
            bounds = True
            toldegen = 1e-6
            patch.Init(srf1, bounds, toldegen)
            patch.Build()
            display.DisplayShape(patch.Face())
            # then create faces
        print("%s%%" % int(float(i) / width * 100))
        #display.process_events()
    display.FitAll()
    # finally display image
    heightmap.show()

if __name__ == "__main__":
    display, start_display, add_menu, add_function_to_menu = init_display()
    add_menu('heightmap')
    add_function_to_menu('heightmap', x2_y2)
    add_function_to_menu('heightmap', cosxsinxcosysiny)
    if HAVE_PIL:
        add_function_to_menu('heightmap', heightmap_from_image)
    start_display()
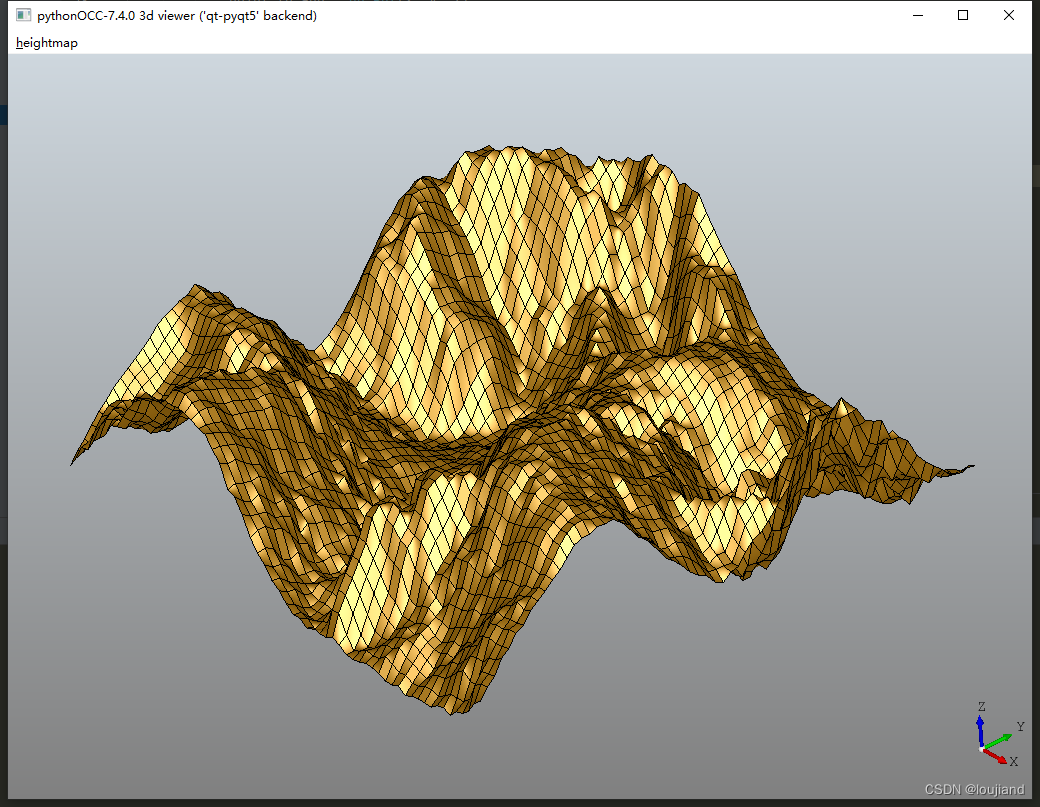
运行效果:生成基于拓扑结构的高度图


 9820
9820


 被折叠的 条评论
为什么被折叠?
被折叠的 条评论
为什么被折叠?
 到【灌水乐园】发言


