


Canvas绘图介绍
Canvas绘图是HTML5中引入的一个非常强大的特性,它允许开发者使用JavaScript在网页上绘制图形、图表、动画等。<canvas>元素提供了一个通过JavaScript和Canvas API进行绘图的环境。
创建绘图仪对象
// 定义一个名为 XYPlotter 的函数,该函数用于创建一个二维图形绘制器,接受一个参数 id,该参数是 canvas 元素的 ID
function XYPlotter(id) {
    // 通过提供的 id 获取 canvas DOM 元素
    this.canvas = document.getElementById(id);

    // 获取 canvas 的 2D 渲染上下文,用于后续的绘图操作
    this.ctx = this.canvas.getContext("2d");

    // 设置绘图区域的 x 轴最小值,这里初始化为 0
    this.xMin = 0;

    // 设置绘图区域的 y 轴最小值,这里也初始化为 0
    // 注意:在 canvas 中,y 轴是向下的,因此 0 对应于 canvas 的顶部
    this.yMin = 0;

    // 设置绘图区域的 x 轴最大值,这里使用 canvas 的宽度
    // 这意味着绘图区域的宽度与 canvas 的宽度相同
    this.xMax = this.canvas.width;

    // 设置绘图区域的 y 轴最大值,这里使用 canvas 的高度
    // 这意味着绘图区域的高度与 canvas 的高度相同
    // 注意:这并不意味着图形的实际显示区域会占满整个 canvas,只是定义了绘图的坐标范围,具体的图形需要进一步转换坐标来适应这个范围
    this.yMax = this.canvas.height;

}
添加绘制线条
// 在 XYPlotter 类的原型上添加一个名为 plotLine 的方法,用于绘制一条直线
// 该方法接受五个参数:x0, y0(起点的 x, y 坐标),x, y(终点的 x, y 坐标),以及 color(线条的颜色)
this.plotLine = function(x0, y0, x, y, color) {
  // 使用 moveTo 方法设置线条的起点坐标
  this.ctx.moveTo(x0, y0);

  // 使用 lineTo 方法设置线条的终点坐标,此时线条的起点和终点已经确定,但尚未绘制
  this.ctx.lineTo(x, y);

  // 设置线条的颜色
  this.ctx.strokeStyle = color;

  // 使用 stroke 方法实际绘制线条,此时会根据 moveTo 和 lineTo 设置的起点和终点,以及 strokeStyle 设置的颜色来绘制线条
  this.ctx.stroke();

  // 注意:在调用 plotLine 方法之前,需要确保 XYPlotter 的实例已经正确创建,
  // 并且其 canvas 和 ctx 属性已经通过构造函数初始化。
  // 此外,由于 canvas 的坐标系统默认左上角为原点 (0,0),且 y 轴向下延伸,因此在绘制图形时需要注意坐标的转换,以确保图形按照预期的方式显示。
}
完整代码:
<!DOCTYPE html>
<html>
<body>
<canvas id="myCanvas" width="400px" height="400px" style="width:100%;max-width:400px;border:1px solid black"></canvas>
<script>
// 创建一个绘图仪
let myPlotter = new XYPlotter("myCanvas");
// 绘制一条线
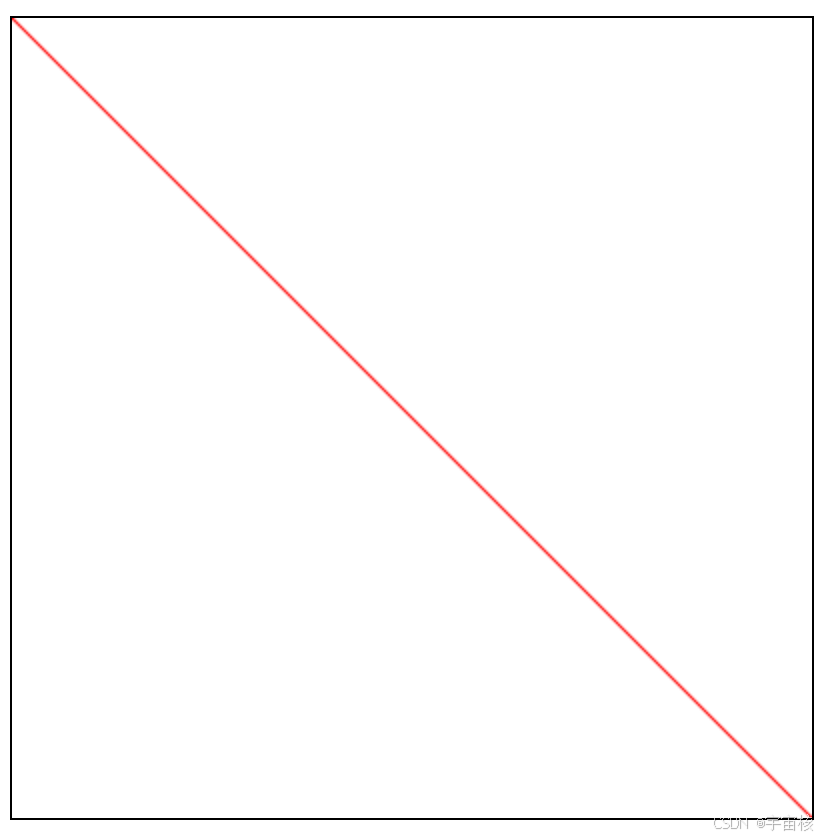
myPlotter.plotLine(0, 0, myPlotter.xMax, myPlotter.yMax, "red");
// 绘图仪对象
function XYPlotter(id) {
// 获取指定ID的canvas元素
this.canvas = document.getElementById(id);
// 获取canvas的2D渲染上下文
this.ctx = this.canvas.getContext("2d");
// 设置x轴的最小值
this.xMin = 0;
// 设置y轴的最小值
this.yMin = 0;
// 设置x轴的最大值,默认为canvas的宽度
this.xMax = this.canvas.width;
// 设置y轴的最大值,默认为canvas的高度
this.yMax = this.canvas.height;
// 绘制线条
this.plotLine = function(x0, y0, x, y, color) {
// 移动到线条的起始点
this.ctx.moveTo(x0, y0);
// 绘制线条到终点
this.ctx.lineTo(x, y);
// 设置线条的颜色
this.ctx.strokeStyle = color;
// 绘制线条
this.ctx.stroke();
}
}
</script>
</body>
</html>运行结果:
添加转换 XY 值
// 定义一个变换函数,用于调整canvas的坐标系
// 这个函数将canvas的坐标系统从默认的左上角为原点(0,0),y轴向下,
// 转换为以左上角为原点(0,0),但y轴向上的坐标系统,类似于数学中的笛卡尔坐标系

this.transformXY = function() {
  // 参数依次为:a(水平缩放), b(水平倾斜), c(垂直倾斜), d(垂直缩放), e(水平移动), f(垂直移动)
  // 在这里,我们设置a=1(不改变x轴方向的缩放),b=0(不在x轴方向倾斜),
  // c=0(不在y轴方向倾斜),d=-1(将y轴方向反转,实现y轴向上),
  // e=0(不在x轴方向移动),f=canvas.height(在y轴方向移动,使得原坐标系的(0,0)位于canvas的左上角)
  this.ctx.transform(1, 0, 0, -1, 0, this.canvas.height);

}
完整代码:
<!DOCTYPE html>
<html>
<body>
<canvas id="myCanvas" width="400px" height="400px" style="width:100%;max-width:400px;border:1px solid black"></canvas>
<script>
// 创建一个绘图仪
let myPlotter = new XYPlotter("myCanvas");
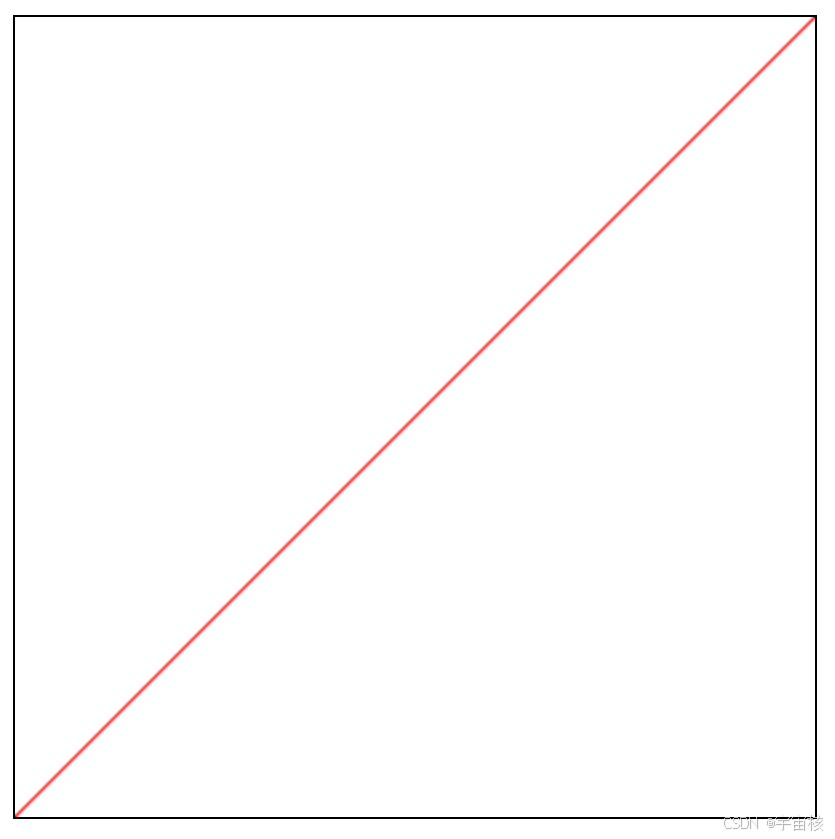
myPlotter.transformXY(); // 调用变换函数,以调整canvas的坐标系
// 绘制一条线
myPlotter.plotLine(0, 0, myPlotter.xMax, myPlotter.yMax, "red"); // 从(0,0)绘制到(xMax, yMax)的红色线条
// 绘图仪对象
function XYPlotter(id) {
this.canvas = document.getElementById(id);
this.ctx = this.canvas.getContext("2d");
this.xMin = 0;
this.yMin = 0;
this.xMax = this.canvas.width;
this.yMax = this.canvas.height;
// XY变换函数
this.transformXY = function() {
// 变换canvas的坐标系,使得y轴向上为正
this.ctx.transform(1, 0, 0, -1, 0, this.canvas.height);
}
// 绘制线条的函数
this.plotLine = function(x0, y0, x, y, color) {
// 移动到线条的起始点
this.ctx.moveTo(x0, y0);
// 绘制线条到终点
this.ctx.lineTo(x, y);
// 设置线条的颜色
this.ctx.strokeStyle = color;
// 绘制线条
this.ctx.stroke();
}
}
</script>
</body>
</html>运行结果:
添加绘制点
// 绘制点集的方法
    // n:要绘制的点的数量
    // xArr:一个数组,包含每个点的x坐标
    // yArr:一个数组,包含每个点的y坐标
    // color:用于填充圆的颜色
    // radius(默认为3):圆的半径
this.plotPoints = function(n, xArr, yArr, color, radius = 3) {
  // 遍历点集中的每一个点
  for (let i = 0; i < n; i++) {
    // 设置填充颜色
    this.ctx.fillStyle = color;
    // 开始一个新的路径
    this.ctx.beginPath();
    // 绘制一个椭圆(当宽度和高度相等时,它就是一个圆)
    // 参数依次为:中心点x坐标, 中心点y坐标, 半径x, 半径y, 旋转角度, 起始角度, 结束角度
    // 在这里,我们绘制的是圆,所以半径x和半径y相等,旋转角度为0,起始角度为0,结束角度为2π
    this.ctx.ellipse(xArr[i], yArr[i], radius, radius, 0, 0, Math.PI * 2);
    // 填充当前路径(即圆)
    this.ctx.fill();
  }
}
绘制一些随机点
// 创建一个绘图仪实例,关联到ID为"myCanvas"的canvas元素
let myPlotter = new XYPlotter("myCanvas");
// 定义要绘制的点的数量
numPoints = 500;
// 创建一个数组,用于存储x坐标的随机值
// 首先,使用Array(numPoints).fill(0)创建一个长度为numPoints且所有元素都为0的数组
// 然后,使用map函数遍历这个数组,对于每个元素,生成一个0到myPlotter.xMax之间的随机数作为x坐标
// 这样,xPoints数组就包含了numPoints个x坐标的随机值
const xPoints = Array(numPoints).fill(0).map(function(){return Math.random() * myPlotter.xMax});
// 创建一个数组,用于存储y坐标的随机值
// 类似于xPoints的创建过程,但这次是生成y坐标的随机值
const yPoints = Array(numPoints).fill(0).map(function(){return Math.random() * myPlotter.yMax});
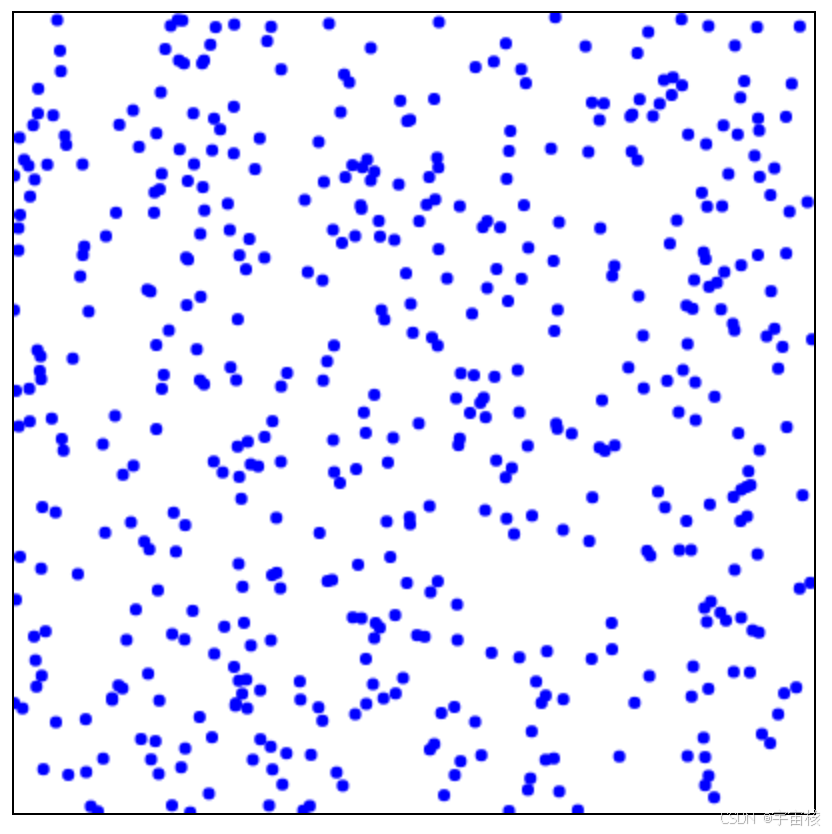
// 调用绘图仪的plotPoints方法,绘制这些点
// 传入点的数量(numPoints),x坐标数组(xPoints),y坐标数组(yPoints),以及点的颜色("blue")
myPlotter.plotPoints(numPoints, xPoints, yPoints, "blue");完整代码:
<!DOCTYPE html>
<html>
<body>
<canvas id="myCanvas" width="400px" height="400px" style="width:100%;max-width:400px;border:1px solid black"></canvas>

<script>
// 创建一个XY绘图仪
let myPlotter = new XYPlotter("myCanvas");

// 创建随机XY点
numPoints = 500;
const xPoints = Array(numPoints).fill(0).map(function(){return Math.random() * myPlotter.xMax});
const yPoints = Array(numPoints).fill(0).map(function(){return Math.random() * myPlotter.yMax});

// 绘制点
myPlotter.plotPoints(numPoints, xPoints, yPoints, "blue");

// 绘图仪对象
function XYPlotter(id) {
  this.canvas = document.getElementById(id);
  this.ctx = this.canvas.getContext("2d");
  this.xMin = 0;
  this.yMin = 0;
  this.xMax = this.canvas.width;
  this.yMax = this.canvas.height;

  // 绘制点集的方法
  this.plotPoints = function(n, xArr, yArr, color, radius = 3) {
    // 遍历点集中的每一个点
    for (let i = 0; i < n; i++) {
      // 设置填充颜色
      this.ctx.fillStyle = color;
      // 开始一个新的路径
      this.ctx.beginPath();
      // 绘制一个圆(通过ellipse方法,宽度和高度相等时即为圆)
      this.ctx.ellipse(xArr[i], yArr[i], radius, radius, 0, 0, Math.PI * 2);
      // 填充当前路径(即圆)
      this.ctx.fill();
    }
  }

} // 绘图仪对象结束
</script>

</body>
</html>
运行结果:
结合以上方法:
function XYPlotter(id) {
  this.canvas = document.getElementById(id);
  this.ctx = this.canvas.getContext("2d");
  this.xMin = 0;
  this.yMin = 0;
  this.xMax = this.canvas.width;
  this.yMax = this.canvas.height;

  // 绘图线函数
  this.plotLine = function(x0, y0, x, y, color) {
    this.ctx.moveTo(x0, y0);
    this.ctx.lineTo(x, y);
    this.ctx.strokeStyle = color;
    this.ctx.stroke();
  };

  // 变换 XY 函数(翻转Y轴)
  this.transformXY = function() {
    this.ctx.transform(1, 0, 0, -1, 0, this.canvas.height);
  };

  // 绘制点集函数
  this.plotPoints = function(n, xArr, yArr, color, radius = 3) {
    for (let i = 0; i < n; i++) {
      this.ctx.fillStyle = color;
      this.ctx.beginPath();
      this.ctx.ellipse(xArr[i], yArr[i], radius, radius, 0, 0, Math.PI * 2);
      this.ctx.fill();
    }
  };
}
将其保存在"myplotlib.js"文件中
执行代码:
<!DOCTYPE html>
<html>
<script src="myplotlib.js"></script>
<body>
<canvas id="myCanvas" width="400px" height="400px" style="width:100%;max-width:400px;border:1px solid black"></canvas>
<script>
// 创建一个绘图仪
let myPlotter = new XYPlotter("myCanvas");
myPlotter.transformXY(); // 变换XY轴,翻转Y轴
// 创建随机XY点
let numPoints = 500;
const xPoints = Array(numPoints).fill(0).map(function(){return Math.random() * myPlotter.xMax}); // 生成x坐标数组
const yPoints = Array(numPoints).fill(0).map(function(){return Math.random() * myPlotter.yMax}); // 生成y坐标数组
// 绘制点
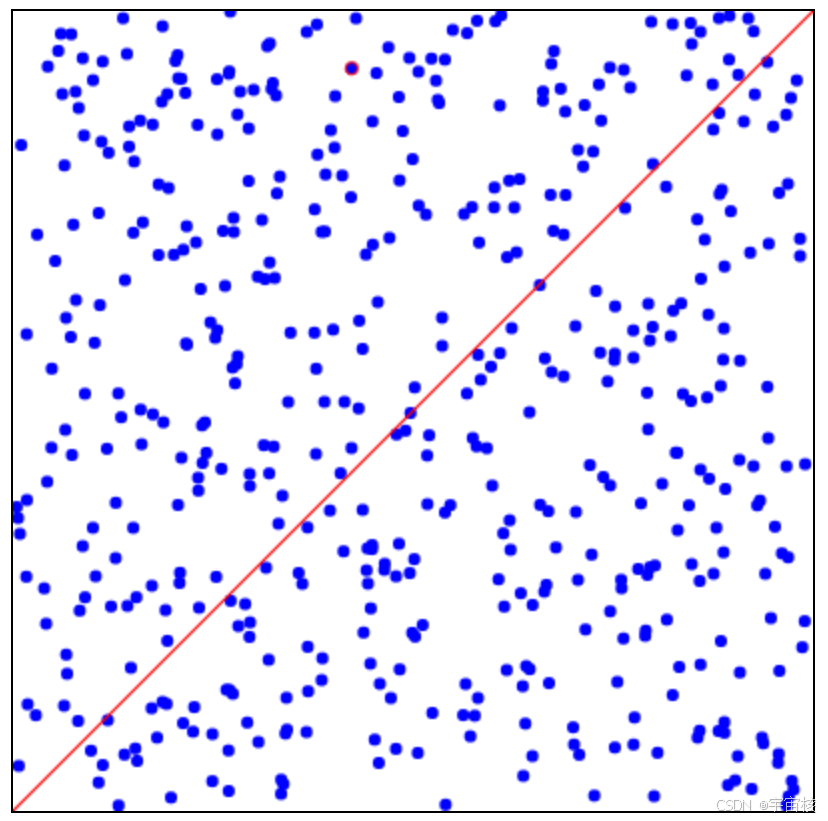
myPlotter.plotPoints(numPoints, xPoints, yPoints, "blue"); // 使用蓝色绘制点
// 绘制一条线
myPlotter.plotLine(0, 0, myPlotter.xMax, myPlotter.yMax, "red"); // 使用红色从左下角绘制到右上角
</script>
</body>
</html>运行结果:


 5184
5184

 被折叠的 条评论
为什么被折叠?
被折叠的 条评论
为什么被折叠?
 到【灌水乐园】发言


