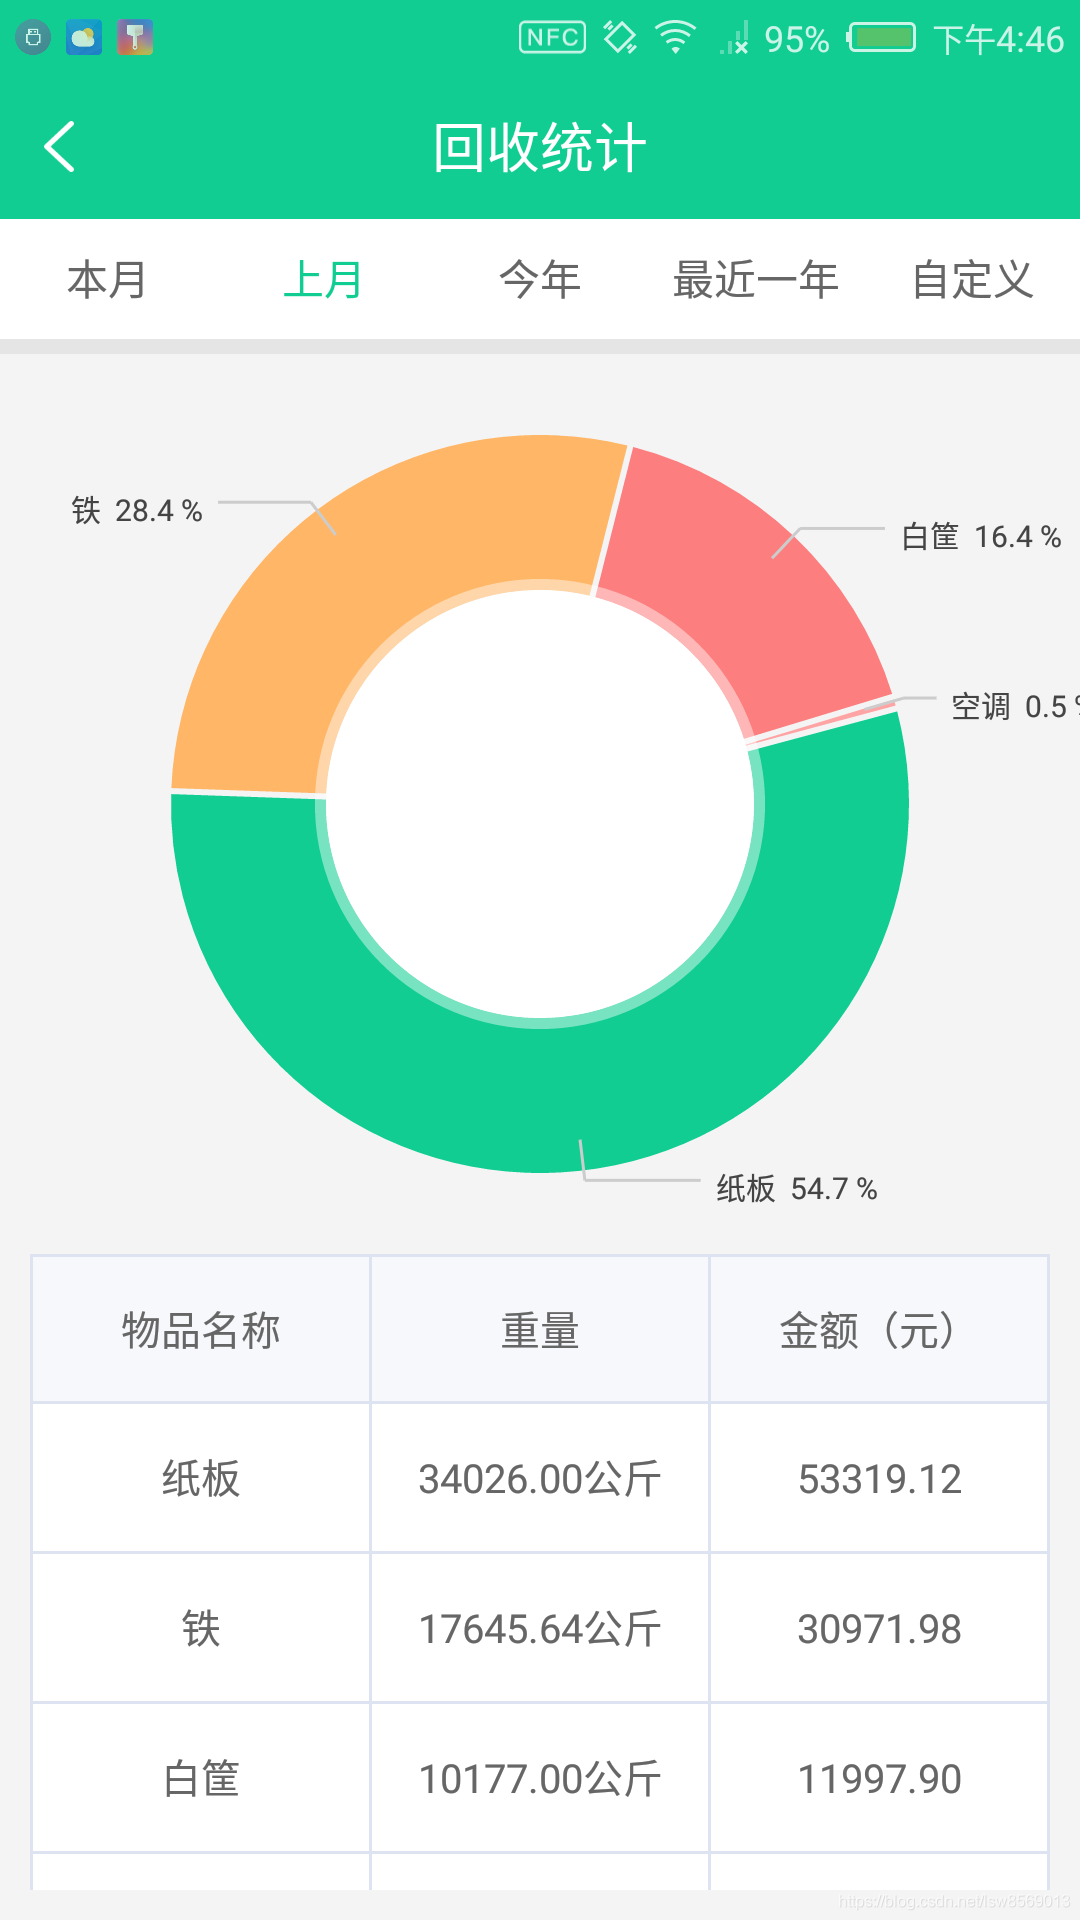
1. 饼图 加载数据并显示代码
private void loadPieData(List<OutCountResultBean.BodyBean.StorageOutBean> rcyList) {
        List<PieEntry> pieList = new ArrayList<>();
        double allCount = 0;
        for (OutCountResultBean.BodyBean.StorageOutBean rcyListBean : rcyList) {
            allCount += rcyListBean.getOutNetWeight();
        }


        for (int i = 0; i < rcyList.size(); i++) {
            PieEntry pieEntry = new PieEntry(((float) (rcyList.get(i).getOutNetWeight() / allCount)) * 100.0f, rcyList.get(i).getGoodsName());
            pieList.add(pieEntry);
        }


        PieDataSet dataSet = new PieDataSet(pieList, "Label");

        // 设置颜色list,让不同的块显示不同颜色,下面是我觉得不错的颜色集合,比较亮
        ArrayList<Integer> colors = new ArrayList<Integer>();
        colors.add(0xFF12CD92);
        colors.add(0xFFFFB667);
        colors.add(0xFFFC7E7E);
        colors.add(0xFFFFA4A4);
        dataSet.setColors(colors);
        PieData pieData = new PieData(dataSet);

        // 设置描述,我设置了不显示,因为不好看,你也可以试试让它显示,真的不好看
        Description description = new Description();
        description.setEnabled(false);
        mPieChart.setDescription(description);
        //设置半透明圆环的半径, 0为透明
        mPieChart.setTransparentCircleRadius(0f);

        //设置初始旋转角度
        mPieChart.setRotationAngle(-15);

        // 显示饼图上面字体颜色
//        mPieChart.setEntryLabelColor(0xFFFF0000);

        //数据连接线距图形片内部边界的距离,为百分数
        dataSet.setValueLinePart1OffsetPercentage(80f);

        //设置连接线的颜色
        dataSet.setValueLineColor(Color.LTGRAY);
        // 连接线在饼状图外面
        dataSet.setYValuePosition(PieDataSet.ValuePosition.OUTSIDE_SLICE);

        // 设置饼块之间的间隔
        dataSet.setSliceSpace(2f);
        dataSet.setSelectionShift(5f);
        dataSet.setHighlightEnabled(true);
        // 不显示图例
        Legend legend = mPieChart.getLegend();
        legend.setEnabled(false);

        // 和四周相隔一段距离,显示数据
        mPieChart.setExtraOffsets(26, 5, 26, 5);

        mPieChart.setDrawHoleEnabled(true);
        mPieChart.setHoleColor(Color.WHITE);

        mPieChart.setTransparentCircleColor(Color.WHITE);
        mPieChart.setTransparentCircleAlpha(110);

        mPieChart.setHoleRadius(58f);
        mPieChart.setTransparentCircleRadius(61f);

        // 设置pieChart图表是否可以手动旋转
        mPieChart.setRotationEnabled(false);
        // 设置piecahrt图表点击Item高亮是否可用
        mPieChart.setHighlightPerTapEnabled(true);
        // 设置pieChart图表展示动画效果,动画运行1.4秒结束
        mPieChart.animateY(1400, Easing.EasingOption.EaseInOutQuad);
        //设置pieChart是否只显示饼图上百分比不显示文字
        mPieChart.setDrawEntryLabels(true);
        //是否绘制PieChart内部中心文本
        mPieChart.setDrawCenterText(false);
        // 绘制内容value,设置字体颜色大小
        pieData.setDrawValues(true);
        pieData.setValueFormatter(new PercentFormatter());
        pieData.setValueTextSize(10f);
        pieData.setValueTextColor(Color.DKGRAY);


        mPieChart.setData(pieData);
        // 更新 mPieChart 视图
        mPieChart.postInvalidate();


    }
2. 在饼图外边 显示类型名称 + values

/**
 * @description:重新编辑显示的名字信息
 * @author: Created by lsw
 * @date: 2019/3/4 16:29
 */
public class PieValueFormatter extends PercentFormatter {


    private  List<RecycleCountResultBean.BodyBean.RcyListBean> dateList;

    public PieValueFormatter(List<RecycleCountResultBean.BodyBean.RcyListBean> rcyList) {
        this.dateList = rcyList;
    }

    @Override
    public String getFormattedValue(float value, Entry entry, int dataSetIndex, ViewPortHandler viewPortHandler) {
//        LogUtil.e(dataSetIndex+" --- values index ----- ");
        return ((PieEntry)entry).getLabel() +" \n" + mFormat.format(value) + " %";
    }
}


 1443
1443

 被折叠的 条评论
为什么被折叠?


