


1.chartlist建立一个图表
var dataSales3 = {
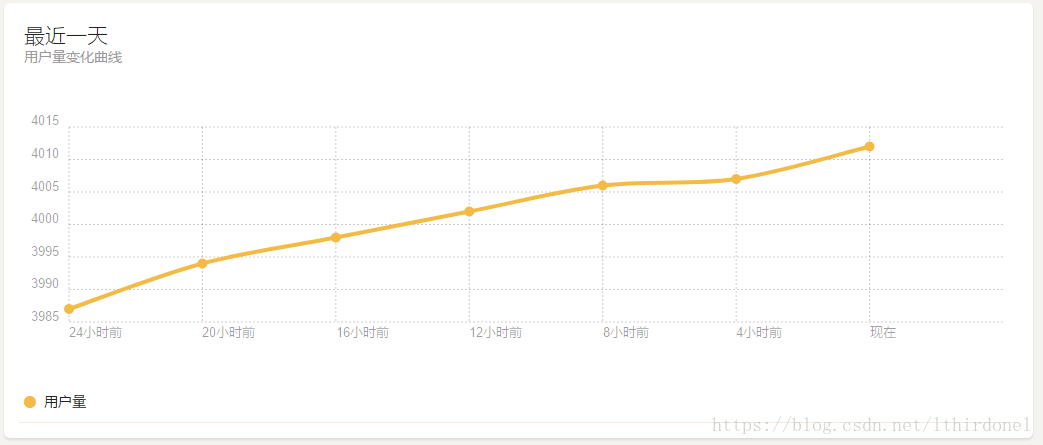
labels: ['24小时前', '20小时前', '16小时前', '12小时前', '8小时前', '4小时前','现在'],
series: [
result.day
]
};
var chart=new Chartist.Line('#chartday', dataSales3);
2.修改线条颜色
				chart.on('draw', function(context) {
					  if(context.type === 'line') {
						context.element.attr({
						style: 'stroke: #F3BB45;'
						});
					  }
					  if(context.type === 'point') {
						context.element.attr({
						style: 'stroke: #F3BB45;'
						});
					  }
					});


 466
466


 被折叠的 条评论
为什么被折叠?
被折叠的 条评论
为什么被折叠?
 到【灌水乐园】发言


