


前言
码上掘金迎新年🎉活动开始好久了,大佬们也已经发了各种总结报告[1]。但是我在码上掘金上面请求 api.juejin.cn 接口用户数据时报错 "name":"TypeError","message":"Failed to fetch",通过打印 console.log(location.href) 显示为 code.devrank.cn,这应该是跨域的问题。
所以,有些总结报告不能正常显示应该都是类似的问题。昨天终于发现茶无味的一天[2]的作品2022年终总结互动网页[3],可以正常显示掘金接口的数据。

给大佬留言得到回复是请求的跨域请求的代理网站,因为发现还没有人做关于 ECharts 的报表,所以征得同意可以调用接口后,做了这个 ECharts 报表[4]。
ECharts 报表
是百度的一个开源的数据可视化工具,一个纯 Javascript 的图表库,能够在 PC 端和移动设备上流畅运行,兼容当前绝大部分浏览器。
引入 ECharts
虽然我们大部分使用 ECharts 是在 node 项目中,但为了简单,这里通过 CDN 链接的方式引入。
https://cdn.staticfile.org/echarts/4.7.0/echarts.min.js
复制代码
准备容器
使用 Echarts 绘制图表前需要先有一个有宽高的 DOM 容器,代码如下:
<div id="main" style="width: 600px; height: 400px;"></div>
<div id="main2" style="width: 600px; height: 400px;"></div>
<div id="main3" style="width: 100%;height: 400px;"></div>
复制代码
以上定义了三个容器,一个饼图用来显示掘金账号信息,一个饼图用来显示用户的创作信息,一个柱图用来显示用户阅读量前十文章的阅读量、点赞、收藏、评论数量。
初始化容器
然后就可以通过 echarts.init 方法初始化 echarts 实例。
const myChart = echarts.init(document.getElementById('main'));
const myChart2 = echarts.init(document.getElementById('main2'));
const myChart3 = echarts.init(document.getElementById('main3'));
复制代码
开启 loading 效果
如果数据获取需要一定时间,我们可以使用 ECharts 的 loading 效果。
myChart.showLoading();
myChart2.showLoading();
myChart3.showLoading();
复制代码
获取掘金 ID
通过 prompt 函数获取输入的掘金 ID,这里设置了默认值为我自己的。
const id = prompt('请输入您的掘金 ID', '2208296065832264');
复制代码
获取数据
通过浏览器的 fetch 方法来获取代理网站的掘金网站接口数据。
fetch('https://juejin.palxp.com/user?id=' + id).then(res => res.json())
复制代码
在请求数据成功时,隐藏 loading 效果。
myChart.hideLoading();
myChart2.hideLoading();
myChart3.hideLoading();
const { list, user } = res.result;
const collect_count = list.map(x => +x.collect_count).reduce((a, b) => a + b, 0);
const { digg, view, fans, follow, power, name } = user;
复制代码
各个字段的说明:
list - 文章列表。
user - 用户信息。
collect_count - 由于没有收藏总数这个字段,所以根据每篇文章的收藏数叠加得到收藏总数。
digg - 文章点赞总数。
view - 文章浏览总数。
fans - 用户关注者数量。
follow - 用户关注数量。
power - 用户掘力值。
name - 掘金用户名。
对文章列表根据阅读量排序,截取阅读量前十的文章。
const ten = list.sort((a, b) => b.view_count - a.view_count).slice(0, 10);
复制代码
配置信息
使用 json 格式来设置配置信息。
const option = {
title: {
text: name + ' 账号信息',
x: 'center'
},
tooltip: {
formatter: "{a} <br/>{b} : {c} ({d}%)"
},
series: [{
name: name + ' 账号信息',
type: 'pie',
radius: '55%',
data: [{
name: '关注者',
value: fans
}, {
name: '关注',
value: follow
}, {
name: '掘力值',
value: power
}]
}]
};
const option2 = {
title: {
text: name + ' 创作信息',
x: 'center'
},
tooltip: {
formatter: "{a} <br/>{b} : {c} ({d}%)"
},
series: [{
name: name + ' 创作信息',
type: 'pie',
radius: '55%',
data: [{
name: '获得点赞',
value: digg
}, {
name: '获得收藏',
value: collect_count
}, {
name: '文章被阅读',
value: view
}]
}]
};
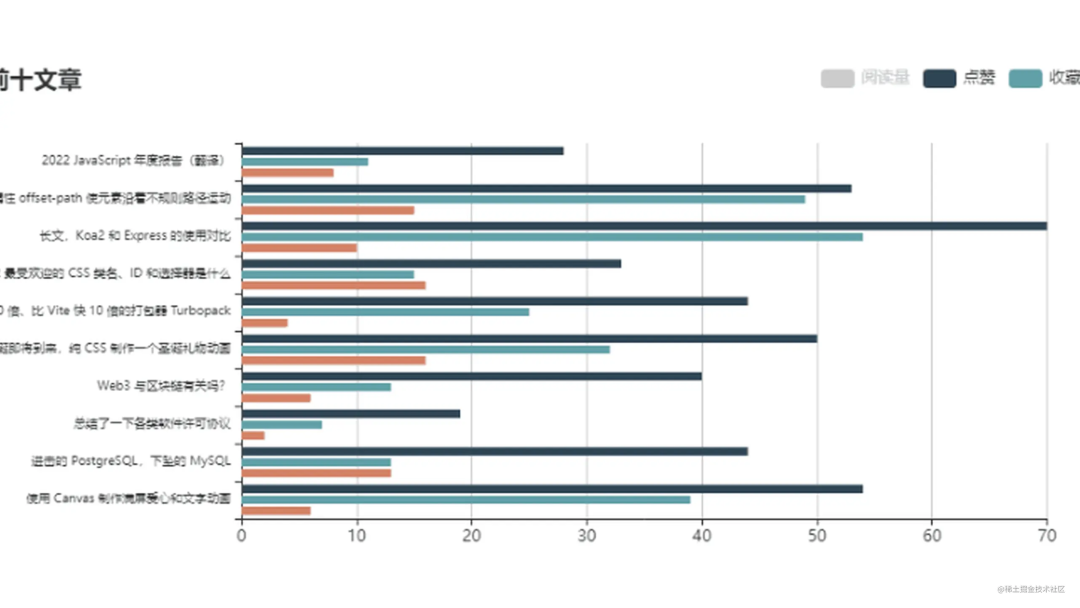
const option3 = {
title: {
text: '阅读量前十文章',
},
tooltip: {},
legend: {
right: 0,
data: ['阅读量', '点赞', '收藏', '评论'],
selected: {
'阅读量': false,
}
},
grid: {
x: isMobile ? 150 : 250,
},
xAxis: {},
yAxis: {
data: ten.map(v => v.title),
axisLabel: {
textStyle: {
fontSize: isMobile ? 5 : 9
}
}
},
series: [{
name: '阅读量',
type: 'bar',
data: ten.map(v => v.view_count)
}, {
name: '点赞',
type: 'bar',
data: ten.map(v => v.digg_count)
}, {
name: '收藏',
type: 'bar',
data: ten.map(v => v.collect_count)
}, {
name: '评论',
type: 'bar',
data: ten.map(v => v.comment_count)
}]
};
myChart.setOption(option);
myChart2.setOption(option2);
myChart3.setOption(option3);
复制代码各个字段的说明:
title - 图表标题。
tooltip - 鼠标悬停时提示框信息。
series - 系列列表。
name - 系列名称。
type - 每个系列通过 type 决定自己的图表类型。
radius - 饼图的半径。
data - 系列的数据,name 和 value 的键值对。
由于移动端比 PC 端屏幕宽度小,所以判断一下设备,移动端设置较小的字体和坐标轴标签宽度。
const isMobile = /Android|webOS|iPhone|iPad|iPod|BlackBerry|IEMobile|Opera Mini/i.test(navigator.userAgent);
复制代码
由于柱图中阅读量和其他分类的数量差距比较大,所以默认隐藏阅读量数据显示,可以点击右侧类别图标切换显示。

设置循环动画
有时候我们会需要在程序里调用方法并触发图表的行为,比如显示 tooltip。ECharts 通过 dispatchAction({ type: '' }) 来触发图表行为,统一管理了所有动作,也可以根据需要去记录用户的行为路径。
function loop(myChart, option) {
  let currentIndex = -1;
  setInterval(function() {
    const { length } = option.series[0].data;
    myChart.dispatchAction({
      type: 'downplay',
      seriesIndex: 0,
      dataIndex: currentIndex
    });
    currentIndex = (currentIndex + 1) % length;
    myChart.dispatchAction({
      type: 'highlight',
      seriesIndex: 0,
      dataIndex: currentIndex
    });
    myChart.dispatchAction({
      type: 'showTip',
      seriesIndex: 0,
      dataIndex: currentIndex
    });
  }, 1000);
}
复制代码
这里我们通过 setInterval 函数循环触发三个 Action。
downplay - 取消高亮指定的数据图形。
highlight - 高亮指定的数据图形。
showTip - 有下面两种使用方式。
dispatchAction({
  type: 'showTip',
  // 屏幕上的 x 坐标
  x: number,
  // 屏幕上的 y 坐标
  y: number,
  // 本次显示 tooltip 的位置。只在本次 action 中生效。
  // 缺省则使用 option 中定义的 tooltip 位置。
  position: Array.<number>|string|Function
})
复制代码
dispatchAction({ type: 'showTip', // 系列的 index,在 tooltip 的 trigger 为 axis 的时候可选。 seriesIndex?: number, // 数据的 index,如果不指定也可以通过 name 属性根据名称指定数据 dataIndex?: number, // 可选,数据名称,在有 dataIndex 的时候忽略 name?: string, // 本次显示 tooltip 的位置。只在本次 action 中生效。 // 缺省则使用 option 中定义的 tooltip 位置。 position: Array.<number>|string|Function, }) 复制代码根据 tooltip 的配置项显示提示框。
指定在相对容器的位置处显示提示框。
码上掘金
关于本文:
来自:zkj
https://juejin.cn/post/7185515505132765240
最后
欢迎关注【前端瓶子君】✿✿ヽ(°▽°)ノ✿
回复「算法」,加入前端编程源码算法群,每日一道面试题(工作日),第二天瓶子君都会很认真的解答哟!
回复「交流」,吹吹水、聊聊技术、吐吐槽!
回复「阅读」,每日刷刷高质量好文!
如果这篇文章对你有帮助,「在看」是最大的支持
》》面试官也在看的算法资料《《
“在看和转发”就是最大的支持


 6041
6041


 被折叠的 条评论
为什么被折叠?
被折叠的 条评论
为什么被折叠?
 到【灌水乐园】发言


