


本文主要讲解根据多点,绘制平滑曲线。且xy坐标轴根据点的大小,自适应xy轴的刻度。
比如点是1~8.5范围内的,坐标轴范围可以为0~9;如果是0-35.8范围内,坐标轴可以为0~40。
即根据数据范围,确定坐标轴范围。
一、基础知识
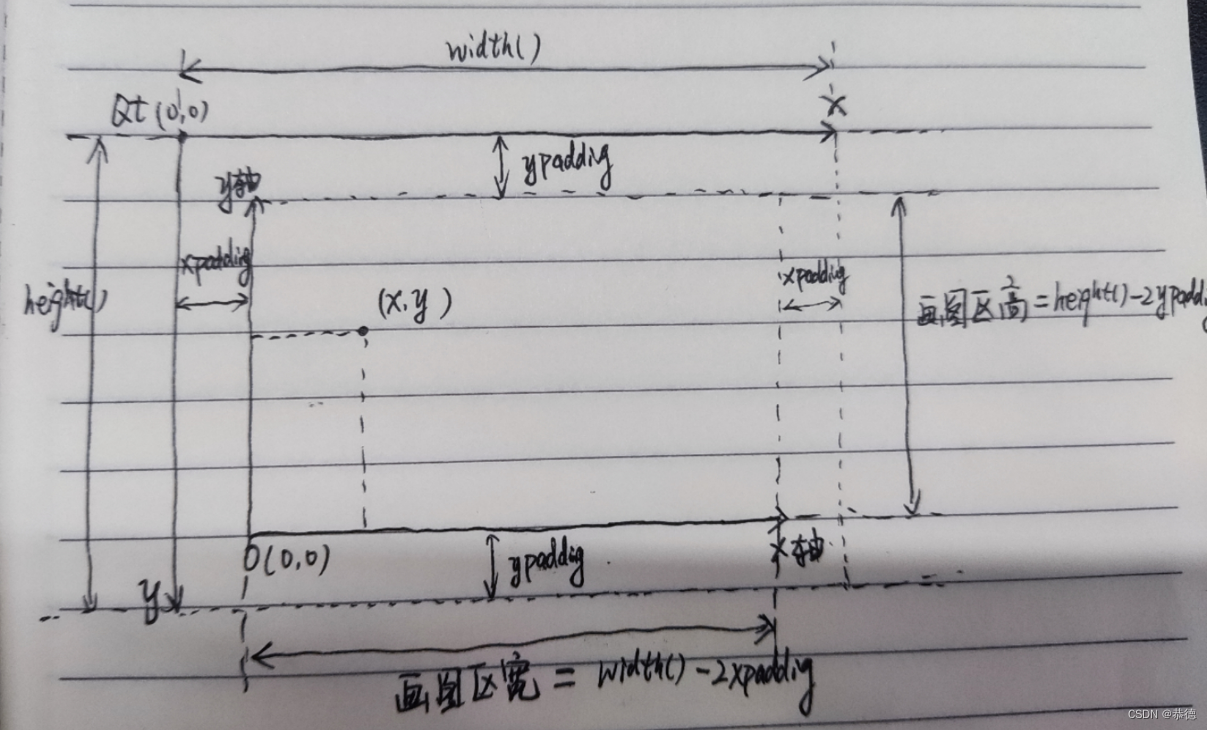
好了下面进入正题,要搞懂几个东西。就是我们数学中的点(后面简称【数点】)与QT中的点(后面简称【QT点】)的对应关系。中间还涉及到XY轴【画图区域】坐标(后面简称【图点】)和QT坐标的关系。
要画好图,就是要知道怎么把【数点】转为【QT点】。这样你就知道点画在哪里。
1、【图点】与【QT点】转换关系
如图:我们自定义QWidget,QWidget的大小就是height()*width()。我们预留画图区域与QWidget内边距分别是左右xpadding,上下ypadding。这个边距可以自己定义,也可以上下不一样宽。留这个边距是为了画坐标轴的数值相关。
【QT点】:是以左上角为原点(Qt(0,0)),以水平向右为x递增,以竖直向下为y递增。所以最右下角就是QPointF(width(),height())。右上角就是QPointF(widht(),0);以此类推。
【画图区域】:就是我们选定一个区域作为画图区域,来画x轴,y轴。
【图点】:就是画图区域的点位置。
比如图点(x,y)是相对于画图区域的原点o(0,0)的相对位置。这样是不是和坐标轴有点像了。
那图点转为QT点怎么转呢,从图中不难看出这样的关系。
QT点的x坐标=xpadding+x;
QT点的y坐标=height()-ypadding-y;
const QPointF GraphWidget::screenPointMaptoQTPoint(const QPointF &scPoint)
{
    return QPointF(scPoint.x() + xpadding, height() - ypadding - scPoint.y());
}
2、【数点】与【图点】转换关系
其实就是比例尺的问题。就是根据所有【数点】的xy大小,来选择一个合适的xy轴的范围。然后这个xy轴上面多长对应【画图区】的多少像素。这样【数点】就能等比缩放到【画图区域】。
举个例子。【画图区域】尺寸是300px(宽)*200px(高)。而所有【数点】的范围,x范围为0-33.5,y范围为0-8.5。那么我们可以取x轴的范围0~40(即minX=0,maxX=40),y轴范围0~9(minY=0;maxY=9)。这样所有的点都能在这个X轴y轴的范围内。所以我们的数据等比缩放就是。
x轴范围大小maxX-minX=40;对应【画图区域】宽(300px);所以缩放比例为kx=300/40;
y轴范围大小maxY-minY=9;对应【画图区域】高(200px);所以缩放比例为ky=200/9;
所以【数点】(xm,ym)转为【图点】是如下关系。
const QPointF GraphWidget::mathMaptoScreenPoint(const double &xm, const double &ym)
{
    return QPointF(qRound64((xm - minX) * kx), qRound64((ym - minY) * ky));
}
3、【数点】与【QT点】转换关系
从1与2可以很容易知道他们之间的转换关系了。
const QPointF GraphWidget::mathMaptoQTPoint(const double &xm, const double &ym)
{
    return screenPointMaptoQTPoint(mathMaptoScreenPoint(xm,ym));
}
二、绘图
原理搞明白了,画图就简单了。定义GraphWidget。直接上代码。
1、画坐标系
2、画曲线
3、画极点(可选)、坐标轴说明。
#ifndef GRAPHWIDGET_H
#define GRAPHWIDGET_H

#pragma once
#include <QPaintEvent>
#include <QPainter>
#include <QWidget>
// 坐标
struct CoordinateXY {
    CoordinateXY(const double &_x = -1, const double &_y = -1) : x(_x), y(_y) { }
    double x;
    double y;
};

struct GraphDataInfo {
    GraphDataInfo() : min(0), max(0), space(5), k(1), unit("") { }
    inline double range() { return max - min; }
    double min;   // 坐标轴最小刻度值
    double max;   // 坐标轴最大刻度值
    int space;    // 刻度分割多少列(行)
    double k;     // xy放大倍数=屏幕大小/范围
    QString unit; // x轴,y轴显示内容
};

class GraphWidget : public QWidget
{
    Q_OBJECT
public:
    GraphWidget(QWidget *parent = nullptr);
    ~GraphWidget();
    /// @brief 设置xy坐标点列表数据
    /// @param xyListy 数学中的坐标点list
    /// @param polexy 极点,可画可不画,看需要
    /// @param xUnit x轴显示内容包括单位
    /// @param yUnit y轴显示内容包括单位
    void setXYDoubleData(const QList<CoordinateXY> &xyList, const QString &xUnit = "", const QString &yUnit = "",
                         const CoordinateXY &polexy = CoordinateXY());
    void setDrawPole(bool draw);

protected:
    virtual void paintEvent(QPaintEvent *event) override;

private:
    /// @brief 数点转换为QT点位置。
    /// @param xm 数据x
    /// @param ym 数据y
    /// @return
    const QPointF mathMaptoQTPoint(const CoordinateXY &mathxy);
    /// @brief 画图区域点换为QT点位置
    /// @param scPoint
    /// @return
    const QPointF screenPointMaptoQTPoint(const QPointF &scPoint);
    /// @brief 数点转换为画图区域点位置
    /// @param scPoint
    /// @return
    const QPointF mathMaptoscreenPoint(const CoordinateXY &mathxy);
    /// @brief 获取列表中最大或最小值
    /// @param list
    /// @param xvalue
    /// @param yvalue
    /// @param bmax
    void MinMaxValue(const QList<CoordinateXY> &list, double &xvalue, double &yvalue, bool bmax);
    /// @brief 获取图形转换相关信息
    /// @param maxMath 数学最大值
    /// @param minMath 数学最小值
    /// @param screenpix 屏幕的宽度或者高度
    /// @param unitstr 单位
    /// @return
    GraphDataInfo getGraphDataInfo(const double maxMath, const double &minMath, const int &screenpix,
                                   const QString &unitstr);
    bool isEqualO(const double &value);

    /// @brief 画垂直x轴网格线
    /// @param painter
    /// @param lineNo
    void DrawGridX(QPainter *painter, const int lineNo);
    /// @brief 画垂直y轴网格线
    /// @param painter
    /// @param lineNo
    void DrawGridY(QPainter *painter, const int lineNo);
    /// @brief 画xy曲线
    /// @param painter
    void DrawXYPoints(QPainter *painter);
    /// @brief 画极点
    /// @param painter
    void DrawPole(QPainter *painter);
    /// @brief 画单位
    /// @param painter
    void DrawUnit(QPainter *painter);

private:
    GraphDataInfo m_xAxisInfo;    // x轴信息
    GraphDataInfo m_yAxisInfo;    // y轴信息
    QList<CoordinateXY> m_xyList; // x点列表实际坐标
    CoordinateXY m_pole;          // 极点坐标
    bool m_drawPole;
};

#endif
#include "GraphWidget.h"
#include <QFontMetrics>
#include <QPainterPath>
#include <QtMath>
static const int xpadding = 40; // xy轴屏幕距离窗口的内边距
static const int ypadding = 40; // xy轴屏幕距离窗口的内边距
static const int widgetWidth = 300 + 2 * xpadding; // 宽度
static const int widgetHeight = 240 + 2 * ypadding; // 高度
static const QColor TEXTCOLOR_NORMAL = QColor("#252d3f"); // 文字颜色
GraphWidget::GraphWidget(QWidget *parent)
: QWidget(parent),
m_xAxisInfo(GraphDataInfo()),
m_yAxisInfo(GraphDataInfo()),
m_xyList(QList<CoordinateXY>()),
m_pole(0, 0),
m_drawPole(false)
{
this->setFixedSize(widgetWidth, widgetHeight);
QList<CoordinateXY> list;
for (int x = 0; x < 100; ++x) {
list.append(CoordinateXY(x * 0.1, 1.5 * 0.01 * x * x));
}
setXYDoubleData(list, "x轴(嘻嘻)", "y轴(哈哈)", CoordinateXY(6, 1.5 * 36));
setDrawPole(true);
}
GraphWidget::~GraphWidget() { }
void GraphWidget::setXYDoubleData(const QList<CoordinateXY> &xyList, const QString &xUnit, const QString &yUnit,
const CoordinateXY &polexy)
{
this->setFixedSize(widgetWidth, widgetHeight);
double minX = 0.0;
double maxX = 0.0;
double minY = 0.0;
double maxY = 0.0;
MinMaxValue(xyList, maxX, maxY, true);
MinMaxValue(xyList, minX, minY, false);
m_xAxisInfo = getGraphDataInfo(maxX, minX, (this->width() - 2 * xpadding), xUnit);
m_yAxisInfo = getGraphDataInfo(maxY, minY, (this->height() - 2 * ypadding), yUnit);
m_xyList = xyList;
m_pole = polexy;
update();
}
void GraphWidget::setDrawPole(bool draw)
{
m_drawPole = draw;
}
void GraphWidget::paintEvent(QPaintEvent *event)
{
if (isEqualO(m_xAxisInfo.range()) && isEqualO(m_yAxisInfo.range()) || m_xyList.size() <= 0) {
QWidget::paintEvent(event);
return;
}
QPainter *painter = new QPainter(this);
for (int n = 0; n <= m_xAxisInfo.space; ++n) {
DrawGridX(painter, n);
}
for (int k = 0; k <= m_yAxisInfo.space; ++k) {
DrawGridY(painter, k);
}
DrawXYPoints(painter);
DrawPole(painter);
DrawUnit(painter);
}
const QPointF GraphWidget::mathMaptoQTPoint(const CoordinateXY &mathxy)
{
return screenPointMaptoQTPoint(mathMaptoscreenPoint(mathxy));
}
const QPointF GraphWidget::screenPointMaptoQTPoint(const QPointF &scPoint)
{
return QPointF(scPoint.x() + xpadding, height() - ypadding - scPoint.y());
}
const QPointF GraphWidget::mathMaptoscreenPoint(const CoordinateXY &mathxy)
{
return QPointF(qRound64((mathxy.x - m_xAxisInfo.min) * m_xAxisInfo.k),
qRound64((mathxy.y - m_yAxisInfo.min) * m_yAxisInfo.k));
}
void GraphWidget::MinMaxValue(const QList<CoordinateXY> &list, double &xvalue, double &yvalue, bool bmax)
{
xvalue = 0.0;
yvalue = 0.0;
for (CoordinateXY dvlue : list) {
if (bmax) {
if (xvalue < dvlue.x) {
xvalue = dvlue.x;
}
if (yvalue < dvlue.y) {
yvalue = dvlue.y;
}
} else {
if (xvalue > dvlue.x) {
xvalue = dvlue.x;
}
if (yvalue > dvlue.y) {
yvalue = dvlue.y;
}
}
}
}
GraphDataInfo GraphWidget::getGraphDataInfo(const double maxMath, const double &minMath, const int &screenpix,
const QString &unitstr)
{
GraphDataInfo graphInfo;
double mathRange = maxMath - minMath;
// 倍数,放大或缩小
double multiple = 1.0;
if (mathRange > 10.0) {
while (mathRange > 10.0) {
multiple = multiple / 10.0;
mathRange = mathRange / 10.0;
}
} else if (mathRange < 1.0 && mathRange > 0) {
while (mathRange < 1.0) {
multiple = multiple * 10.0;
mathRange = mathRange * 10.0;
}
} else if (isEqualO(mathRange)) {
graphInfo.min = qFloor(minMath);
graphInfo.max = graphInfo.min + multiple * 1;
return graphInfo;
}
graphInfo.space = qCeil(mathRange);
double range = graphInfo.space / multiple;
graphInfo.min = qFloor(minMath);
graphInfo.max = range - graphInfo.min;
graphInfo.k = screenpix / range;
if (graphInfo.space < 5) {
graphInfo.space = graphInfo.space * 2;
}
graphInfo.unit = unitstr;
return graphInfo;
}
bool GraphWidget::isEqualO(const double &value)
{
if ((value < 0.0 && value > -1e-16) || (value > 0.0 && value < 1e-16)) {
return true;
}
return false;
}
void GraphWidget::DrawGridX(QPainter *painter, const int lineNo)
{
if (painter == nullptr || m_xAxisInfo.space == 0) {
return;
}
painter->setPen(QPen(TEXTCOLOR_NORMAL, 1));
painter->setFont(QFont("Arial", 8));
int xPixel = ((this->width() - 2 * xpadding) * lineNo / m_xAxisInfo.space);
// 刻度线上两点
QPointF xGridPoint(xPixel, 0);
QPointF xGridTopPoint(xPixel, (this->height() - 2 * ypadding));
// 屏幕坐标转换成窗口坐标
QPointF xGridPointQt = screenPointMaptoQTPoint(xGridPoint);
QPointF xGridTopPointQt = screenPointMaptoQTPoint(xGridTopPoint);
// 绘制刻度线
painter->drawLine(xGridPointQt, xGridTopPointQt);
// 写上刻度
QPointF textPoint = xGridPoint + QPointF(-5, -ypadding / 3);
QPointF textPointQt = screenPointMaptoQTPoint(textPoint);
painter->drawText(textPointQt, QString("%1").arg(m_xAxisInfo.range() / m_xAxisInfo.space * lineNo));
}
void GraphWidget::DrawGridY(QPainter *painter, const int lineNo)
{
if (painter == nullptr || m_yAxisInfo.space == 0) {
return;
}
painter->setPen(QPen(TEXTCOLOR_NORMAL, 1));
painter->setFont(QFont("Arial", 8));
int yPixel = (this->height() - 2 * ypadding) * lineNo / m_yAxisInfo.space;
// 刻度线上两点
QPointF yGridPoint(0, yPixel);
QPointF yGridRightPoint((this->width() - 2 * xpadding), yPixel);
// 屏幕坐标转换成窗口坐标
QPointF yGridPointQt = screenPointMaptoQTPoint(yGridPoint);
QPointF yGridRightPointQt = screenPointMaptoQTPoint(yGridRightPoint);
// 绘制刻度线
painter->drawLine(yGridPointQt, yGridRightPointQt);
// 写上刻度
QPointF textPoint = yGridPoint + QPointF(-xpadding / 2, -5);
QPointF textPointQt = screenPointMaptoQTPoint(textPoint);
painter->drawText(textPointQt, QString("%1").arg(m_yAxisInfo.range() / m_yAxisInfo.space * lineNo));
}
void GraphWidget::DrawXYPoints(QPainter *painter)
{
if (painter == nullptr) {
return;
}
if (m_xyList.size() <= 0) {
return;
}
painter->setRenderHint(QPainter::Antialiasing, true);
painter->setPen(QPen(Qt::blue, 2));
QPainterPath path(mathMaptoQTPoint(m_xyList[0]));
for (int i = 0; i < m_xyList.size() - 1; ++i) {
QPointF startPoint(mathMaptoQTPoint(m_xyList[i]));
QPointF endPoint(mathMaptoQTPoint(m_xyList[i + 1]));
path.quadTo(startPoint, (startPoint + endPoint) * 0.5);
}
path.lineTo(mathMaptoQTPoint(m_xyList.last()));
painter->drawPath(path);
}
void GraphWidget::DrawPole(QPainter *painter)
{
if (painter == nullptr || !m_drawPole) {
return;
}
painter->setPen(QPen(Qt::red, 1));
QPointF poleQt = mathMaptoQTPoint(m_pole);
painter->drawEllipse(poleQt, 4, 4);
painter->setPen(QPen(TEXTCOLOR_NORMAL, 1));
painter->setFont(QFont("Arial", 10));
painter->drawText(poleQt + QPointF(-10, -10),
QString("(X:%1,Y:%2)").arg(QString::number(m_pole.x)).arg(QString::number(m_pole.y)));
}
void GraphWidget::DrawUnit(QPainter *painter)
{
if (painter == nullptr) {
return;
}
painter->setPen(QPen(TEXTCOLOR_NORMAL, 1));
painter->setFont(QFont("Arial", 10));
int xwidth = painter->fontMetrics().width(m_xAxisInfo.unit);
int ywidth = painter->fontMetrics().width(m_yAxisInfo.unit);
painter->drawText(QPointF((width() - xwidth) / 2, height() - ypadding / 3), m_xAxisInfo.unit);
painter->translate(xpadding / 3, (height() + ywidth) / 2); // 第1步:变换旋转中心到所绘制文字左下角
painter->rotate(-90); // 第2步: 旋转一定角度
painter->drawText(0, 0, m_yAxisInfo.unit); // 第3步: 绘制文字
painter->resetMatrix(); // 第4步: 恢复坐标旋转
}
三、效果图
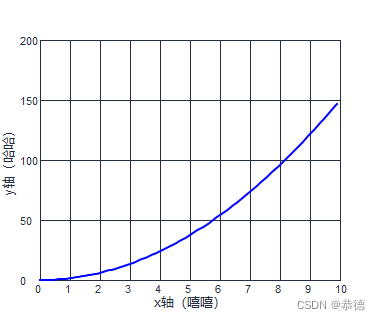
下图不带极点。如果不想要xy轴的说明,可以传空字符。
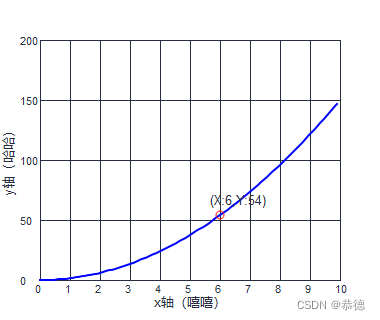
下图带极点(极点目前只支持自己算好传进来)
原创码子不易,喜欢的话就点个赞吧~
转载请注明出处,谢谢~


 2289
2289


 被折叠的 条评论
为什么被折叠?
被折叠的 条评论
为什么被折叠?
 到【灌水乐园】发言


