


一、常用配置项
配置项都在option中
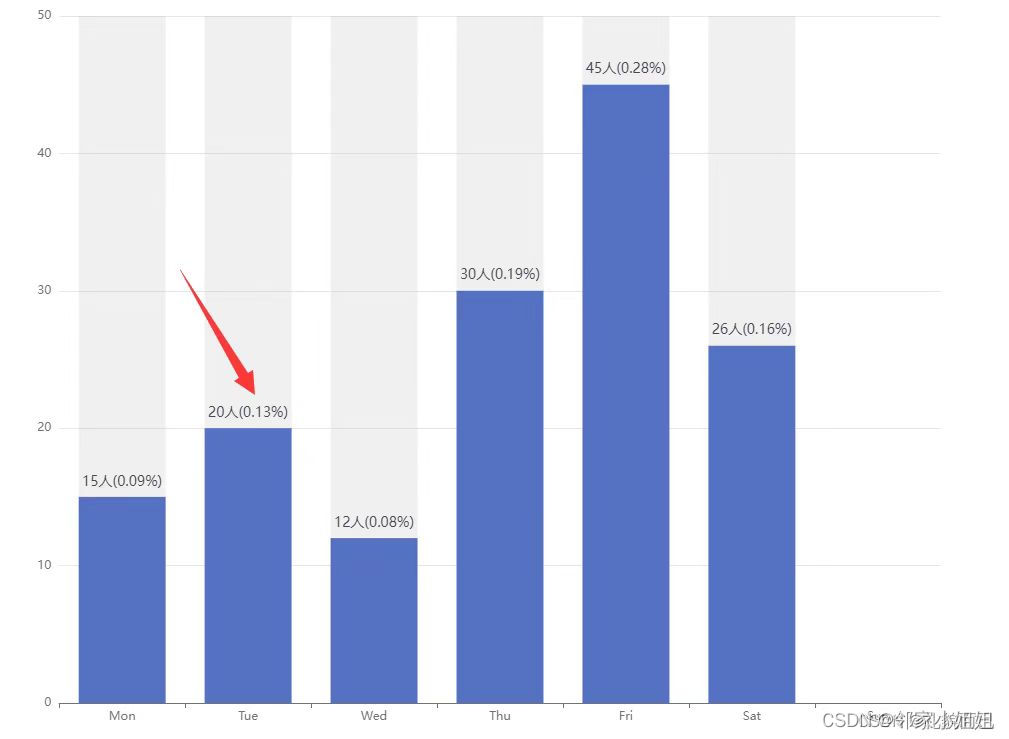
柱子顶部显示具体数据
操作series 中 itemstyle 的 lable 属性,在lable中自定义顶部展示数据的css样式和数据格式
全部代码:
const yData = [15, 20, 12, 30, 45, 26];
option = {
  xAxis: {
    type: 'category',
    data: ['Mon', 'Tue', 'Wed', 'Thu', 'Fri', 'Sat', 'Sun']
  },
  yAxis: {
    type: 'value'
  },
  series: [
    {
      data: yData,
      type: 'bar',
      showBackground: true,
      label: {
        show: true, // 开启显示
        position: 'top', // 在上方显示
        distance: 15, // 距离图形元素的距离。当 position 为字符描述值(如 'top'、'insideRight')时候有效
        verticalAlign: 'middle',
        textStyle: {
          color: '#424656', // 顶部数据的颜色
          fontSize: 14     // 顶部数据的字体大小
        },
        formatter: function (params) {
          // dataIndex是当前柱状图的索引
          let num = yData[params.dataIndex] / 160;
          num = Math.round(num * 100) / 100; // 保留两位小数,不四舍五入
          return (
            yData[params.dataIndex] + '人' + '(' + num + '%' + ')' // 此处return的字符串可根据自身项目需求自定义
          );
        }
      }
    }
  ]
};
柱子的颜色 -纯色和渐变
操作series 中 itemstyle 的 color 属性,即可改变柱状图的颜色
 最低0.47元/天 解锁文章


 1万+
1万+


 被折叠的 条评论
为什么被折叠?
被折叠的 条评论
为什么被折叠?
 到【灌水乐园】发言


