


从概率论和统计学角度看,Weibull Distribution是连续性的概率分布,其概率密度为:

其中,x是随机变量,λ>0是比例参数(scale parameter),k>0是形状参数(shape parameter)。显然,它的累积分布函数是扩展的指数分布函数,而且,Weibull distribution与很多分布都有关系。如,当k=1,它是指数分布;k=2且时,是Rayleigh distribution(瑞利分布)
library(gcookbook) # For the data set
library(tidyverse)
#基础绘图
# 这里的h没有大小顺序
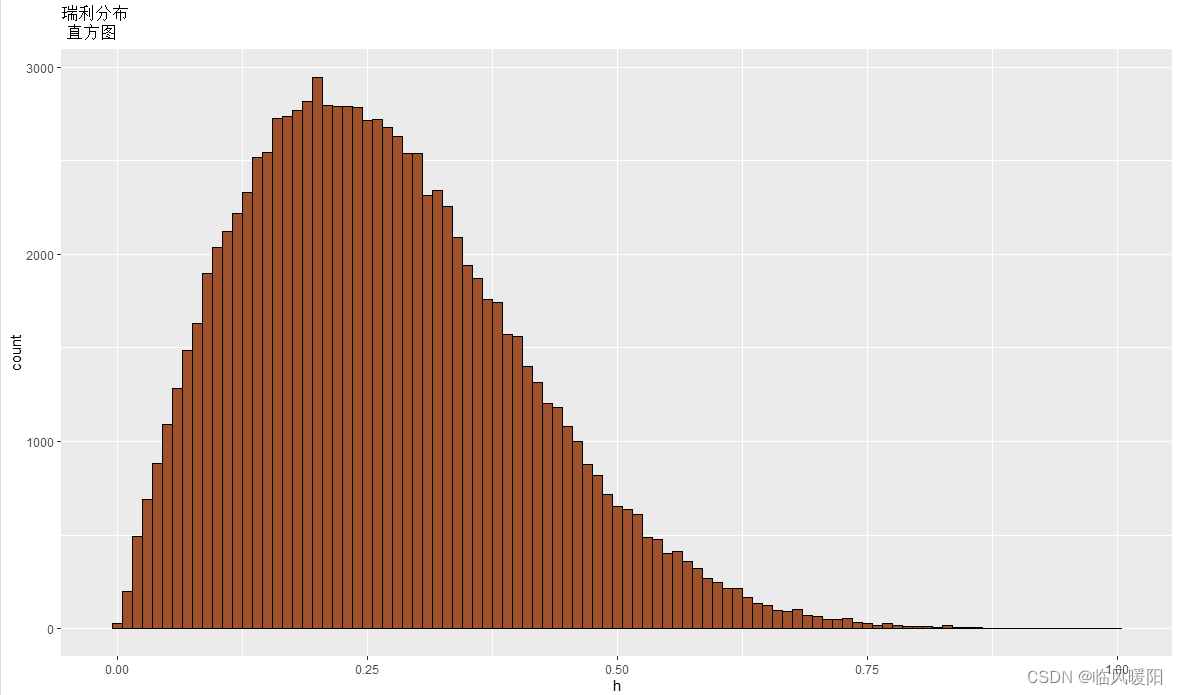
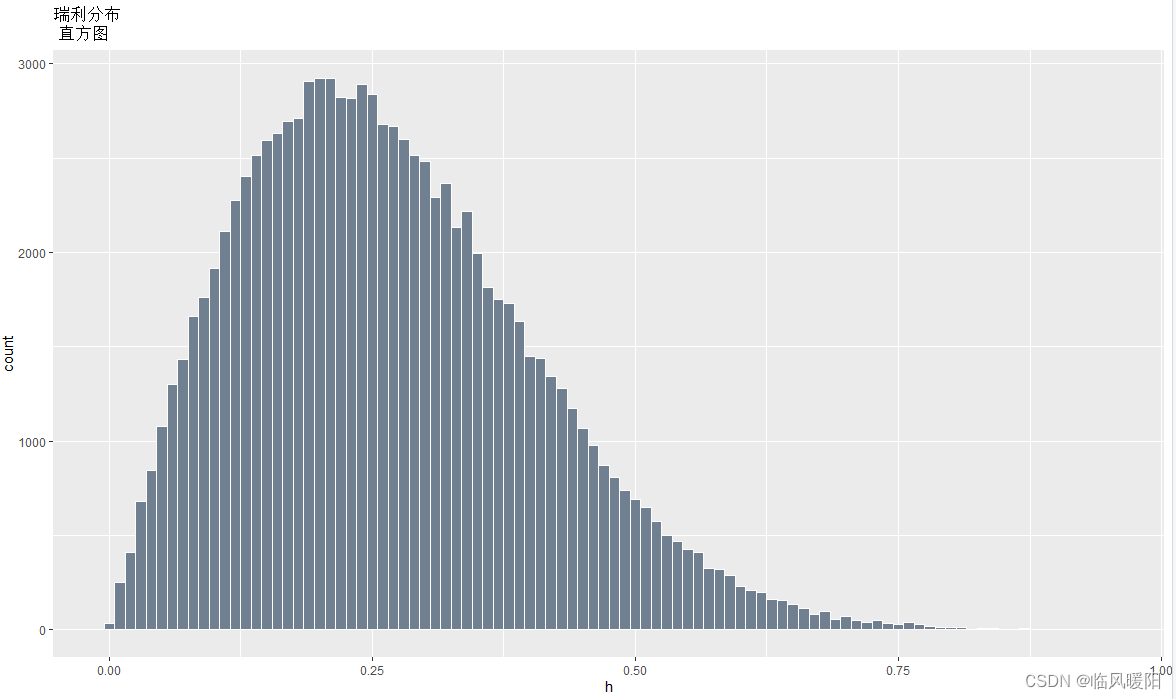
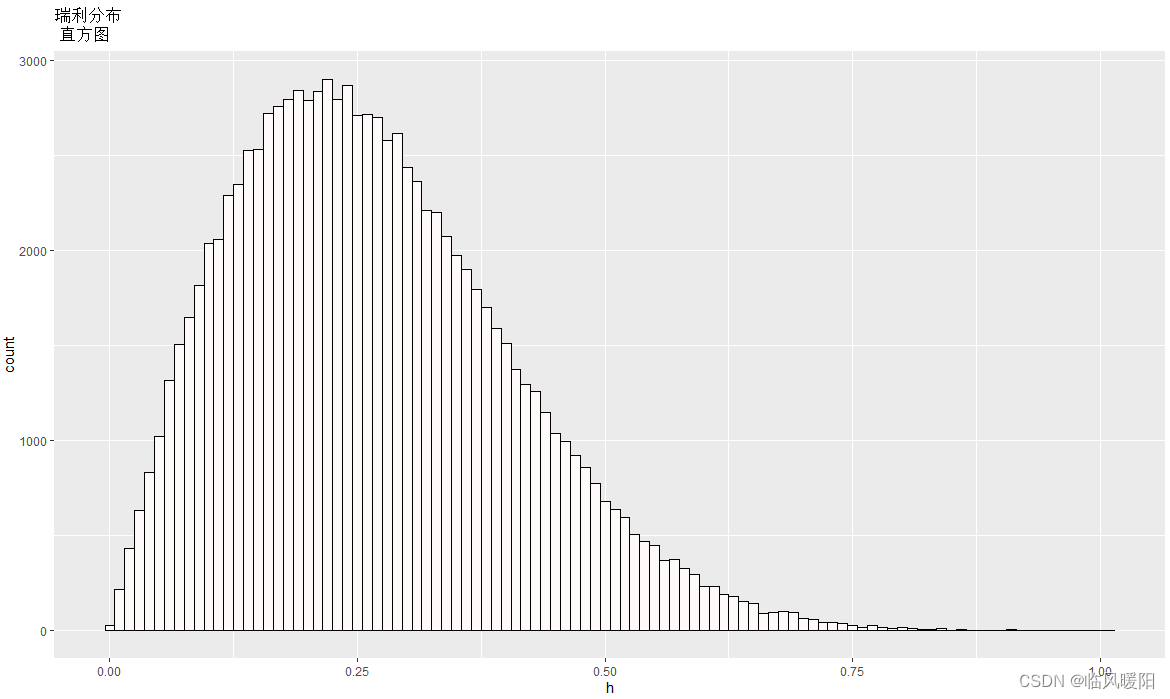
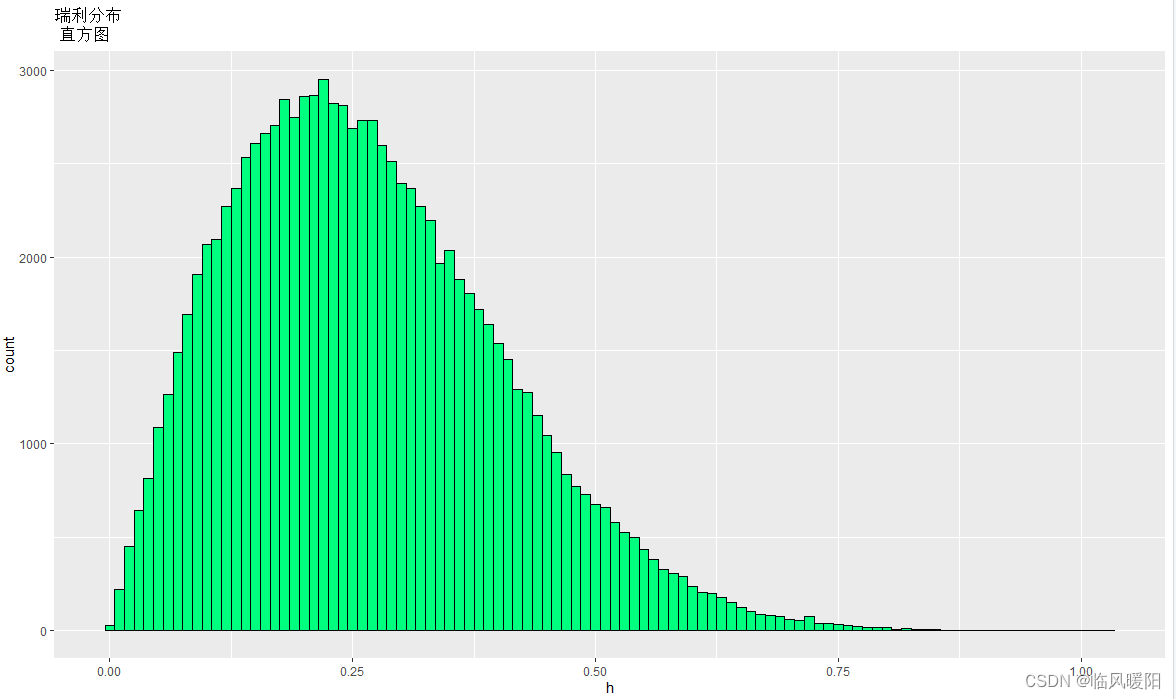
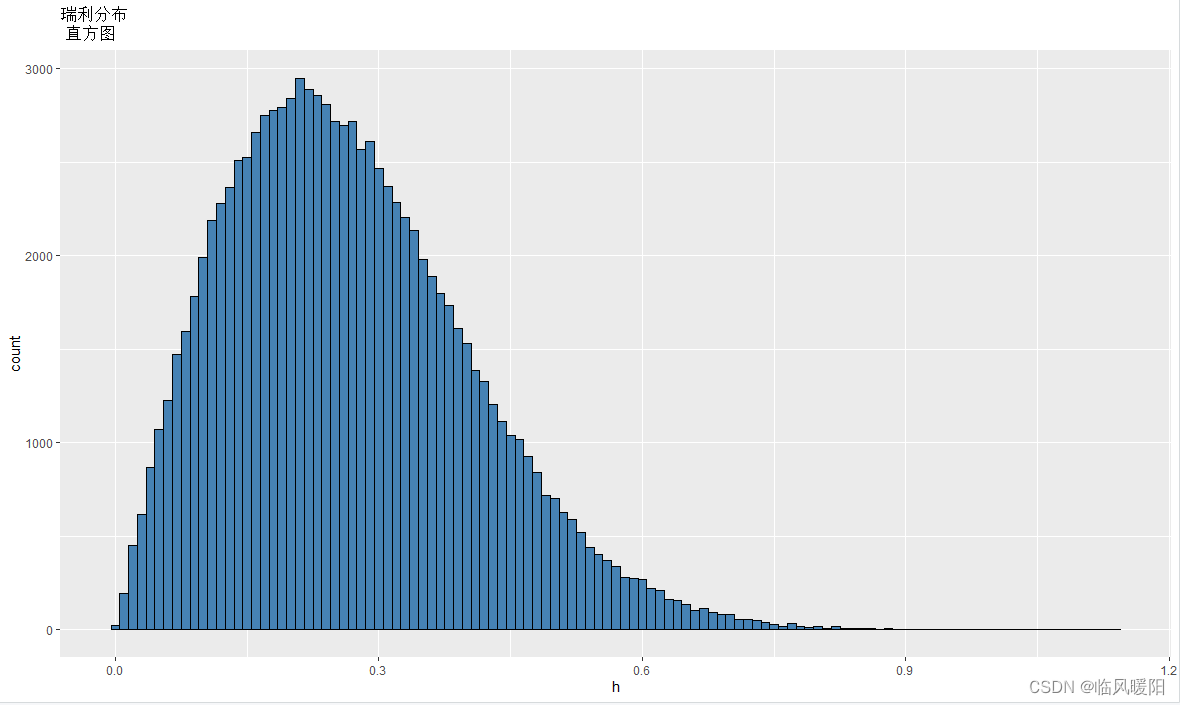
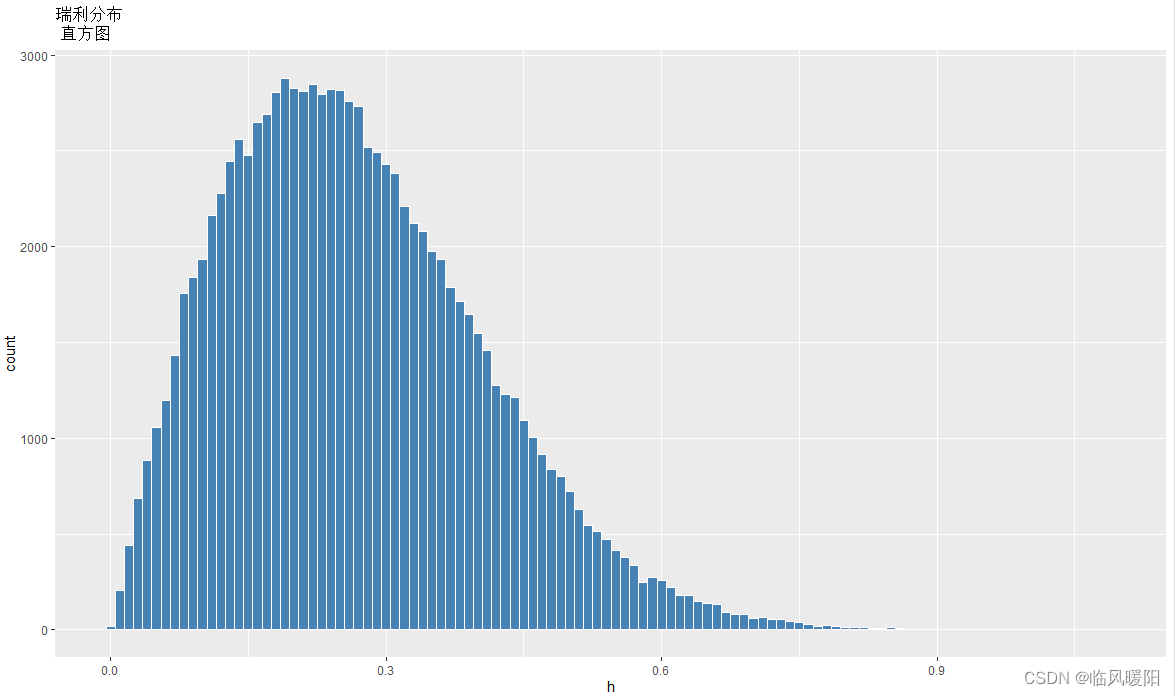
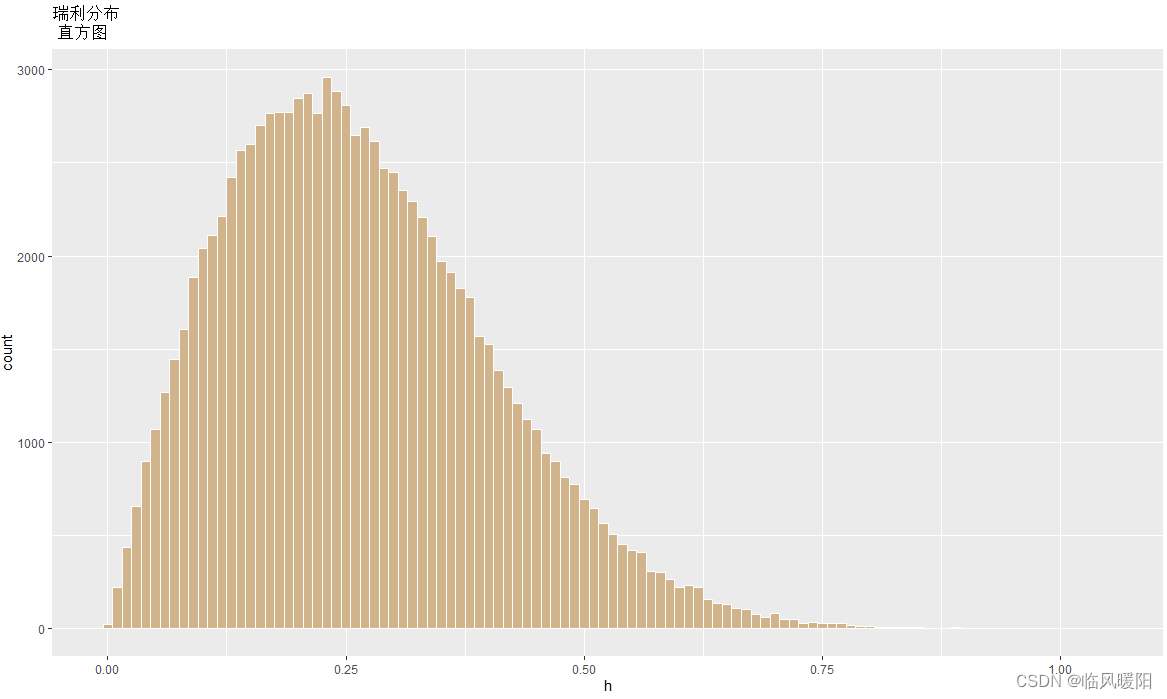
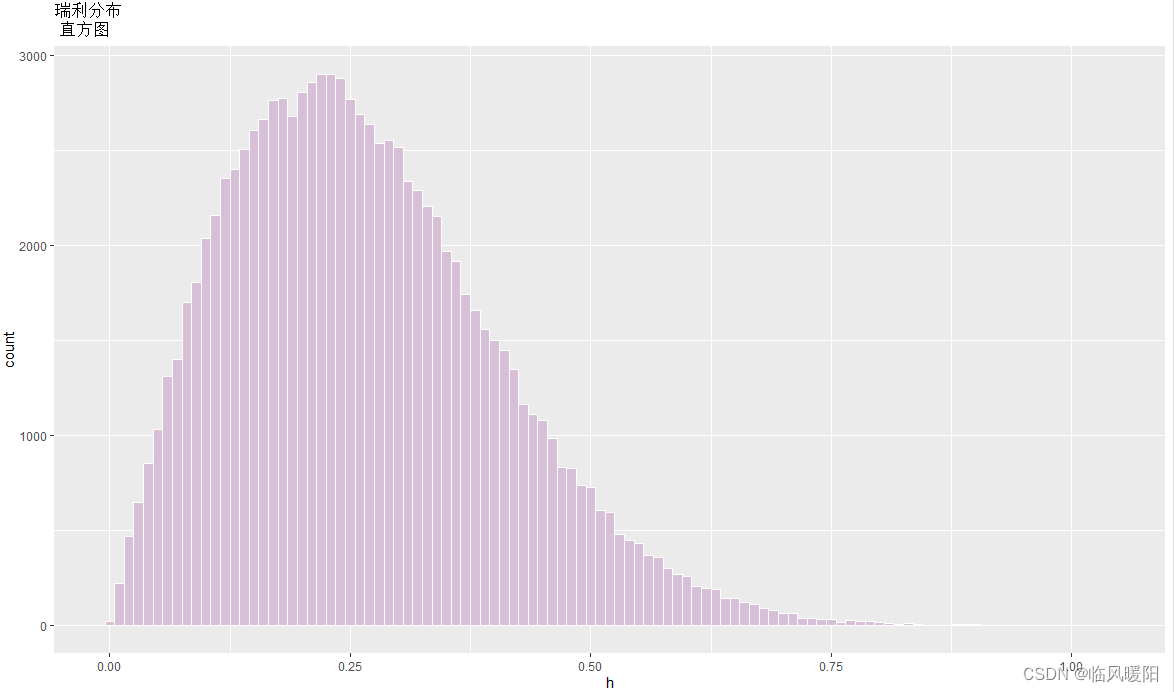
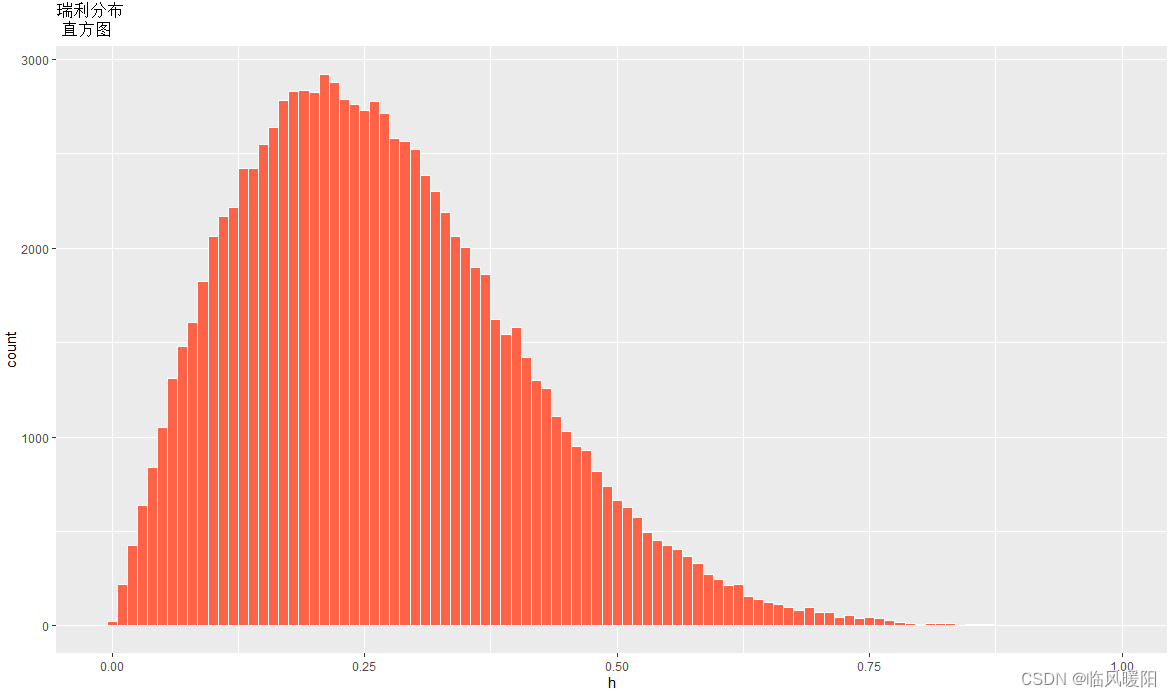
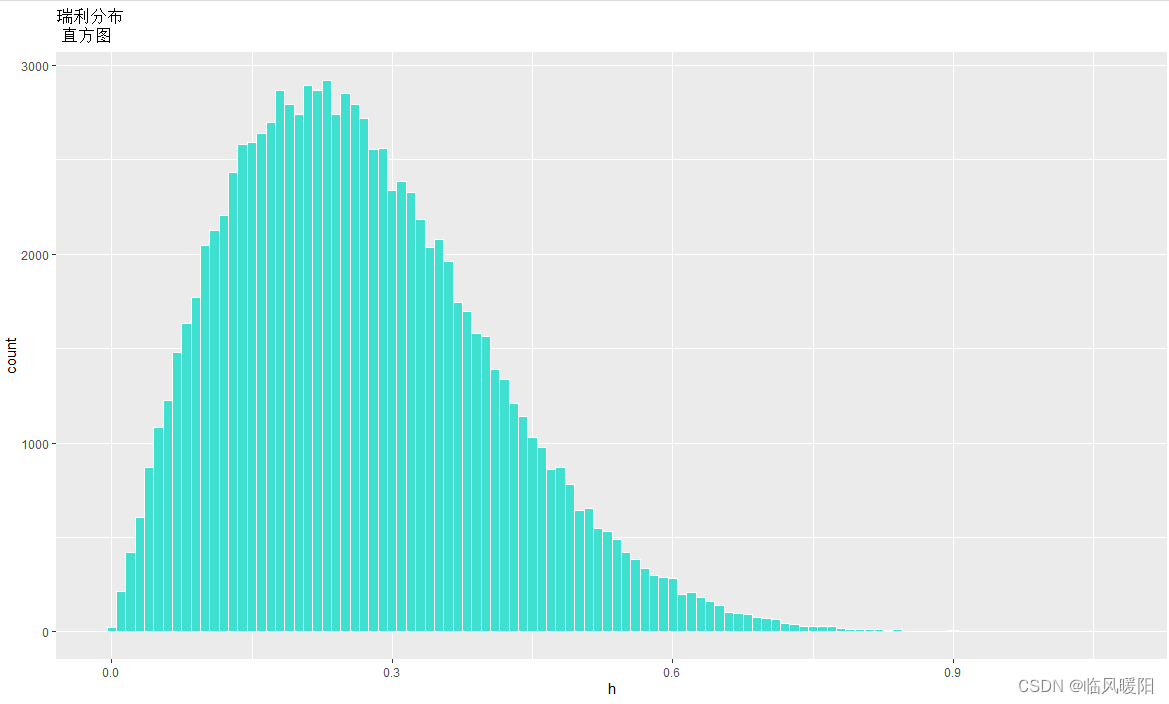
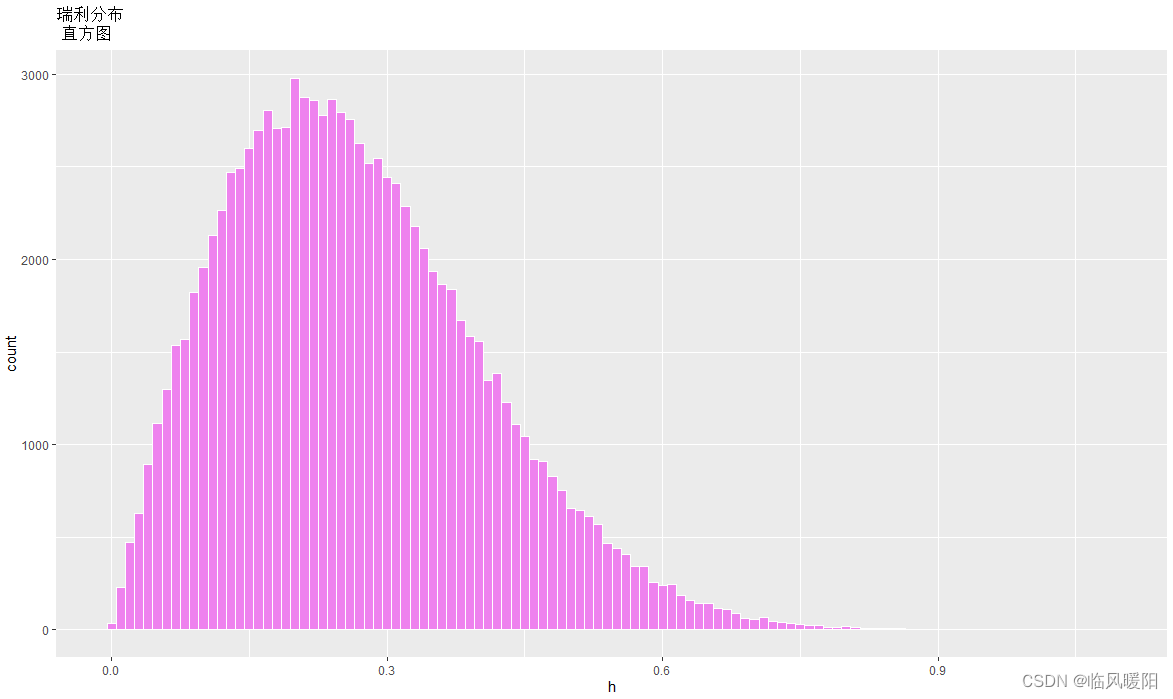
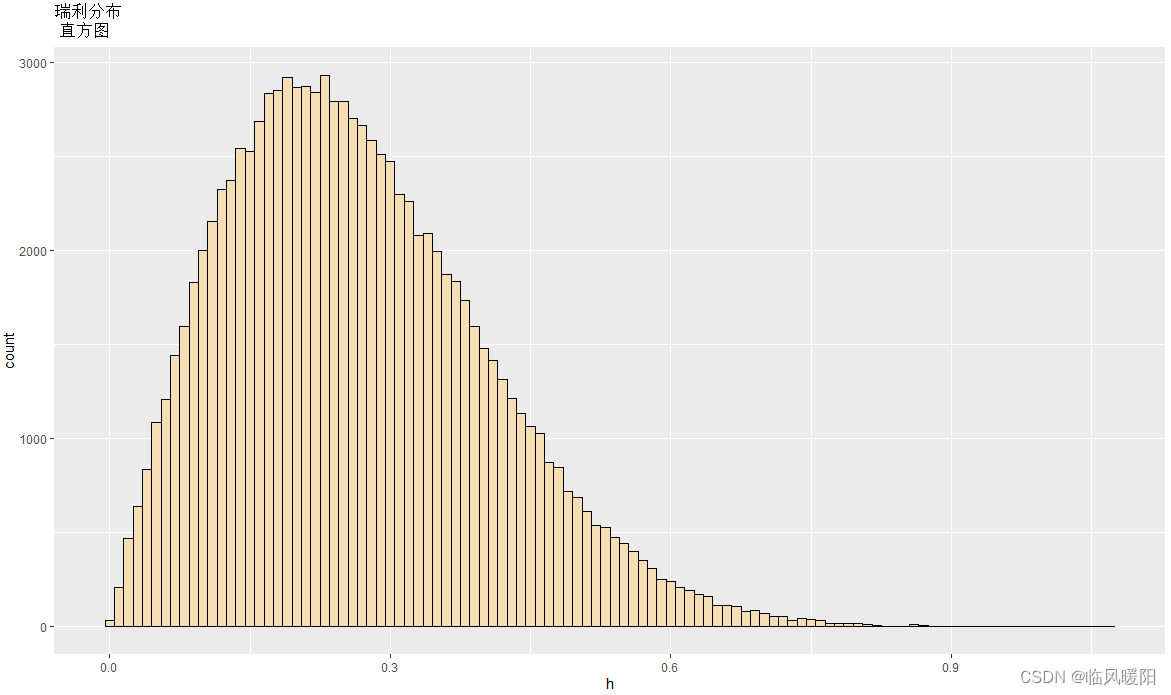
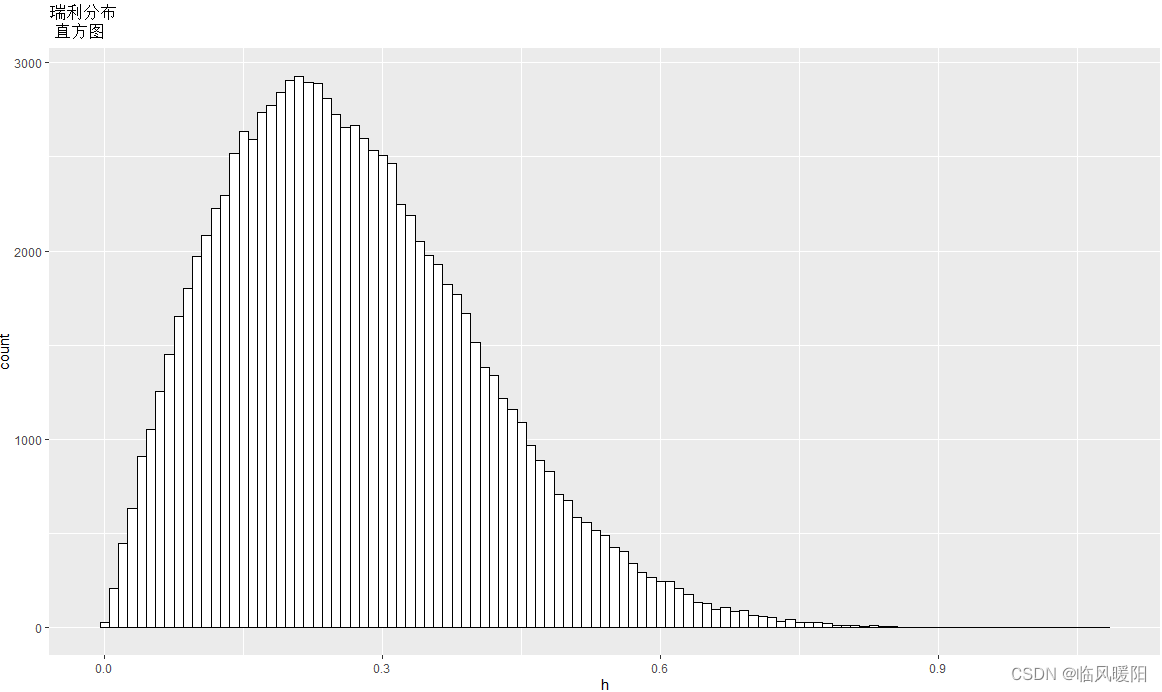
h <- rweibull(100000, shape=2, scale=0.3)
ggplot(NULL,aes(x=h))+
geom_histogram(binwidth = 0.01,fill="sienna",colour="black")+
ggtitle("瑞利分布 \n 直方图")
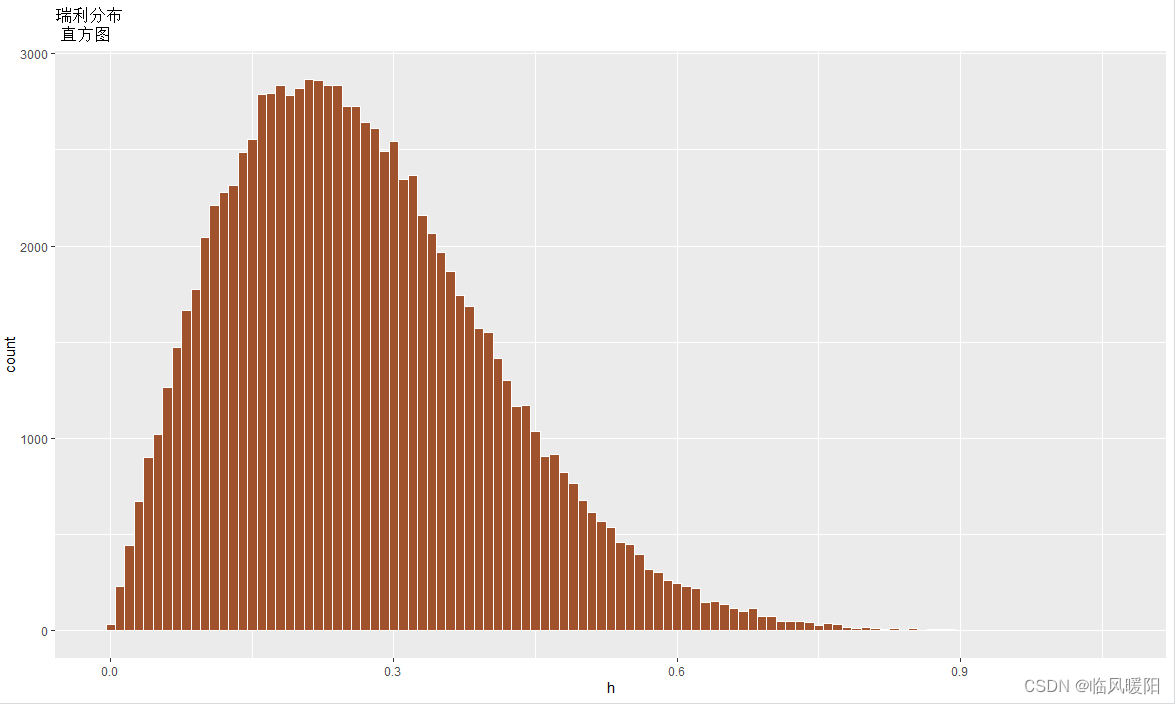
ggplot(NULL,aes(x=h))+
  geom_histogram(binwidth = 0.01,fill="sienna",colour="white")+
  ggtitle("瑞利分布 \n 直方图")
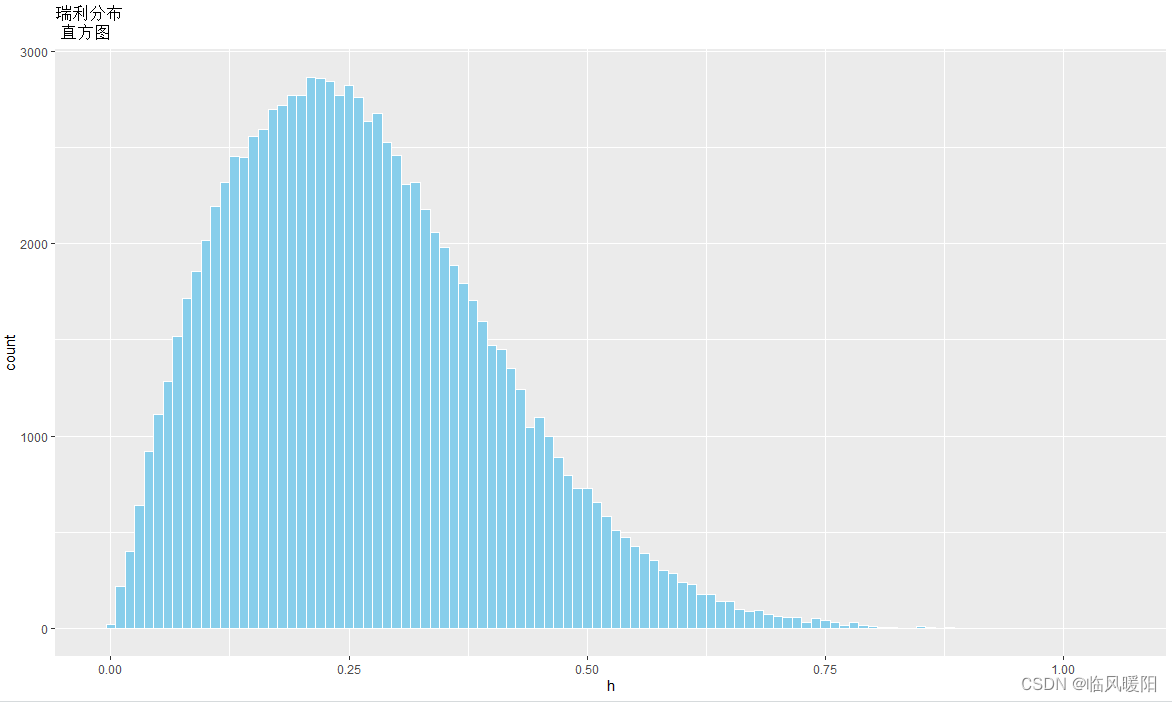
ggplot(NULL,aes(x=h))+
  geom_histogram(binwidth = 0.01,fill="skyblue",colour="white")+
  ggtitle("瑞利分布 \n 直方图")
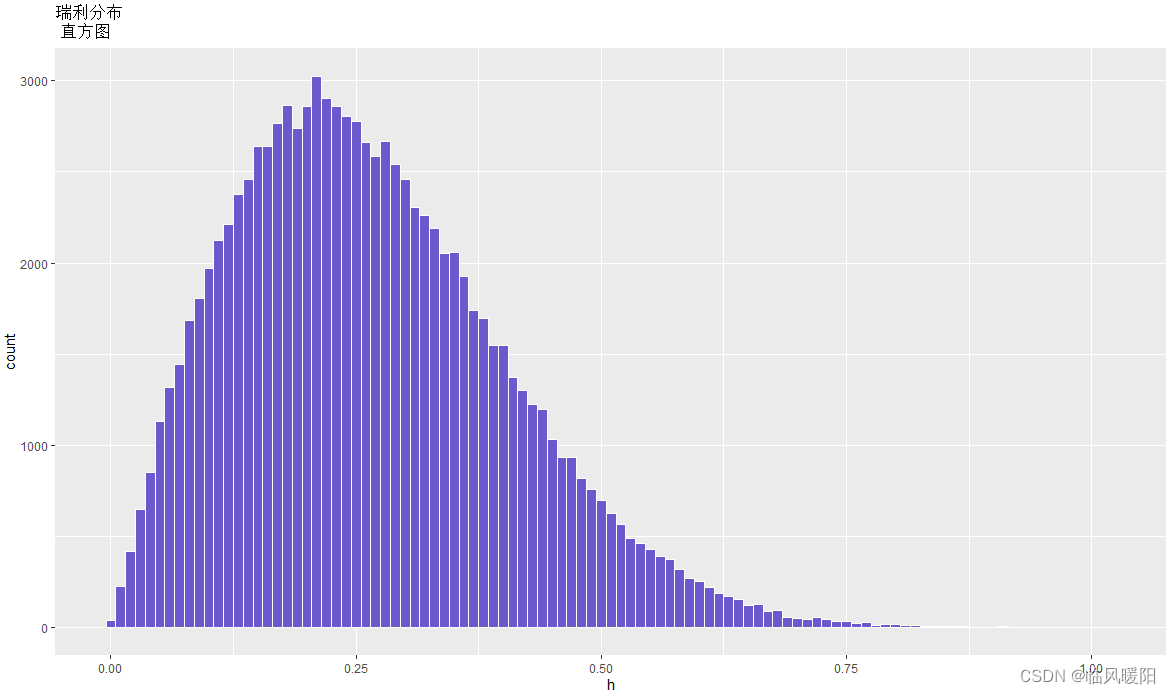
ggplot(NULL,aes(x=h))+
  geom_histogram(binwidth = 0.01,fill="slateblue",colour="white")+
  ggtitle("瑞利分布 \n 直方图")
ggplot(NULL,aes(x=h))+
  geom_histogram(binwidth = 0.01,fill="slategray",colour="white")+
  ggtitle("瑞利分布 \n 直方图")
ggplot(NULL,aes(x=h))+
  geom_histogram(binwidth = 0.01,fill="snow",colour="black")+
  ggtitle("瑞利分布 \n 直方图")
ggplot(NULL,aes(x=h))+
  geom_histogram(binwidth = 0.01,fill="springgreen",colour="black")+
  ggtitle("瑞利分布 \n 直方图")
ggplot(NULL,aes(x=h))+
  geom_histogram(binwidth = 0.01,fill="steelblue",colour="black")+
  ggtitle("瑞利分布 \n 直方图")
ggplot(NULL,aes(x=h))+
  geom_histogram(binwidth = 0.01,fill="steelblue",colour="white")+
  ggtitle("瑞利分布 \n 直方图")
ggplot(NULL,aes(x=h))+
  geom_histogram(binwidth = 0.01,fill="tan",colour="white")+
  ggtitle("瑞利分布 \n 直方图")
ggplot(NULL,aes(x=h))+
  geom_histogram(binwidth = 0.01,fill="thistle",colour="white")+
  ggtitle("瑞利分布 \n 直方图")
ggplot(NULL,aes(x=h))+
  geom_histogram(binwidth = 0.01,fill="tomato",colour="white")+
  ggtitle("瑞利分布 \n 直方图")
ggplot(NULL,aes(x=h))+
  geom_histogram(binwidth = 0.01,fill="turquoise",colour="white")+
  ggtitle("瑞利分布 \n 直方图")
ggplot(NULL,aes(x=h))+
  geom_histogram(binwidth = 0.01,fill="violet",colour="white")+
  ggtitle("瑞利分布 \n 直方图")
ggplot(NULL,aes(x=h))+
geom_histogram(binwidth = 0.01,fill=“wheat”,colour=“black”)+
ggtitle(“瑞利分布 \n 直方图”)
ggplot(NULL,aes(x=h))+
geom_histogram(binwidth = 0.01,fill=“white”,colour=“black”)+
ggtitle(“瑞利分布 \n 直方图”)
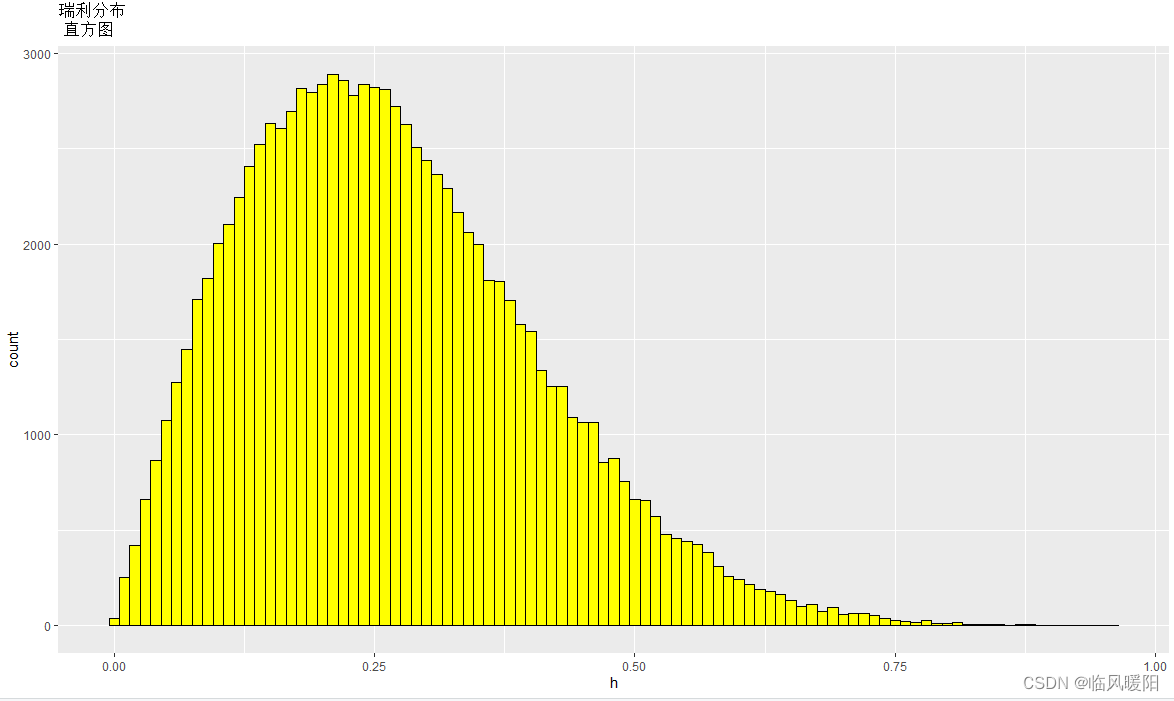
ggplot(NULL,aes(x=h))+
geom_histogram(binwidth = 0.01,fill=“yellow”,colour=“black”)+
ggtitle(“瑞利分布 \n 直方图”)
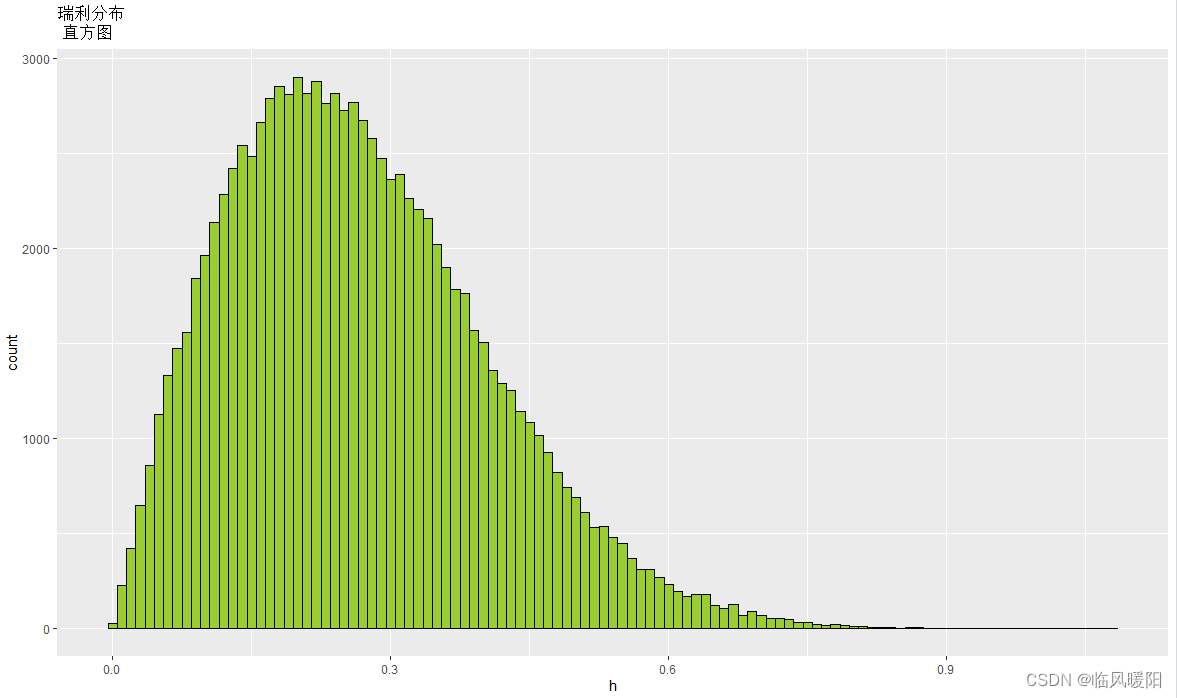
ggplot(NULL,aes(x=h))+
geom_histogram(binwidth = 0.01,fill=“yellowgreen”,colour=“black”)+
ggtitle(“瑞利分布 \n 直方图”)
参考文献:ggplot2绘制概率密度图
百度文库---颜色大全:含中英文对照及色值
温布尔分布介绍
开发环境:RStudio和微信截屏工具


 3841
3841


 被折叠的 条评论
为什么被折叠?
被折叠的 条评论
为什么被折叠?
 到【灌水乐园】发言


