


set.seed(1234)
n=10000
c1=matrix(rnorm(n,mean=0,sd=.5),ncol=2)
c2=matrix(rnorm(n,mean=3,sd=2),ncol=2)
mydata=rbind(c1,c2)
mydata=as.data.frame(mydata)
names(mydata)=c("x","y")
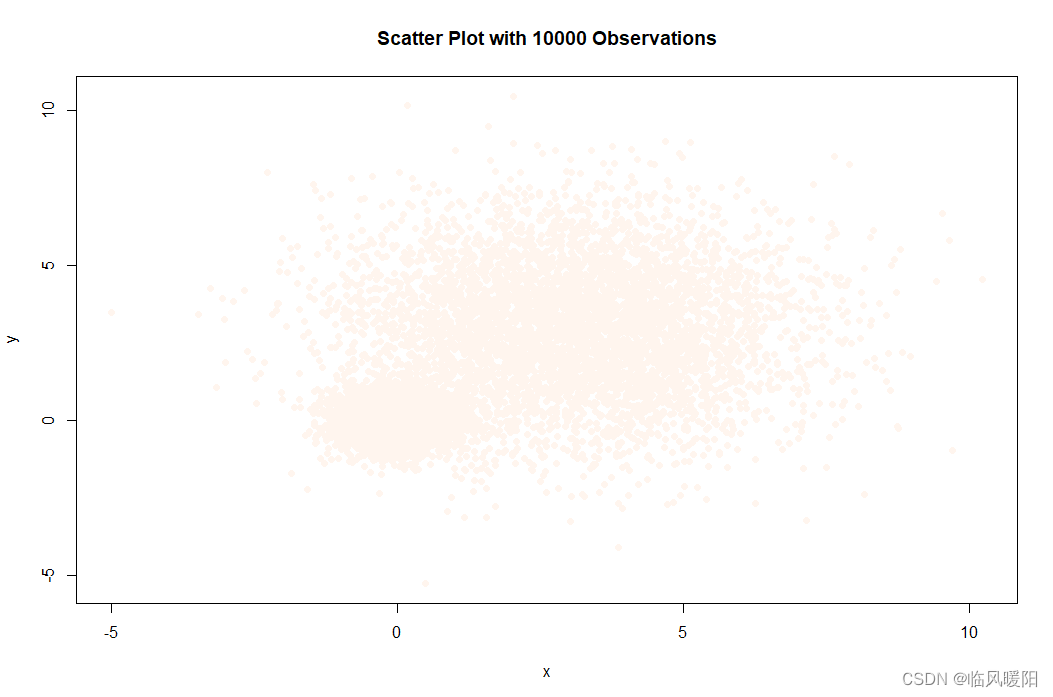
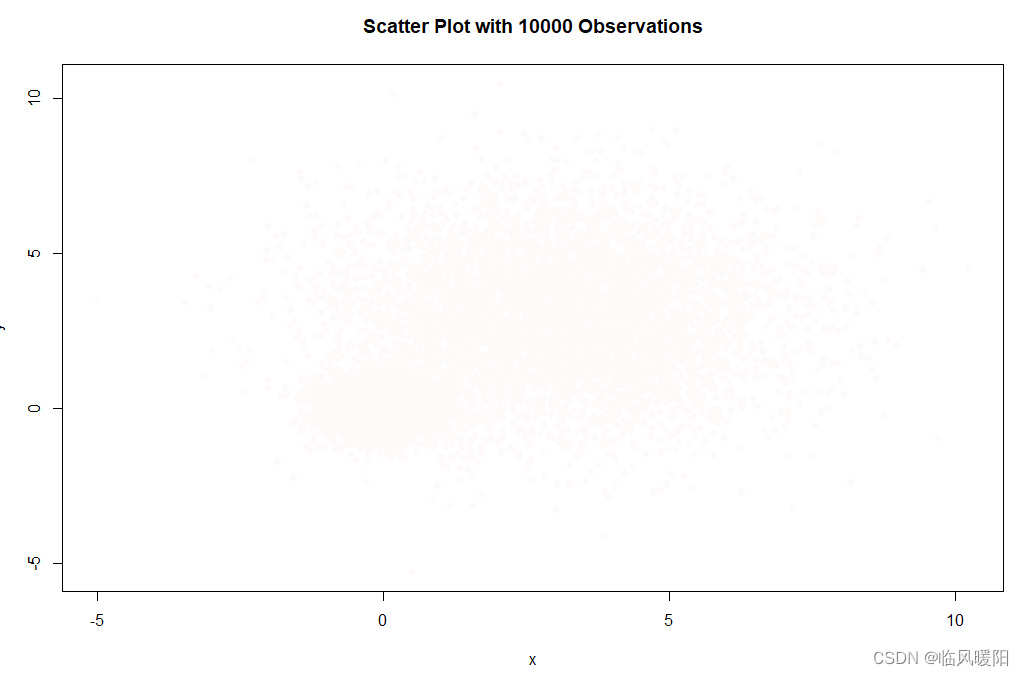
with(mydata,plot(x,y,pch=19,main="Scatter Plot with 10000 Observations",col = "seashell"))
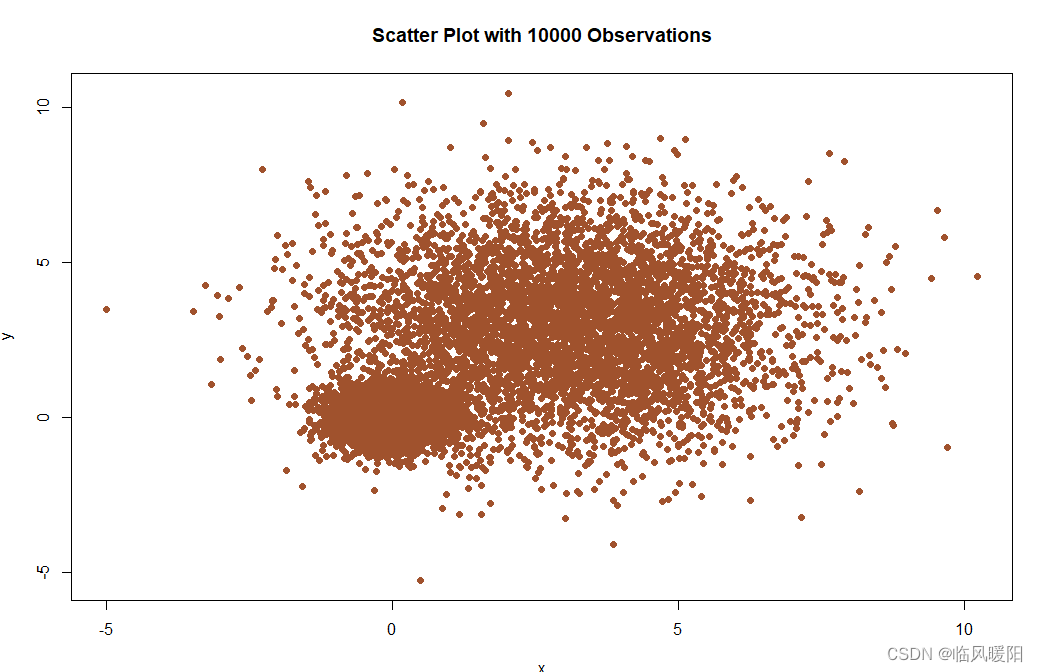
with(mydata,plot(x,y,pch=19,main="Scatter Plot with 10000 Observations",col = "sienna"))
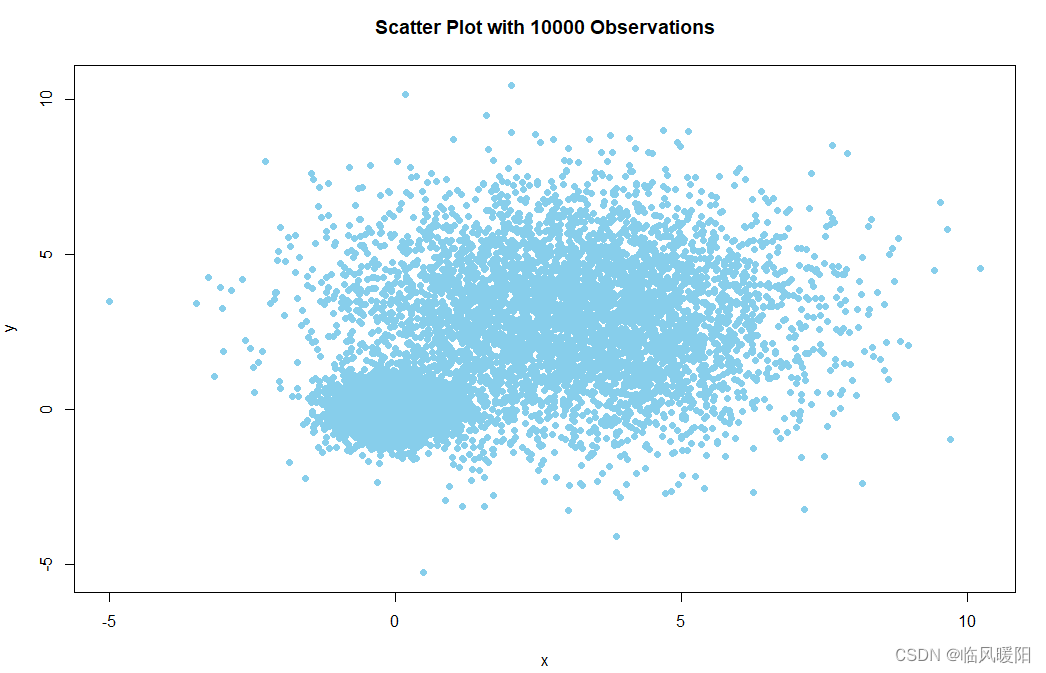
with(mydata,plot(x,y,pch=19,main="Scatter Plot with 10000 Observations",col = "skyblue"))
with(mydata,plot(x,y,pch=19,main="Scatter Plot with 10000 Observations",col = "slateblue"))

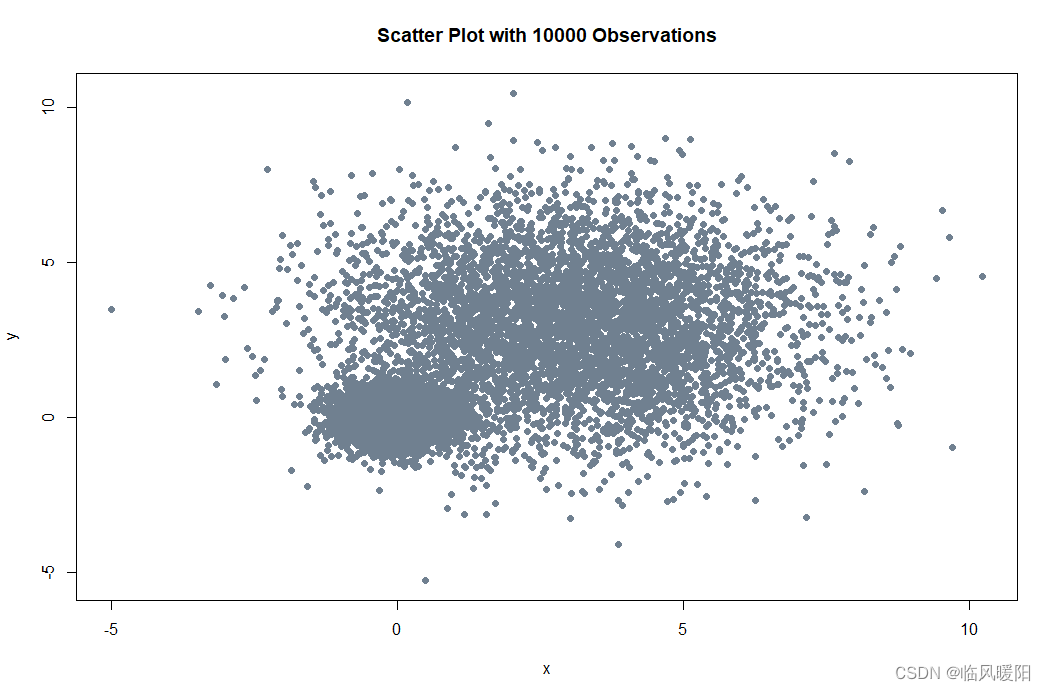
with(mydata,plot(x,y,pch=19,main="Scatter Plot with 10000 Observations",col = "slategray"))
with(mydata,plot(x,y,pch=19,main="Scatter Plot with 10000 Observations",col = "snow"))
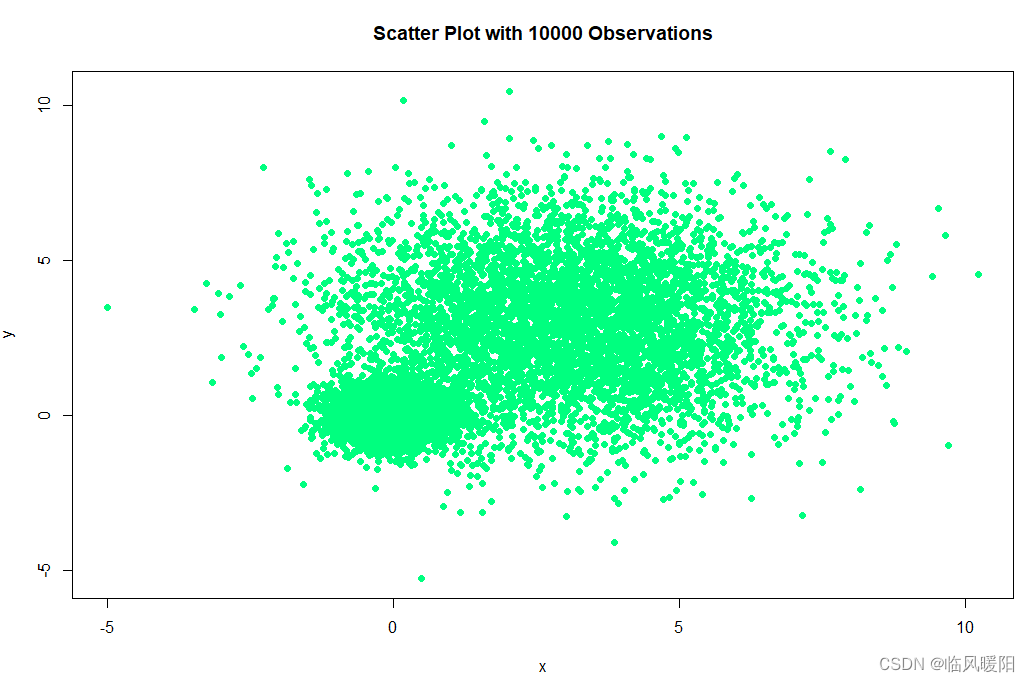
with(mydata,plot(x,y,pch=19,main="Scatter Plot with 10000 Observations",col = "springgreen"))
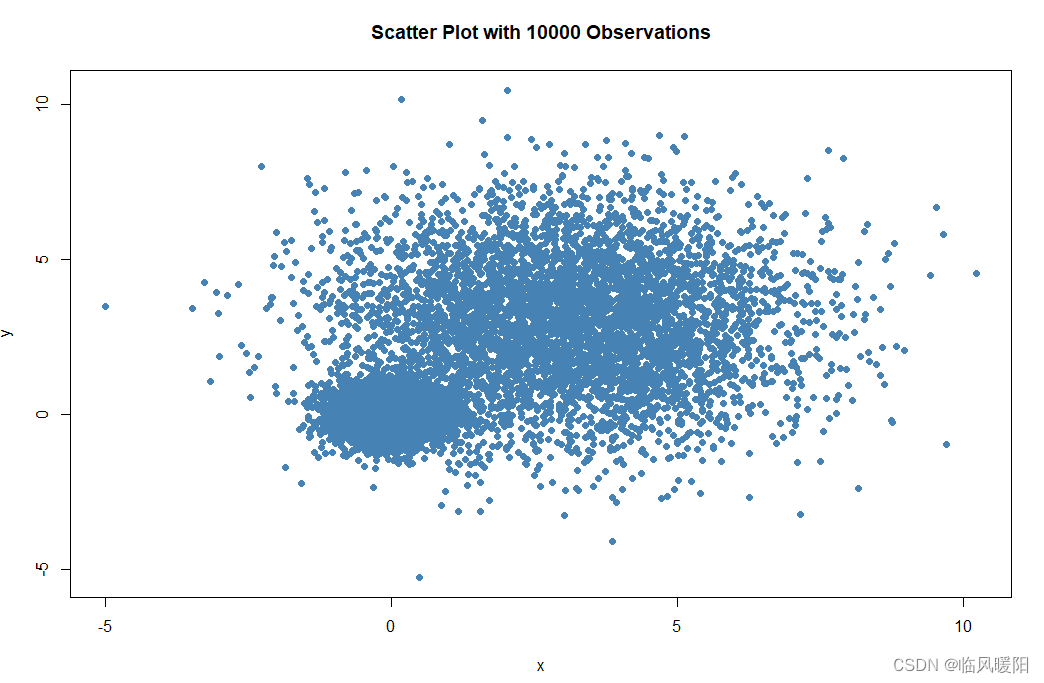
with(mydata,plot(x,y,pch=19,main="Scatter Plot with 10000 Observations",col = "steelblue"))
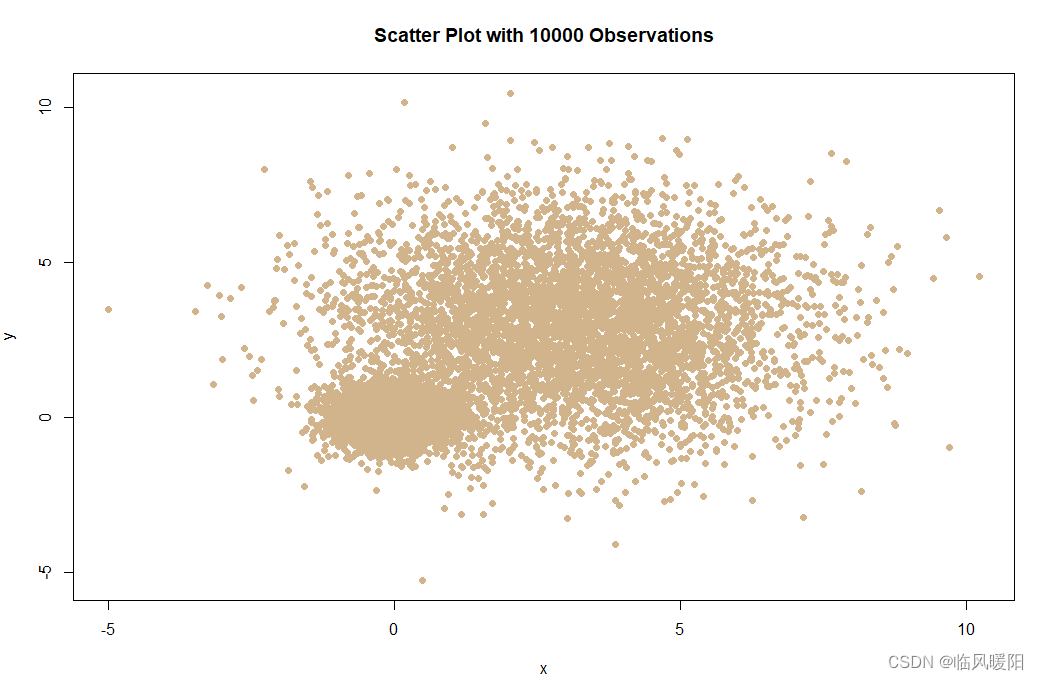
with(mydata,plot(x,y,pch=19,main="Scatter Plot with 10000 Observations",col = "tan"))
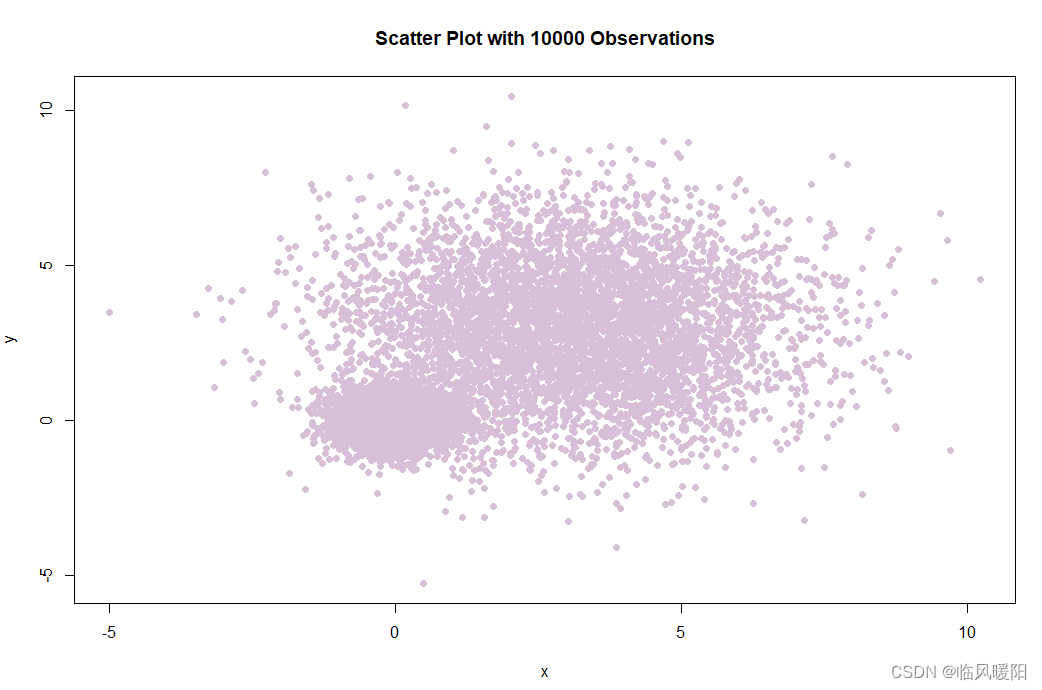
with(mydata,plot(x,y,pch=19,main="Scatter Plot with 10000 Observations",col = "thistle"))
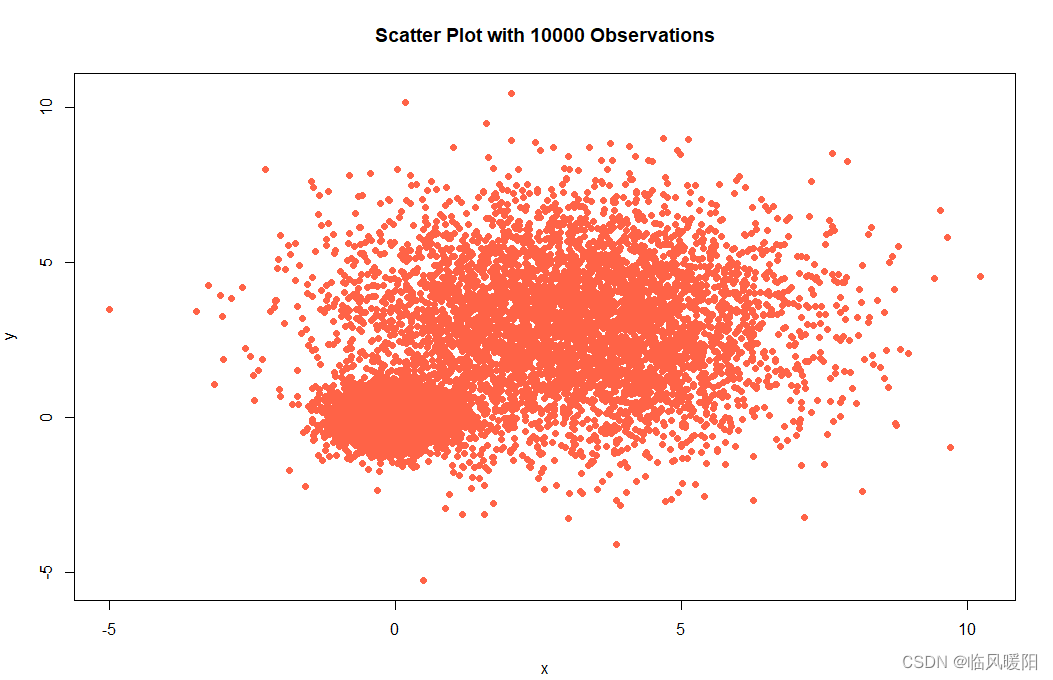
with(mydata,plot(x,y,pch=19,main="Scatter Plot with 10000 Observations",col = "tomato"))
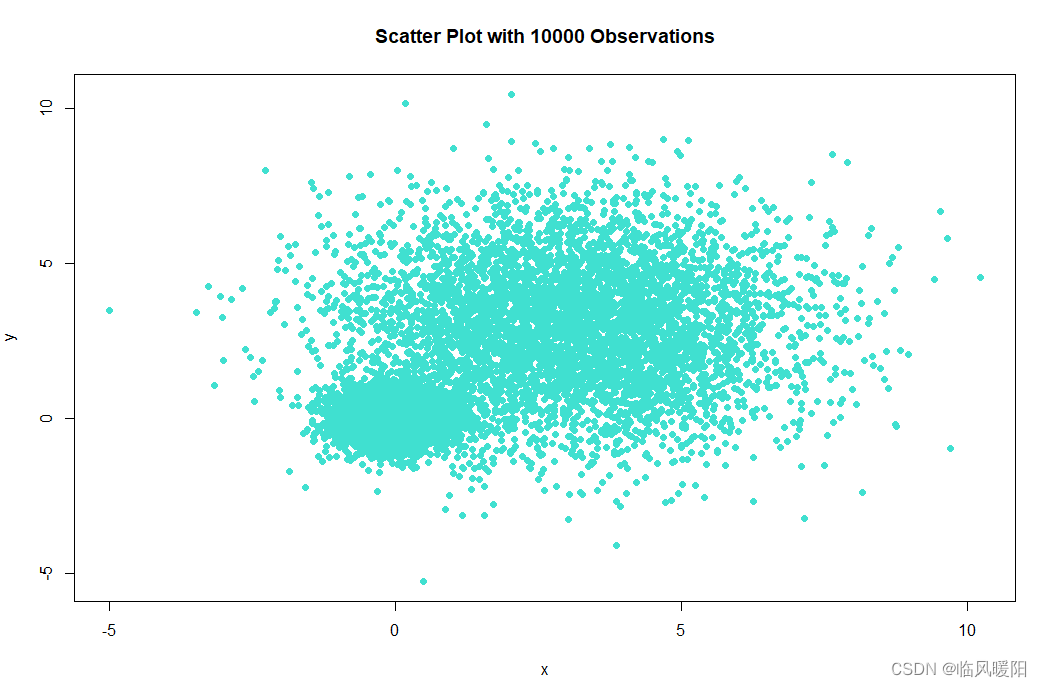
with(mydata,plot(x,y,pch=19,main="Scatter Plot with 10000 Observations",col = "turquoise"))
with(mydata,plot(x,y,pch=19,main="Scatter Plot with 10000 Observations",col = "violet"))

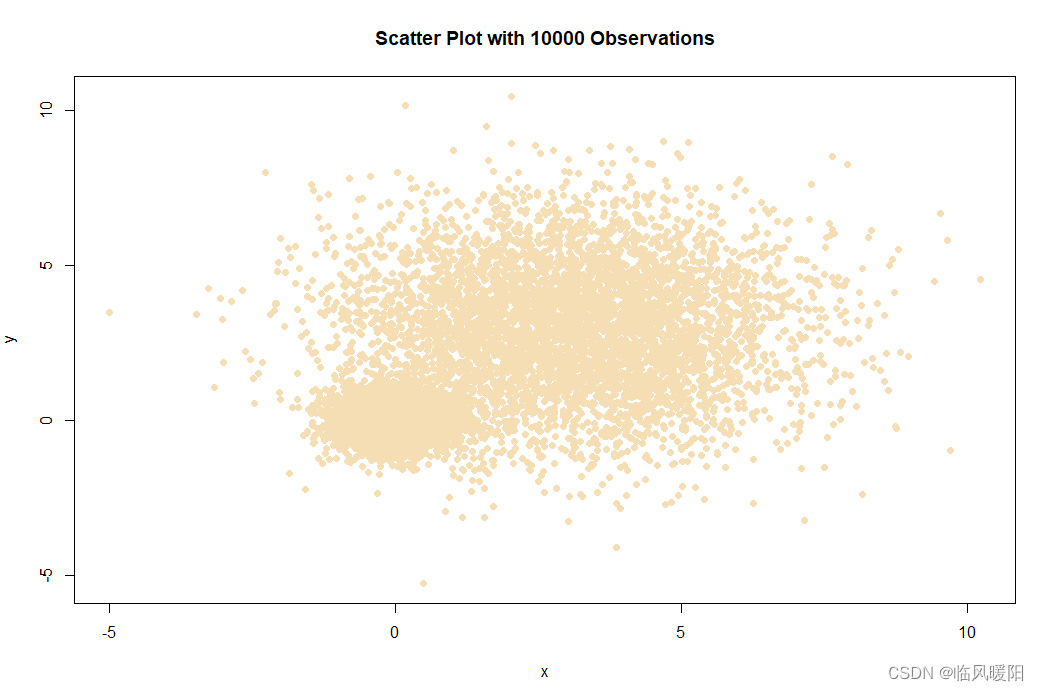
with(mydata,plot(x,y,pch=19,main="Scatter Plot with 10000 Observations",col = "wheat"))
with(mydata,plot(x,y,pch=19,main=“Scatter Plot with 10000 Observations”,col = “whitesmoke”))
with(mydata,plot(x,y,pch=19,main="Scatter Plot with 10000 Observations",col = "yellow"))
with(mydata,plot(x,y,pch=19,main="Scatter Plot with 10000 Observations",col = "yellowgreen"))

参考文献:
https://bbs.huaweicloud.com/blogs/382975
百度搜索:
R语言基本绘图-plot参数:标题,坐标轴和颜色
R语言绘制散点图和折线
百度文库—颜色大全:含中英文对照及色值
开发环境:RStudio 微信截屏工具


 530
530


 被折叠的 条评论
为什么被折叠?
被折叠的 条评论
为什么被折叠?
 到【灌水乐园】发言


