


Hystrix的降级与熔断测试
构建服务
为了测试Hystrix的降级与熔断功能,此处构建了Eureka Server注册中心服务、Eureka Client的生产者和消费者两个服务、Hystrix Dashboard服务监控平台,总共四个服务。
Eureka Server注册中心
这里可以参考我之前写的一篇文章:https://blog.csdn.net/m0_43420705/article/details/111763158
通过这篇教程即可构建出Eureka Server注册中心。
服务生产者
新建一个springboot项目为其添加控制层向外提供一个接口:
@RestController
@RequestMapping("/")
public class ProducerController {
    @GetMapping("/getinfo")
    public String getInfo() {
        try {
            Thread.sleep(5000);
        } catch (InterruptedException e) {
            e.printStackTrace();
        }
        return "方法正常执行";
    }
}
当访问此接口时会延迟5秒钟返回结果,以此来测试消费者端服务调用的超时然后降级或熔断的情况。
服务消费者
新建一个springboot项目为其添加控制层向外提供接口:
@RestController
@RequestMapping("/")
public class ConsumerController {

    @Autowired
    private RestTemplate restTemplate;

    @GetMapping("/get1")
    @HystrixCommand(
            //线程池标识
            threadPoolKey = "test1ThreadPool",

            //线程池属性配置
            threadPoolProperties = {
                    //线程核心数
                    @HystrixProperty(name = "coreSize", value = "3"),
                    //线程池队列大小
                    @HystrixProperty(name = "maxQueueSize", value = "100")
            },

            //设置test1方法对应的降级方法:testFallback1
            fallbackMethod = "testFallback1",

            commandProperties = {
                    //设置超时时间为1秒则改为调用降级方法
                    @HystrixProperty(name = "execution.isolation.thread.timeoutInMilliseconds", value = "1000"),
                    //失败时开启一个固定时间的的窗口 此处设置为10秒
                    @HystrixProperty(name = "metrics.rollingStats.timeInMilliseconds", value = "10000"),
                    //熔断跳闸所需的最小请求数 此处设置为4次
                    @HystrixProperty(name = "circuitBreaker.requestVolumeThreshold", value = "4"),
                    //失败次数所占请求的百分比 此处设置为50% 超过50%则熔断跳闸
                    @HystrixProperty(name = "circuitBreaker.errorThresholdPercentage", value = "50"),
                    //跳闸后会产生另一个活动窗口,每隔一段时间让一个请求去测试被跳闸的服务,若无问题则重置断路器,有问题则一直按固定时间间隔重复用一个请求去测试 此处时间间隔设置为5秒
                    @HystrixProperty(name = "circuitBreaker.sleepWindowInMilliseconds", value = "5000")
            }
    )
    public String test1() {
        return restTemplate.getForObject("http://eureka-client-producer/getinfo", String.class);
    }

    public String testFallback1() {
        return "降级方案1";
    }
}
这里添加了一个test1()接口和其对应的testFallback1()降级方法,通过在接口方法上添加@HystrixCommand注解表明该方法可进行熔断和服务降级,注解中的参数可实现细节的配置,具体所用到的每个参数所对应的功能都在上面代码注释中写出了。
Hystrix监控服务
再新建一个springboot项目,其pom.xml文件中所需依赖如下:
<dependency>
	<groupId>org.springframework.boot</groupId>
	<artifactId>spring-boot-starter-web</artifactId>
</dependency>
<dependency>
	<groupId>org.springframework.boot</groupId>
	<artifactId>spring-boot-starter-actuator</artifactId>
</dependency>
<dependency>
	<groupId>org.springframework.cloud</groupId>
	<artifactId>spring-cloud-starter-netflix-eureka-client</artifactId>
</dependency>
<dependency>
	<groupId>org.springframework.cloud</groupId>
	<artifactId>spring-cloud-starter-netflix-hystrix</artifactId>
</dependency>
<dependency>
	<groupId>org.springframework.cloud</groupId>
	<artifactId>spring-cloud-starter-netflix-hystrix-dashboard</artifactId>
</dependency>
在application.yml配置文件中添加如下配置:
spring:
  application:
    name: hystrix-dashboard-server
server:
  port: 8204
eureka:
  client:
    service-url.defaultZone: http://alee:123456@{Eureka注册中心IP}:{端口}/eureka/
    register-with-eureka: true
    fetch-registry: true
  instance:
    prefer-ip-address: true
    instance-id: ${spring.application.name}:${spring.cloud.client.ip-address}:${server.port}
hystrix:
  dashboard:
    proxy-stream-allow-list: "localhost"
最后在启动类上加上@EnableHystrixDashboard注解以使用Hystrix监控仪表盘。
测试
测试方案
这里使用Postman测试工具进行测试,然后通过观察Hystrix Dashboard仪表盘的变化判断测试是否成功。
预期目标
通过观察消费者服务的test1()接口的HystrixCommand配置可知,每次发送请求去调用该接口程序一定会超时,所以当最开始服务未熔断时在10秒钟之内发送4个请求后服务就会熔断,然后在每个5秒钟内连续发多个请求的话,第一个请求会显示超时,剩下的请求会显示短路。
开始测试
在Postman中新建一个请求:

在Collection Runner中选择该请求并发4次:

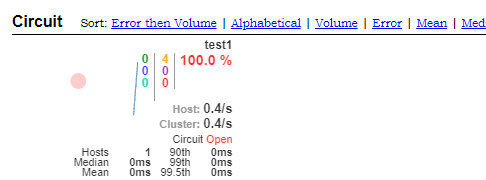
点击Run测试接口按钮可以看到执行第三个请求后服务并未熔断,在第四个请求完之后服务被熔断:

现在服务已熔断的情况下再次发送10个请求测试:
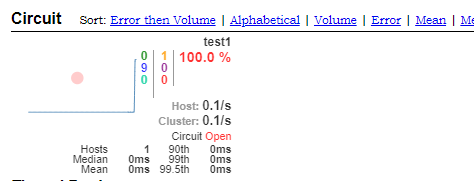
可以看到第一个请求结果是超时,后面9个是短路,因为熔断之后每隔5秒钟的第一个请求依然会去调用test1()接口,而这5秒钟里剩余的请求不会去调用test1()接口,而是直接调用降级方法,并且请求结果会显示短路。
测试完成。


 619
619


 被折叠的 条评论
为什么被折叠?
被折叠的 条评论
为什么被折叠?
 到【灌水乐园】发言


