


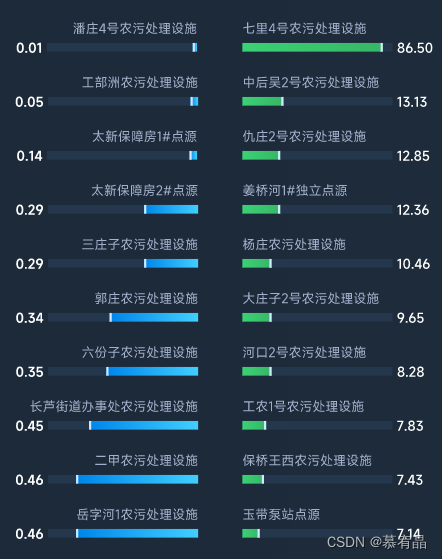
设计图样式
上代码 父组件
<bar-chart :option="energyOption"></bar-chart>
  initChart() {
      //上周能耗排行榜
      this.black_label = [
        "漫张农污处理设施",
        "邓庄农污处理设施",
        "王桥农污处理设施",
        "甲庄农污处理设施",
        "乔庄农污处理设施",
        "张门农污处理设施",
        "镇南河1#独立点源",
        "上张农污处理设施",
        "郭庄农污处理设施",
        "工部洲农污处理设施",
      ];
      this.red_label = [
        "白玉2农污处理设施",
        "护国农污处理设施",
        "新犁徐庄农污处理设施",
        "江圩1农污处理设施",
        "工农1农污处理设施",
        "滁河3农污处理设施",
        "高庄北农污处理设施",
        "大桥2号农污处理设施",
        "大桥1号农污处理设施",
        "姜桥河1#独立点源",
      ];
      this.black_Data = [
        "0.53",
        "0.52",
        "0.52",
        "0.50",
        "0.47",
        "0.41",
        "0.37",
        "0.30",
        "0.22",
        "0.05",
      ];
      this.red_Data = [
        "6.03",
        "6.51",
        "6.59",
        "7.06",
        "7.14",
        "7.56",
        "7.94",
        "7.95",
        "8.41",
        "9.90",
      ];
      let black_Data = this.black_Data;
      let red_Data = this.red_Data;
      let blackSalvProMax = this.processingData(this.black_Data);
      let redSalvProMax = this.processingData(this.red_Data);

      let option = {
        title: {
          left: "left",
          // text: "单位:度 / 吨",
          textStyle: {
            color: "#ccc",
            fontSize: 11,
          },
        },
        grid: [
          {
            left: "3%",
            right: "55%",
            containLabel: false,
            bottom: "3%",
            top: "4%",
          },
          {
            right: "7%",
            left: "55%",
            containLabel: false,
            bottom: "3%",
            top: "4%",
          },
        ],
        xAxis: [
          {
            type: "value",
            inverse: true,
            axisLine: {
              show: false,
            },
            axisTick: {
              show: false,
            },
            axisLabel: {
              show: false,
            },
            splitLine: {
              show: false,
            },
          },
          {
            gridIndex: 1,
            type: "value",
            axisLine: {
              show: false,
            },
            axisTick: {
              show: false,
            },
            axisLabel: {
              show: false,
            },
            splitLine: {
              show: false,
            },
          },
        ],
        yAxis: [
          {
            position: "right",
            axisLabel: {
              textStyle: {
                color: "#A3B0CC",
                fontSize: "12",
              },
              align: "right",
              padding: [0, 8, 0, 0],
              verticalAlign: "bottom",
              lineHeight: 36,
              formatter: function (value, index) {
                return value;
              },
            },
            axisLine: {
              show: false,
            },
            type: "category",
            inverse: false,
            axisTick: {
              show: false,
            },
            data: this.black_label,
          },
          {
            gridIndex: 1,
            position: "left",
            axisLabel: {
              textStyle: {
                color: "#A3B0CC",
                fontSize: "12",
                fontWeight: 1000,
              },
              align: "left",
              padding: [0, 0, 0, 8],
              verticalAlign: "bottom",
              lineHeight: 36,
              formatter: function (value, index) {
                return value;
              },
            },
            axisLine: {
              show: false,
            },
            type: "category",
            inverse: false,
            axisTick: {
              show: false,
            },
            data: this.red_label,
          },
        ],
        series: [
          {
            zlevel: 1,
            name: "红榜",
            type: "bar",
            barWidth: 16,
            label: {
              show: false,
              fontFamily: "Rubik-Medium",
              fontSize: 12,
              color: "#fff",
              position: "left",
              formatter: function (params) {
                return params.value;
              },
            },
            itemStyle: {
              color: {
                type: "linear",
                x: 0,
                y: 0,
                x2: 1,
                y2: 0,
                colorStops: [
                  {
                    offset: 0,
                    color: "#0087EB", // 0% 处的颜色
                  },
                  {
                    offset: 1,
                    color: "#41CFFF", // 100% 处的颜色
                  },
                ],
                global: false, // 缺省为 false
              },
            },
            data: this.black_Data,
          },
          //顶部的横杠代码
          {
            zlevel: 1,
            name: "红榜",
            type: "pictorialBar",
            symbol: "rect",
            symbolSize: [5, 16], //前者控制宽度 后者控制高度
            symbolOffset: [-5, 0],
            symbolPosition: "end",
            data: this.black_Data,
            itemStyle: {
              color: "#D0EBFF", //横线颜色
            },
          },
          //最大值
          {
            name: "红榜",
            type: "bar",
            barWidth: 16,
            barGap: "-100%",
            margin: "20",
            textStyle: {
              //图例文字的样式
              fontSize: 10,
              color: "#fff",
            },
            itemStyle: {
              normal: {
                color: "#05325F",
                fontSize: 10,
              },
            },
            label: {
              show: true,
              fontFamily: "Rubik-Medium",
              fontSize: 12,
              color: "#fff",
              position: "left",
              formatter: function (params) {
                return black_Data[params.dataIndex];
              },
            },
            data: blackSalvProMax,
          },
          {
            zlevel: 1,
            name: "黑榜",
            type: "bar",
            barWidth: 16,
            label: {
              show: false,
              fontFamily: "Rubik-Medium",
              fontSize: 12,
              color: "#fff",
              position: "right",
              formatter: function (params) {
                return params.value;
              },
            },
            xAxisIndex: 1,
            yAxisIndex: 1,
            itemStyle: {
              color: {
                type: "linear",
                x: 0,
                y: 0,
                x2: 1,
                y2: 0,
                colorStops: [
                  {
                    offset: 0,
                    color: "#3AD174", // 0% 处的颜色
                  },
                  {
                    offset: 1,
                    color: "#37B767", // 100% 处的颜色
                  },
                ],
                global: false, // 缺省为 false
              },
            },
            data: this.red_Data,
          },
          //顶部的横杠代码
          {
            zlevel: 1,
            name: "黑榜",
            type: "pictorialBar",
            xAxisIndex: 1,
            yAxisIndex: 1,
            symbol: "rect",
            symbolSize: [5, 16], //前者控制宽度 后者控制高度
            symbolOffset: [5, 0],
            symbolPosition: "end",
            data: this.red_Data,
            itemStyle: {
              color: "#D0EBFF", //横线颜色
            },
          },
          {
            name: "黑榜",
            type: "bar",
            barWidth: 16,
            xAxisIndex: 1,
            yAxisIndex: 1,
            barGap: "-100%",
            margin: "20",
            data: redSalvProMax,
            textStyle: {
              //图例文字的样式
              fontSize: 10,
              color: "#fff",
            },
            itemStyle: {
              normal: {
                color: "#05325F",
                fontSize: 10,
              },
            },
            label: {
              show: true,
              fontFamily: "Rubik-Medium",
              fontSize: 12,
              color: "#fff",
              position: "right",
              formatter: function (params) {
                return red_Data[params.dataIndex];
              },
            },
          },
        ],
      };
      this.energyOption = option;
    },
    //获取最大值
    processingData(arr) {
      console.log("arr", arr);
      if (arr.length) {
        var floatArray = arr.map(function (item) {
          return parseFloat(item);
        });
        // 获取最大值
        var maxValue = Math.max(...floatArray);
        var salvProMax = []; //背景按最大值
        for (let i = 0; i < arr.length; i++) {
          salvProMax.push(maxValue);
        }
        console.log("salvProMax", salvProMax);
        return salvProMax;
      }
    }
子组件:
<template>
  <div :class="className" :style="{height:height,width:width}" />
</template>

<script>
import echarts from "echarts";
require("echarts/theme/macarons"); // echarts theme
import resize from "./mixins/resize";

const animationDuration = 6000;

export default {
  mixins: [resize],
  props: {
    className: {
      type: String,
      default: "chart",
    },
    width: {
      type: String,
      default: "100%",
    },
    height: {
      type: String,
      default: "100%",
    },
    option: {
      type: Object,
    },
  },
  data() {
    return {
      chart: null,
    };
  },
  watch: {
    option: {
      deep: true,
      handler(val) {
        this.setOptions(val);
      },
    },
  },
  mounted() {
    this.$nextTick(() => {
      this.initChart();
    });
  },
  beforeDestroy() {
    if (!this.chart) {
      return;
    }
    this.chart.dispose();
    this.chart = null;
  },
  methods: {
    initChart() {
      // this.chart = echarts.init(this.$el, "macarons");
      this.chart = echarts.init(this.$el, );
      this.chart.setOption(this.option);
    },
    setOptions(option) {
      this.chart.setOption(option);
    }
  },
};
</script>
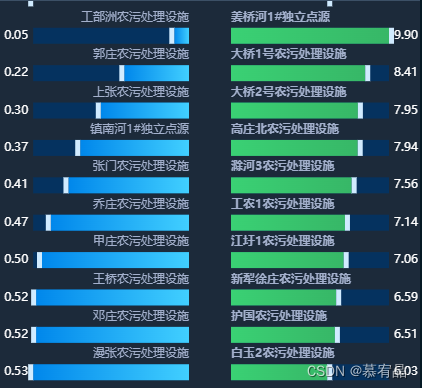
实现的效果


 766
766


 被折叠的 条评论
为什么被折叠?
被折叠的 条评论
为什么被折叠?
 到【灌水乐园】发言


