


网站地址:https://lishi.tianqi.com/changsha/202406.html
爬取网站数据代码
import csv #写入csV文件
import requests #模拟浏览器进行网络请求
from lxml import etree #进行数据预处理

def get_weather(url):
    weather_info=[] #新建一个列表,将爬取的每月数据放进去
    #请求头信息:浏览器版本型号,接收数据的编码格式

    headers={
        #必填,不填拿不到数据
        'User-Agent':'Mozilla/5.0 (Windows NT 6.1:WOW64)'
    }
    # 请求
    resp =requests.get(url,headers=headers)
    #数据预处理
    resp_html = etree.HTML(resp.text)
    # xpath提取所有数据
    resp_list = resp_html.xpath("//ul[@class='thrui']/li")
    # for循环迭代遍历
    for li in resp_list:
        # 定义每天的天气数据字典
        day_weather_info = {
            # 获取日期,格式为2023-01-01
            'date_time':li.xpath("./div[1]/text()")[0].split(' ')[0],
            #获取最高气温,并去除摄氏度符号)
            'high': li.xpath("./div[2]/text()")[0].replace('°C',''),
            # 获取最低气温,并去除摄氏度符号
            'low':li.xpath("./div[3]/text()")[0].replace('°C',''),
            #获取天气文本信息
            'weather': li.xpath("./div[4]/text()")[0]
        }
        # 再将每天的数据字典放入每月数据列表中
        weather_info.append(day_weather_info)
    # 返回每个月的天气数据列表
    return weather_info

weathers =[]
#for循环生成有顺序的1-12
for month in range(1,13):
    #找ur规律 进行拼接--拿的是某一月里的所有数据
    #获取对应月份的天气信息
    weather_time =f'2023{month:02}'
    url = f'https://lishi.tianqi.com/changsha/{weather_time}.html'
    #爬虫获取这个月的天气信息
    weather = get_weather(url)
    # print(weather)
    weathers.append(weather)

# print(weathers)

#数据写入(一次性写入)
with open("weathers.csv", 'w', newline='', encoding='utf-8')as csvfile:
    writer =csv.writer(csvfile)
    #先写入列名:columns_name
    writer.writerow(["日期","最高气温","最低气温","天气"])
    # 遍历出每个月的天气信息
    for month_weather in weathers:
        # 遍历出每天的天气信息
        for day_weather_dict in month_weather:
            #将每天的天气信息写入csv文件
            writer.writerow(list(day_weather_dict.values()))
网站数据可视化代码
# -*- coding: gbk -*-
import pandas as pd
from pyecharts import options as opts
from pyecharts.charts import Bar,Timeline
# 用pandas.read_csv()读取指定的excel文件,选择编码格式gb18030(gb18030范围比)
df = pd.read_csv('weathers.csv',encoding='utf-8')
# print(df['天气'])
#使用 pandas.apply()函数自动遍历DataFrame对象,然后使用lambda表达式逐个将字符串转换成时间类型
##这里必须要转换,否则日期不是datetime类型,就无法做该类型的相关操作
df['日期']= df['日期'].apply(lambda x: pd.to_datetime(x))
# print(df['日期'])
#新建一列月份数据(将日期中的月份一项单独拿取出来)
df['month']= df['日期'].dt.month
# print(df['month'])
## 使用reset_index()重置索引,如果不重置索引就会默认把month列做为索引列,但month列已经不是连续的索引
df_agg = df.groupby(['month','天气']).size().reset_index()
# print(df_agg)
#设置下这3列的列名
df_agg.columns =['month','tiangi','count']
# print(df_agg)
#画图
#实例化一个时间序列的对象
timeline = Timeline()
#播放参数:设置时间间隔1s 单位是:ms(毫秒)
timeline.add_schema(play_interval=1000)
#循环遍历df_agg['month']里的唯一值
for month in df_agg['month'].unique():
#获取天气的值
data =(
df_agg[df_agg['month'] == month][['tiangi','count']]
.sort_values(by='count',ascending=True)
.values.tolist()
)
# print(data)
#绘制柱状图
bar = Bar()
bar = Bar()
# x轴是天气名称
bar.add_xaxis([x[0] for x in data])
# y轴是出现次数
bar.add_yaxis('',[x[1] for x in data])
# 让柱状图横着放
bar.reversal_axis()
# 将计数标签放置在图形右边
bar.set_series_opts(label_opts=opts.LabelOpts(position='right'))
# 设置下图表的名称
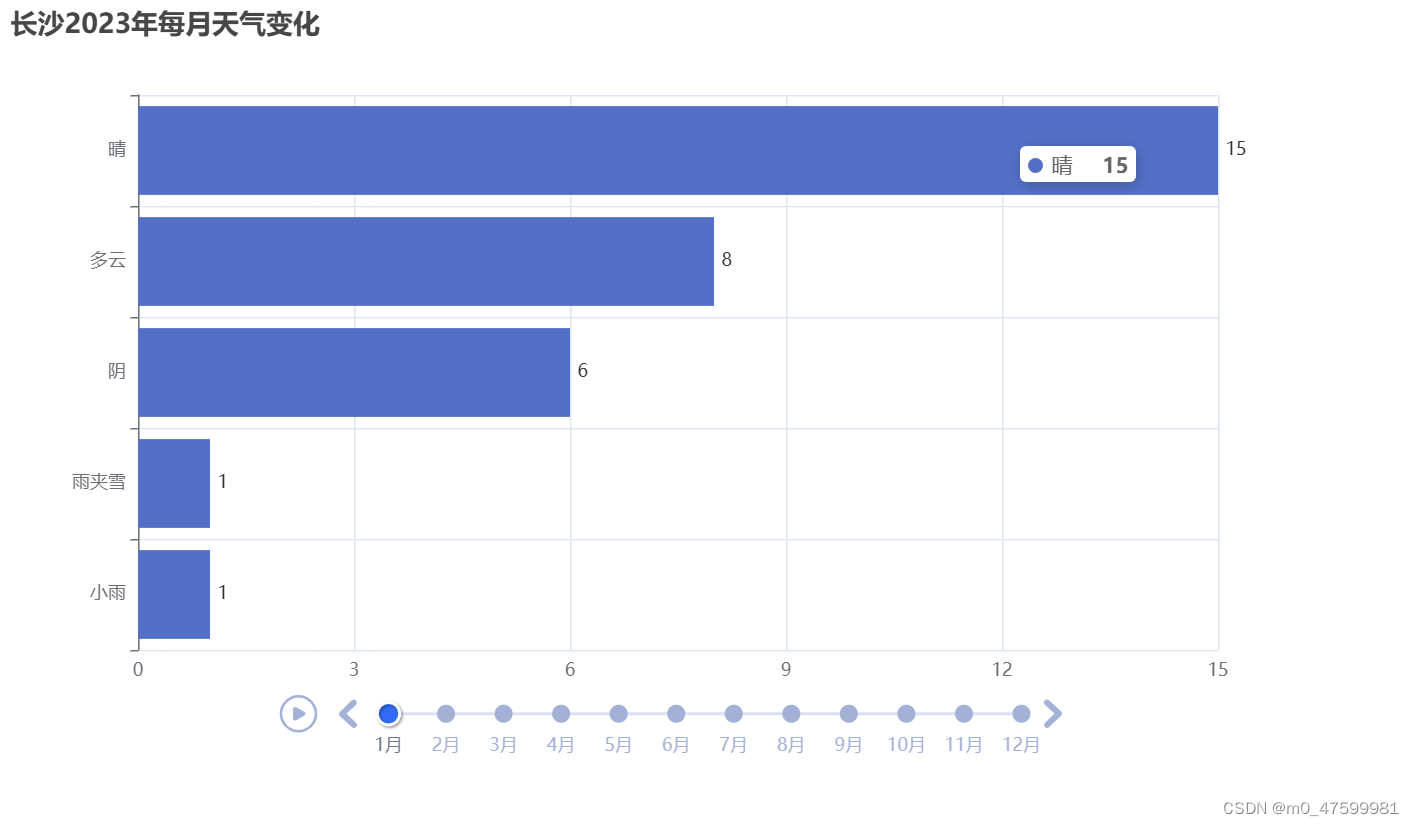
bar.set_global_opts(title_opts=opts.TitleOpts(title='长沙2023年每月天气变化'))
# 将设置好的bar对象放置到时间轮播图当中,并且标签选择月份格式为:数字月
timeline.add(bar,f'{month}月')
#将设置好的图表保存为weathers.html文件
timeline.render('weathers.html')可视化图形的生成
动态图标链接:


 781
781

 被折叠的 条评论
为什么被折叠?
被折叠的 条评论
为什么被折叠?
 到【灌水乐园】发言


