


文章目录
一、前言
在实际工作中,我们不能保证发布出去的产品是完美的,就算经过测试没有发现问题,有可能在用户环境就出现了,这也是正常的。如果在用户那边产品崩溃了我们可以怎么检查崩溃的原因呢?下面就简单的记录一下。
二、步骤
1、首先要拿到dump文件,最好是非minidump
2、打开windbg
3、运行命令!analyze -v
显示当前异常相关信息,内容如下:
*******************************************************************************
*                                                                             *
*                        Exception Analysis                                   *
*                                                                             *
*******************************************************************************

*** ERROR: Symbol file could not be found.  Defaulted to export symbols for QaxEngPluginManager.dll -
*** WARNING: Unable to verify checksum for Test.exe
*** ERROR: Symbol file could not be found.  Defaulted to export symbols for Test.exe -
*** ERROR: Symbol file could not be found.  Defaulted to export symbols for IPCManager32.dll -
*** ERROR: Symbol file could not be found.  Defaulted to export symbols for QKEntDATPBDCtrl32.dll -
*** ERROR: Symbol file could not be found.  Defaulted to export symbols for QKEntDATPCtrl32.dll -
Failed calling InternetOpenUrl, GLE=12029

FAULTING_IP:
KERNELBASE!RaiseException+58
75b6b760 c9              leave

EXCEPTION_RECORD:  ffffffff -- (.exr 0xffffffffffffffff)
ExceptionAddress: 75b6b760 (KERNELBASE!RaiseException+0x00000058)
   ExceptionCode: e06d7363 (C++ EH exception)
  ExceptionFlags: 00000001
NumberParameters: 3
   Parameter[0]: 19930520
   Parameter[1]: 0017ede0
   Parameter[2]: 656546f8

DEFAULT_BUCKET_ID:  APPLICATION_FAULT

PROCESS_NAME:  Test.exe

ERROR_CODE: (NTSTATUS) 0xe06d7363 - <Unable to get error code text>

EXCEPTION_CODE: (NTSTATUS) 0xe06d7363 - <Unable to get error code text>

EXCEPTION_PARAMETER1:  19930520

EXCEPTION_PARAMETER2:  0017ede0

EXCEPTION_PARAMETER3:  656546f8

MOD_LIST: <ANALYSIS/>

NTGLOBALFLAG:  0

APPLICATION_VERIFIER_FLAGS:  0

FAULTING_THREAD:  0000046c

PRIMARY_PROBLEM_CLASS:  APPLICATION_FAULT

BUGCHECK_STR:  APPLICATION_FAULT_APPLICATION_FAULT

LAST_CONTROL_TRANSFER:  from 6560a043 to 75b6b760

STACK_TEXT:
0017ed98 6560a043 e06d7363 00000001 00000003 KERNELBASE!RaiseException+0x58
0017edd0 656079a5 0017ede0 656546f8 6563b2e0 Rule32!_CxxThrowException+0x48 [f:\dd\vctools\crt_bld\self_x86\crt\prebuild\eh\throw.cpp @ 161]
0017edec 65597c55 ded84442 0017f8ac 691837b0 Rule32!operator new+0x64 [f:\dd\vctools\crt_bld\self_x86\crt\src\new.cpp @ 63]
0017ee04 655967f2 6f6c2221 00000000 0017f6c0 Rule32!std::_Allocate<wchar_t>+0x45 [c:\program files (x86)\microsoft visual studio 9.0\vc\include\xmemory @ 43]
0017ee18 655973b4 6f6c2221 65617437 0017f630 Rule32!std::allocator<wchar_t>::allocate+0x12 [c:\program files (x86)\microsoft visual studio 9.0\vc\include\xmemory @ 145]
0017f63c 65596709 6f6c2220 00000000 0017f658 Rule32!std::basic_string<wchar_t,std::char_traits<wchar_t>,std::allocator<wchar_t> >::_Copy+0xd4 [c:\program files (x86)\microsoft visual studio 9.0\vc\include\xstring @ 2097]
0017f654 6559655a 6f6c2220 00000000 0017f6c0 Rule32!std::basic_string<wchar_t,std::char_traits<wchar_t>,std::allocator<wchar_t> >::_Grow+0x39 [c:\program files (x86)\microsoft visual studio 9.0\vc\include\xstring @ 2123]
0017f668 6559d575 20200a7b 6f6c2220 0017f6c0 Rule32!std::basic_string<wchar_t,std::char_traits<wchar_t>,std::allocator<wchar_t> >::assign+0x4a [c:\program files (x86)\microsoft visual studio 9.0\vc\include\xstring @ 1074]
0017f680 6559c95d 20200a7b 6f6c2220 b8793bcb Rule32!std::basic_string<wchar_t,std::char_traits<wchar_t>,std::allocator<wchar_t> >::basic_string<wchar_t,std::char_traits<wchar_t>,std::allocator<wchar_t> >+0x35 [c:\program files (x86)\microsoft visual studio 9.0\vc\include\xstring @ 640]
0017f72c 691a9b6a 00f342d8 009da020 00000000 Rule32!QKMatchWhiteRule::DoAction+0xbd [c:\jenkins\workspace\scc\client_eilcode_exportinterfacelayer@2\code\modules\matchwhiterule\qkmatchwhiterule.cpp @ 115]
WARNING: Stack unwind information not available. Following frames may be wrong.
0017f7f0 691a62ec 00f342d8 009da020 00000000 QaxEngPluginManager!boost::serialization::singleton<CGetEnglog>::get_mutable_instance+0x1fa9a
0017f844 00e93d39 00f342d8 009da020 00000000 QaxEngPluginManager!boost::serialization::singleton<CGetEnglog>::get_mutable_instance+0x1c21c
0017f8d8 774e8424 0000000e 00000008 07192c94 Test!boost::serialization::singleton_module::is_locked+0x1e69
0017f974 774e8662 0017f990 4a78a2bd fffffffe sechost!ScDispatcherLoop+0x4a6
0017f9b4 00e93745 0017f9c4 00f4ce60 009df150 sechost!StartServiceCtrlDispatcherW+0xb0
0017f9d4 00e9c881 4a075889 009d9f08 0000002e Test!boost::serialization::singleton_module::is_locked+0x1875
0017fa98 00e9caa3 0017fb24 ffffffff 00000024 Test!boost::serialization::singleton<CGetEnglog>::get_mutable_instance+0x8021
0017fb44 00effc8e 00e90000 00000000 0034172a Test!boost::serialization::singleton<CGetEnglog>::get_mutable_instance+0x8243
0017fbd4 773e3c45 7ffdd000 0017fc20 778137f5 Test!boost::serialization::singleton<CGetEnglog>::get_mutable_instance+0x6b42e
0017fbe0 778137f5 7ffdd000 77814858 00000000 kernel32!BaseThreadInitThunk+0xe
0017fc20 778137c8 00effcf9 7ffdd000 ffffffff ntdll!__RtlUserThreadStart+0x70
0017fc38 00000000 00effcf9 7ffdd000 00000000 ntdll!_RtlUserThreadStart+0x1b


STACK_COMMAND:  ~0s; .ecxr ; kb

FOLLOWUP_IP:
Rule32!operator new+64 [f:\dd\vctools\crt_bld\self_x86\crt\src\new.cpp @ 63]
656079a5 cc              int     3

FAULTING_SOURCE_CODE:
No source found for 'f:\dd\vctools\crt_bld\self_x86\crt\src\new.cpp'


SYMBOL_STACK_INDEX:  2

SYMBOL_NAME:  rule32!operator new+64

FOLLOWUP_NAME:  MachineOwner

MODULE_NAME: Rule32

IMAGE_NAME:  Rule32.dll

DEBUG_FLR_IMAGE_TIMESTAMP:  607947d6

FAILURE_BUCKET_ID:  APPLICATION_FAULT_e06d7363_Rule32.dll!operator_new

BUCKET_ID:  APPLICATION_FAULT_APPLICATION_FAULT_rule32!operator_new+64

WATSON_STAGEONE_URL:  http://watson.microsoft.com/StageOne/Test_exe/2_0_0_23/608ac54d/KERNELBASE_dll/6_1_7601_17514/4ce7b8f0/e06d7363/0000b760.htm?Retriage=1

Followup: MachineOwner
---------
4、点击MODULE_NAME显示的蓝色模块名,获取异常模块的信息
或者使用命令lmvm 模块名查询模块信息
5、设置符号和代码路径
根据Timestamp和File version获取到对应的pdb文件和代码
1)设置代码路径
点击windbg的File——Source File Path——输入模块代码所在路径——点击ok;
或者Ctrl+P打开
2)设置符号表路径
点击windbg的File——Symbol File Path——输入模块pdb文件路径——点击reload——点击ok;
或者直接Ctrl+S打开设置pdb文件路径;
也可以在windbg窗口输入.reload加载pdb文件
3)运行命令!analyze -v
同上
4)执行STACK_COMMAND的命令
如下:
eax=022f0000 ebx=06971020 ecx=00000007 edx=777f70b4 esi=06970fe0 edi=0017c5d4
eip=777f70b4 esp=0017c294 ebp=0017c2a4 iopl=0         nv up ei pl zr na pe nc
cs=001b  ss=0023  ds=0023  es=0023  fs=003b  gs=0000             efl=00000246
ntdll!KiFastSystemCallRet:
777f70b4 c3              ret
eax=0017ed48 ebx=65597398 ecx=00000003 edx=00000000 esi=6565f424 edi=0017f630
eip=75b6b760 esp=0017ed48 ebp=0017ed98 iopl=0         nv up ei pl nz ac pe nc
cs=001b  ss=0023  ds=0023  es=0023  fs=003b  gs=0000             efl=00000216
KERNELBASE!RaiseException+0x58:
75b6b760 c9              leave
  *** Stack trace for last set context - .thread/.cxr resets it
ChildEBP RetAddr  Args to Child
0017ed98 6560a043 e06d7363 00000001 00000003 KERNELBASE!RaiseException+0x58
0017edd0 656079a5 0017ede0 656546f8 6563b2e0 Rule32!_CxxThrowException+0x48 [f:\dd\vctools\crt_bld\self_x86\crt\prebuild\eh\throw.cpp @ 161]
0017edec 65597c55 ded84442 0017f8ac 691837b0 Rule32!operator new+0x64 [f:\dd\vctools\crt_bld\self_x86\crt\src\new.cpp @ 63]
0017ee04 655967f2 6f6c2221 00000000 0017f6c0 Rule32!std::_Allocate<wchar_t>+0x45 [c:\program files (x86)\microsoft visual studio 9.0\vc\include\xmemory @ 43]
0017ee18 655973b4 6f6c2221 65617437 0017f630 Rule32!std::allocator<wchar_t>::allocate+0x12 [c:\program files (x86)\microsoft visual studio 9.0\vc\include\xmemory @ 145]
0017f63c 65596709 6f6c2220 00000000 0017f658 Rule32!std::basic_string<wchar_t,std::char_traits<wchar_t>,std::allocator<wchar_t> >::_Copy+0xd4 [c:\program files (x86)\microsoft visual studio 9.0\vc\include\xstring @ 2097]
0017f654 6559655a 6f6c2220 00000000 0017f6c0 Rule32!std::basic_string<wchar_t,std::char_traits<wchar_t>,std::allocator<wchar_t> >::_Grow+0x39 [c:\program files (x86)\microsoft visual studio 9.0\vc\include\xstring @ 2123]
0017f668 6559d575 20200a7b 6f6c2220 0017f6c0 Rule32!std::basic_string<wchar_t,std::char_traits<wchar_t>,std::allocator<wchar_t> >::assign+0x4a [c:\program files (x86)\microsoft visual studio 9.0\vc\include\xstring @ 1074]
0017f680 6559c95d 20200a7b 6f6c2220 b8793bcb Rule32!std::basic_string<wchar_t,std::char_traits<wchar_t>,std::allocator<wchar_t> >::basic_string<wchar_t,std::char_traits<wchar_t>,std::allocator<wchar_t> >+0x35 [c:\program files (x86)\microsoft visual studio 9.0\vc\include\xstring @ 640]
0017f72c 691a9b6a 00f342d8 009da020 00000000 Rule32!QKMatchWhiteRule::DoAction+0xbd [c:\jenkins\workspace\scc\client_eilcode_exportinterfacelayer@2\code\modules\matchwhiterule\qkmatchwhiterule.cpp @ 115]
WARNING: Stack unwind information not available. Following frames may be wrong.
0017f7f0 691a62ec 00f342d8 009da020 00000000 Test!boost::serialization::singleton<CGetEnglog>::get_mutable_instance+0x1fa9a
0017f844 00e93d39 00f342d8 009da020 00000000 Test!boost::serialization::singleton<CGetEnglog>::get_mutable_instance+0x1c21c
0017f8d8 774e8424 0000000e 00000008 07192c94 Test!boost::serialization::singleton_module::is_locked+0x1e69
0017f974 774e8662 0017f990 4a78a2bd fffffffe sechost!ScDispatcherLoop+0x4a6
0017f9b4 00e93745 0017f9c4 00f4ce60 009df150 sechost!StartServiceCtrlDispatcherW+0xb0
0017f9d4 00e9c881 4a075889 009d9f08 0000002e Test!boost::serialization::singleton_module::is_locked+0x1875
0017fa98 00e9caa3 0017fb24 ffffffff 00000024 Test!boost::serialization::singleton<CGetEnglog>::get_mutable_instance+0x8021
0017fb44 00effc8e 00e90000 00000000 0034172a Test!boost::serialization::singleton<CGetEnglog>::get_mutable_instance+0x8243
0017fbd4 773e3c45 7ffdd000 0017fc20 778137f5 Test!boost::serialization::singleton<CGetEnglog>::get_mutable_instance+0x6b42e
0017fbe0 778137f5 7ffdd000 77814858 00000000 kernel32!BaseThreadInitThunk+0xe
0017fc20 778137c8 00effcf9 7ffdd000 ffffffff ntdll!__RtlUserThreadStart+0x70
0017fc38 00000000 00effcf9 7ffdd000 00000000 ntdll!_RtlUserThreadStart+0x1b
5)执行knL
0:000> knL
  *** Stack trace for last set context - .thread/.cxr resets it
 # ChildEBP RetAddr
00 0017ed98 6560a043 KERNELBASE!RaiseException+0x58
01 0017edd0 656079a5 Rule32!_CxxThrowException+0x48
02 0017edec 65597c55 Rule32!operator new+0x64
03 0017ee04 655967f2 Rule32!std::_Allocate<wchar_t>+0x45
04 0017ee18 655973b4 Rule32!std::allocator<wchar_t>::allocate+0x12
05 0017f63c 65596709 Rule32!std::basic_string<wchar_t,std::char_traits<wchar_t>,std::allocator<wchar_t> >::_Copy+0xd4
06 0017f654 6559655a Rule32!std::basic_string<wchar_t,std::char_traits<wchar_t>,std::allocator<wchar_t> >::_Grow+0x39
07 0017f668 6559d575 Rule32!std::basic_string<wchar_t,std::char_traits<wchar_t>,std::allocator<wchar_t> >::assign+0x4a
08 0017f680 6559c95d Rule32!std::basic_string<wchar_t,std::char_traits<wchar_t>,std::allocator<wchar_t> >::basic_string<wchar_t,std::char_traits<wchar_t>,std::allocator<wchar_t> >+0x35
09 0017f72c 691a9b6a Rule32!Rule::DoAction+0xbd
WARNING: Stack unwind information not available. Following frames may be wrong.
0a 0017f7f0 691a62ec Test!boost::serialization::singleton<CGetEnglog>::get_mutable_instance+0x1fa9a
0b 0017f844 00e93d39 Test!boost::serialization::singleton<CGetEnglog>::get_mutable_instance+0x1c21c
0c 0017f8d8 774e8424 Test!boost::serialization::singleton_module::is_locked+0x1e69
0d 0017f974 774e8662 sechost!ScDispatcherLoop+0x4a6
0e 0017f9b4 00e93745 sechost!StartServiceCtrlDispatcherW+0xb0
0f 0017f9d4 00e9c881 Test!boost::serialization::singleton_module::is_locked+0x1875
10 0017fa98 00e9caa3 Test!boost::serialization::singleton<CGetEnglog>::get_mutable_instance+0x8021
11 0017fb44 00effc8e Test!boost::serialization::singleton<CGetEnglog>::get_mutable_instance+0x8243
12 0017fbd4 773e3c45 Test!boost::serialization::singleton<CGetEnglog>::get_mutable_instance+0x6b42e
13 0017fbe0 778137f5 kernel32!BaseThreadInitThunk+0xe
14 0017fc20 778137c8 ntdll!__RtlUserThreadStart+0x70
15 0017fc38 00000000 ntdll!_RtlUserThreadStart+0x1b
6)执行.frame 9
由5)可知,在线程9开始异常(也可以在执行STACK_COMMAND的命令时按顺序从00开始,获取对应序号值);
若代码和pdb匹配,执行命令后会跳转到代码对应位置
7)查看该接口的参数值
点击windbg菜单的Locals或者Alt+3

之后出现下图弹窗:
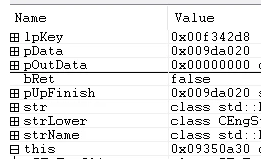
到这里,我们就可以查看参数值,判断为什么崩溃了,由堆栈信息可知,是在申请空间的时候崩溃了,结合代码发现,需申请

这么大的空间,但是内存空间不足,同时没有异常处理机制,所以崩溃了。


 1631
1631


 被折叠的 条评论
为什么被折叠?
被折叠的 条评论
为什么被折叠?
 到【灌水乐园】发言


