


英文能力好的,可以直接去扒拉官网!!!
官网地址: https://openlayers.org/
快速开始: https://openlayers.org/doc/quickstart.html
地图相关模块
Map
The map is the core component of OpenLayers. For a map to render, a view, one or more layers, and a target container are needed(地图是OpenLayers的核心组件。要呈现一个地图,需要一个视图、一个或多个图层和一个目标容器):
import Map from 'ol/Map.js';
import View from 'ol/View.js';
import TileLayer from 'ol/layer/Tile.js';
import OSM from 'ol/source/OSM.js';

const map = new Map({
  // view
  view: new View({
    center: [0, 0],
    zoom: 1,
  }),
  // one or more layers
  layers: [
    new TileLayer({
      source: new OSM(),
    }),
  ],
  // a target container
  target: 'map',
});
view
A View object represents a simple 2D view of the map.
This is the object to act upon to change the center, resolution, and rotation of the map.(这是用于更改地图的中心、分辨率和旋转的对象。)
Layers (图层)
TileLayer (瓦片图层)
For layer sources that provide pre-rendered, tiled images in grids that are organized by zoom levels for specific resolutions. Note that any property set in the options is set as a BaseObject property on the layer object; for example, setting title: ‘My Title’ in the options means that title is observable, and has get/set accessors.
(对于在网格中提供预渲染平铺图像的图层源,这些网格按特定分辨率的缩放级别组织。注意,在选项中设置的任何属性都被设置为层对象的BaseObject属性;例如,在options中设置title: 'My title '意味着title是一个可观察对象,并且有get/set访问器。)
ImageLayer(图像图层)
Server-rendered images that are available for arbitrary extents and resolutions.
(可用于任意范围和分辨率的服务器渲染图像)
VectorLayer(矢量图层)
Vector data is rendered client-side, as vectors. This layer type provides most accurate rendering even during animations. Points and labels stay upright on rotated views. For very large amounts of vector data, performance may suffer during pan and zoom animations. In this case, try VectorImageLayer.
(矢量数据在客户端呈现为矢量。即使在动画期间,此图层类型也能提供最准确的渲染。点和标签在旋转视图上保持直立。对于大量矢量数据,平移和缩放动画期间性能可能会受到影响。在这种情况下,请尝试VectorImageLayer。)
VectorImageLayer(矢量图像图层)
Vector data is rendered client-side, to an image. This layer type provides great performance during panning and zooming, but point symbols and texts are always rotated with the view and pixels are scaled during zoom animations. For more accurate rendering of vector data, use VectorLayer instead.
(矢量数据在客户端渲染为图像。此图层类型在平移和缩放期间提供了出色的性能,但点符号和文本始终随视图旋转,并且像素在缩放动画期间缩放。为了更准确地渲染矢量数据,请改用 VectorLayer。)
VectorTileLayer (矢量瓦片图层)
Layer for vector tile data that is rendered client-side.(客户端渲染的矢量切片数据的图层。)
WebGLTileLayer (WebGL瓦片图层)
For layer sources that provide pre-rendered, tiled images in grids that are organized by zoom levels for specific resolutions.(对于在网格中提供预渲染、平铺图像的图层源,这些图像按特定分辨率的缩放级别进行组织。)
vue3中使用
安装
pnpm add ol
简单使用
<template>
 <div id="weather-map" />
</template>
<script setup lang="ts">
  import { ref, reactive } from 'vue'
  import 'ol/ol.css'
  import TileLayer from 'ol/layer/Tile'
  import { Map, View } from 'ol'
  import { fromLonLat } from 'ol/proj'
  import XYZ from 'ol/source/XYZ'

  /** 地图相关操作 */
  const map = ref()

  const mapView = reactive({
    center: fromLonLat([116.397128, 39.916527]), // 北京
    zoom: 10,
    minZoom: 4,
    maxZoom: 18
  })

  const mapUrl = ref(
    'http://t0.tianditu.gov.cn/img_w/wmts?SERVICE=WMTS&REQUEST=GetTile&VERSION=1.0.0&LAYER=img&STYLE=default&TILEMATRIXSET=w&FORMAT=tiles&TILEMATRIX={z}&TILEROW={y}&TILECOL={x}&tk=97546c3d85ab8620c9459aac2906743b'
  )

  const initMap = () => {
    const tileLayer = new TileLayer({
      opacity: 0.8, // 透明度
      source: new XYZ({
        url: mapUrl.value
      })
    })
    map.value = new Map({
      layers: [tileLayer],
      view: new View(mapView),
      target: 'weather-map'
    })
  }
  const removeMap = () => {
    if (map.value) {
      // handleChangeCheck([]).removeCircleLayer()
      // handleChangeCheck([]).removeImageLayer()
      map.value.dispose()
      map.value = null
    }
  }
</script>
<style lang="scss" scoped>
#weather-map {
  width: 600px;
  height: 400px;
  margin: auto;
}
</style>
业务场景
开发中有一些业务场景,在这记录一下实现,可以参考
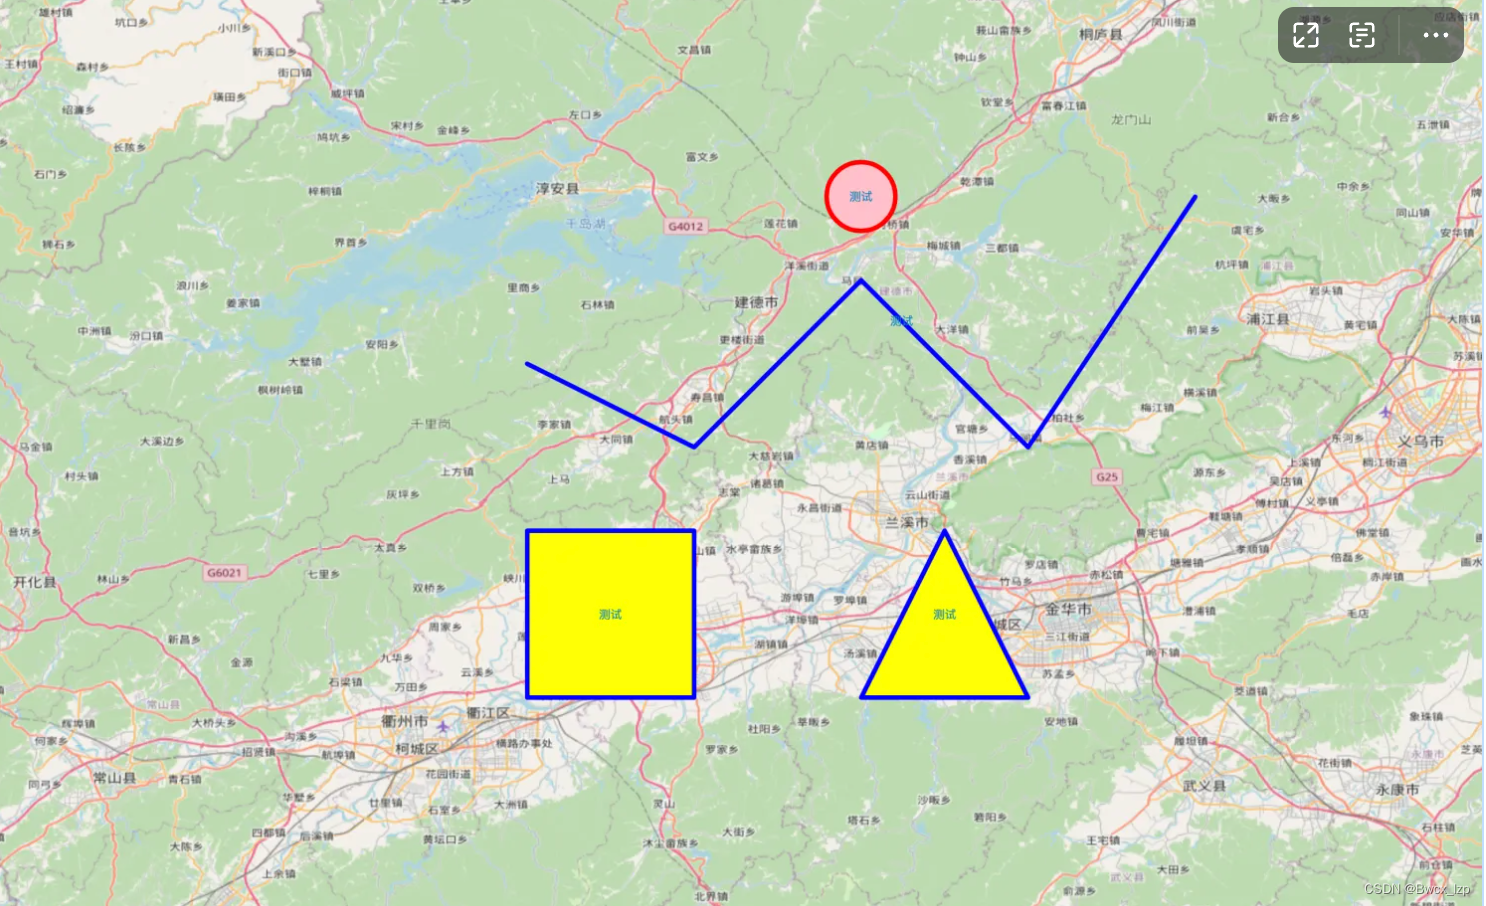
1. 绘制多边形或者圆形
import "./style.css";
import { Map, View, Feature } from "ol";
import { Polygon, LineString, Point } from "ol/geom";
import TileLayer from "ol/layer/Tile";
import OSM from "ol/source/OSM";
import { Vector as VectorSource } from "ol/source";
import { Vector as VectorLayer } from "ol/layer";
import { Fill, Style, Circle as CircleStyle, Text, Stroke } from "ol/style";

// 创建要素图层
const vectorLayer = new VectorLayer({
  source: new VectorSource({
    features: [
      new Feature({
        geometry: new Polygon([
          [
            [119.0, 29.0],
            [119.2, 29.0],
            [119.2, 29.2],
            [119.0, 29.2],
            [119.0, 29.0],
          ],
        ]),
        name: "A",
      }),
      new Feature({
        geometry: new Polygon([
          [
            [119.4, 29.0],
            [119.6, 29.0],
            [119.5, 29.2],
            [119.4, 29.0],
          ],
        ]),
        name: "B",
      }),
      new Feature({
        geometry: new LineString([
          [119.0, 29.4],
          [119.2, 29.3],
          [119.4, 29.5],
          [119.6, 29.3],
          [119.8, 29.6],
        ]),
        name: "C",
      }),
      new Feature({
        geometry: new Point([119.4, 29.6]),
        name: "D",
      }),
    ],
  }),
  style: new Style({
    image: new CircleStyle({
      radius: 30,
      stroke: new Stroke({
        width: 4,
        color: "red",
      }),
      fill: new Fill({
        color: "pink",
      }),
    }),
    stroke: new Stroke({
      width: 4,
      color: "blue",
    }),
    fill: new Fill({
      color: "yellow",
    }),
    text: new Text({
      font: '10px Microsoft YaHei',
      text: '测试',
      overflow: true,
      textAlign: 'center',
      textBaseline: 'middle',
      fill: new Fill({
        color: '#0e84ba'
      }),
      offsetX: 0
    })
  }),
});

// 创建地图
const map = new Map({
  target: "map",
  layers: [
    new TileLayer({
      source: new OSM(),
    }),
  ],
  view: new View({
    projection: "EPSG:4326",
    center: [119.2, 29.2],
    zoom: 10,
  }),
});
map.addLayer(vectorLayer);
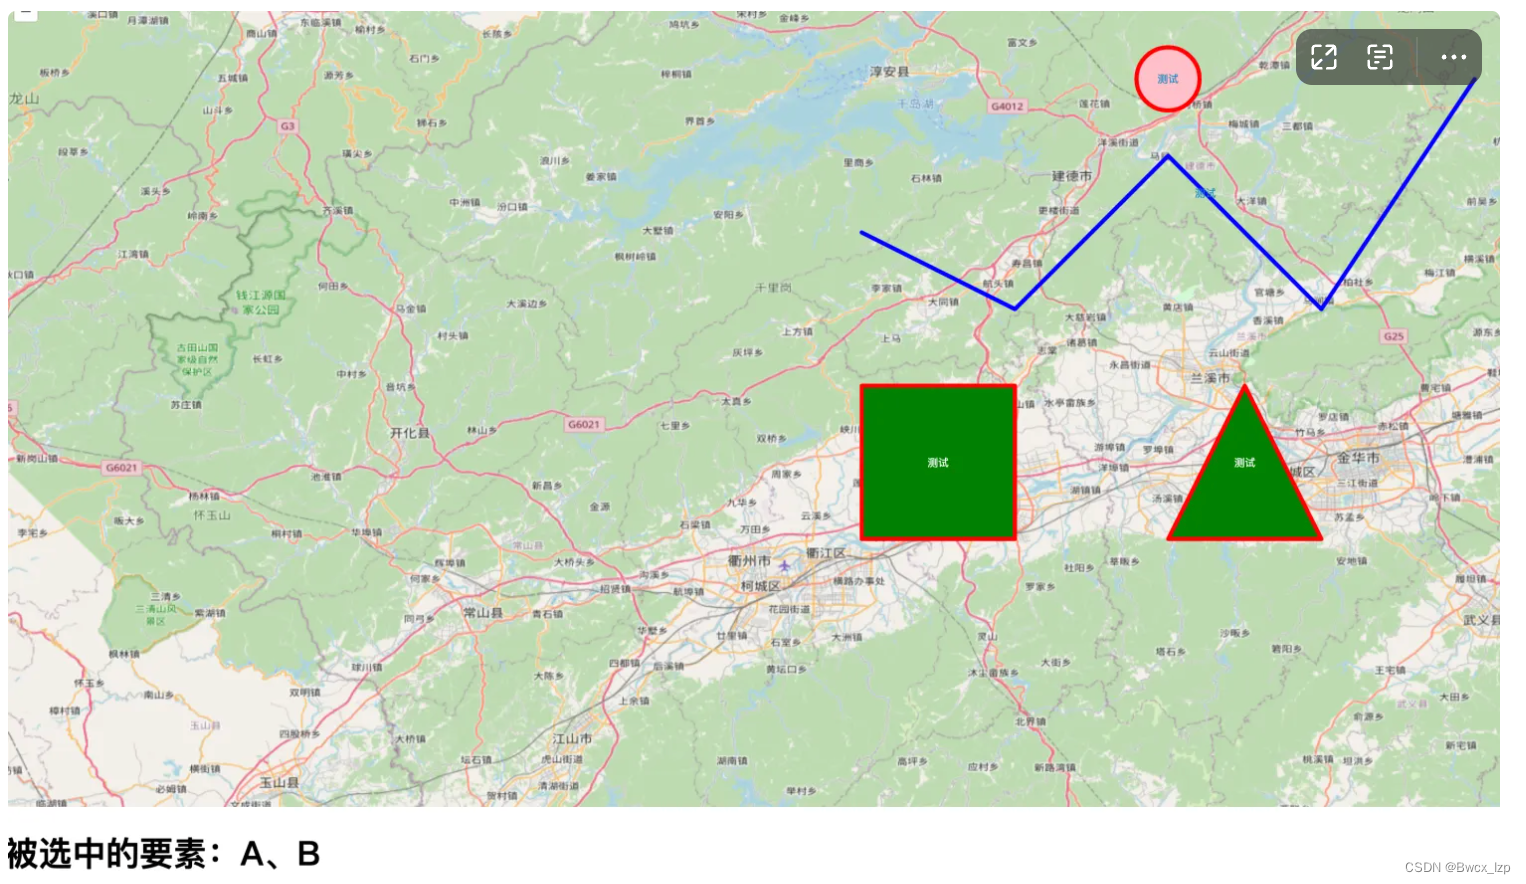
2. 绘制网格并可框选
2.1 框选实现
参考自:OpenLayers基础教程——要素的点选、框选、圈选、多边形选择
import "./style.css";
import { Map, View, Feature } from "ol";
import { Polygon, LineString, Point } from "ol/geom";
import { Select, DragBox } from "ol/interaction";
import { never, always } from "ol/events/condition";
import TileLayer from "ol/layer/Tile";
import OSM from "ol/source/OSM";
import { Vector as VectorSource } from "ol/source";
import { Vector as VectorLayer } from "ol/layer";
import { Fill, Style, Circle as CircleStyle, Text, Stroke } from "ol/style";

// 创建要素图层
const vectorLayer = new VectorLayer({
  source: new VectorSource({
    features: [
      new Feature({
        geometry: new Polygon([
          [
            [119.0, 29.0],
            [119.2, 29.0],
            [119.2, 29.2],
            [119.0, 29.2],
            [119.0, 29.0],
          ],
        ]),
        name: "A",
      }),
      new Feature({
        geometry: new Polygon([
          [
            [119.4, 29.0],
            [119.6, 29.0],
            [119.5, 29.2],
            [119.4, 29.0],
          ],
        ]),
        name: "B",
      }),
      new Feature({
        geometry: new LineString([
          [119.0, 29.4],
          [119.2, 29.3],
          [119.4, 29.5],
          [119.6, 29.3],
          [119.8, 29.6],
        ]),
        name: "C",
      }),
      new Feature({
        geometry: new Point([119.4, 29.6]),
        name: "D",
      }),
    ],
  }),
  style: new Style({
    image: new CircleStyle({
      radius: 30,
      stroke: new Stroke({
        width: 4,
        color: "red",
      }),
      fill: new Fill({
        color: "pink",
      }),
    }),
    stroke: new Stroke({
      width: 4,
      color: "blue",
    }),
    fill: new Fill({
      color: "yellow",
    }),
    text: new Text({
      font: "10px Microsoft YaHei",
      text: "测试",
      overflow: true,
      textAlign: "center",
      textBaseline: "middle",
      fill: new Fill({
        color: "#0e84ba",
      }),
      offsetX: 0,
    }),
  }),
});

// 创建地图
const map = new Map({
  target: "map",
  layers: [
    new TileLayer({
      source: new OSM(),
    }),
  ],
  view: new View({
    projection: "EPSG:4326",
    center: [119.2, 29.2],
    zoom: 10,
  }),
});
map.addLayer(vectorLayer);

// 创建选择工具,用于盛放矩形框内的要素
const select = new Select({
  condition: never,
  style: new Style({
    image: new CircleStyle({
      radius: 30,
      stroke: new Stroke({
        width: 4,
        color: "red",
      }),
      fill: new Fill({
        color: "green",
      }),
    }),
    stroke: new Stroke({
      width: 4,
      color: "red",
    }),
    fill: new Fill({
      color: "green",
    }),
    text: new Text({
      font: "10px Microsoft YaHei",
      text: "测试",
      overflow: true,
      textAlign: "center",
      textBaseline: "middle",
      fill: new Fill({
        color: "#ffffff",
      }),
      offsetX: 0,
    }),
  }),
});

// 创建绘制工具
const dragBox = new DragBox({
  condition: always,
});

// 开始绘制,清除已有要素
dragBox.on("boxstart", function () {
  select.getFeatures().clear();
});

// 结束绘制
dragBox.on("boxend", function () {
  // 获取被选择的要素
  const extent = dragBox.getGeometry().getExtent();
  vectorLayer
    .getSource()
    .forEachFeatureIntersectingExtent(extent, function (feature) {
      select.getFeatures().push(feature);
    });

  // 遍历被选中的要素
  const selected = [];
  const selectedFeatures = select.getFeatures();
  for (let i = 0; i < selectedFeatures.getLength(); i++) {
    const feature = selectedFeatures.item(i);
    const name = feature.get("name");
    selected.push(name);
  }
  // 输出查询结果
  const msg = selected.join("、");
  document.getElementById("msg").innerText = "被选中的要素:" + msg;
});

// 添加交互工具
map.addInteraction(dragBox);
map.addInteraction(select);
2.2 绘制网格并可框选
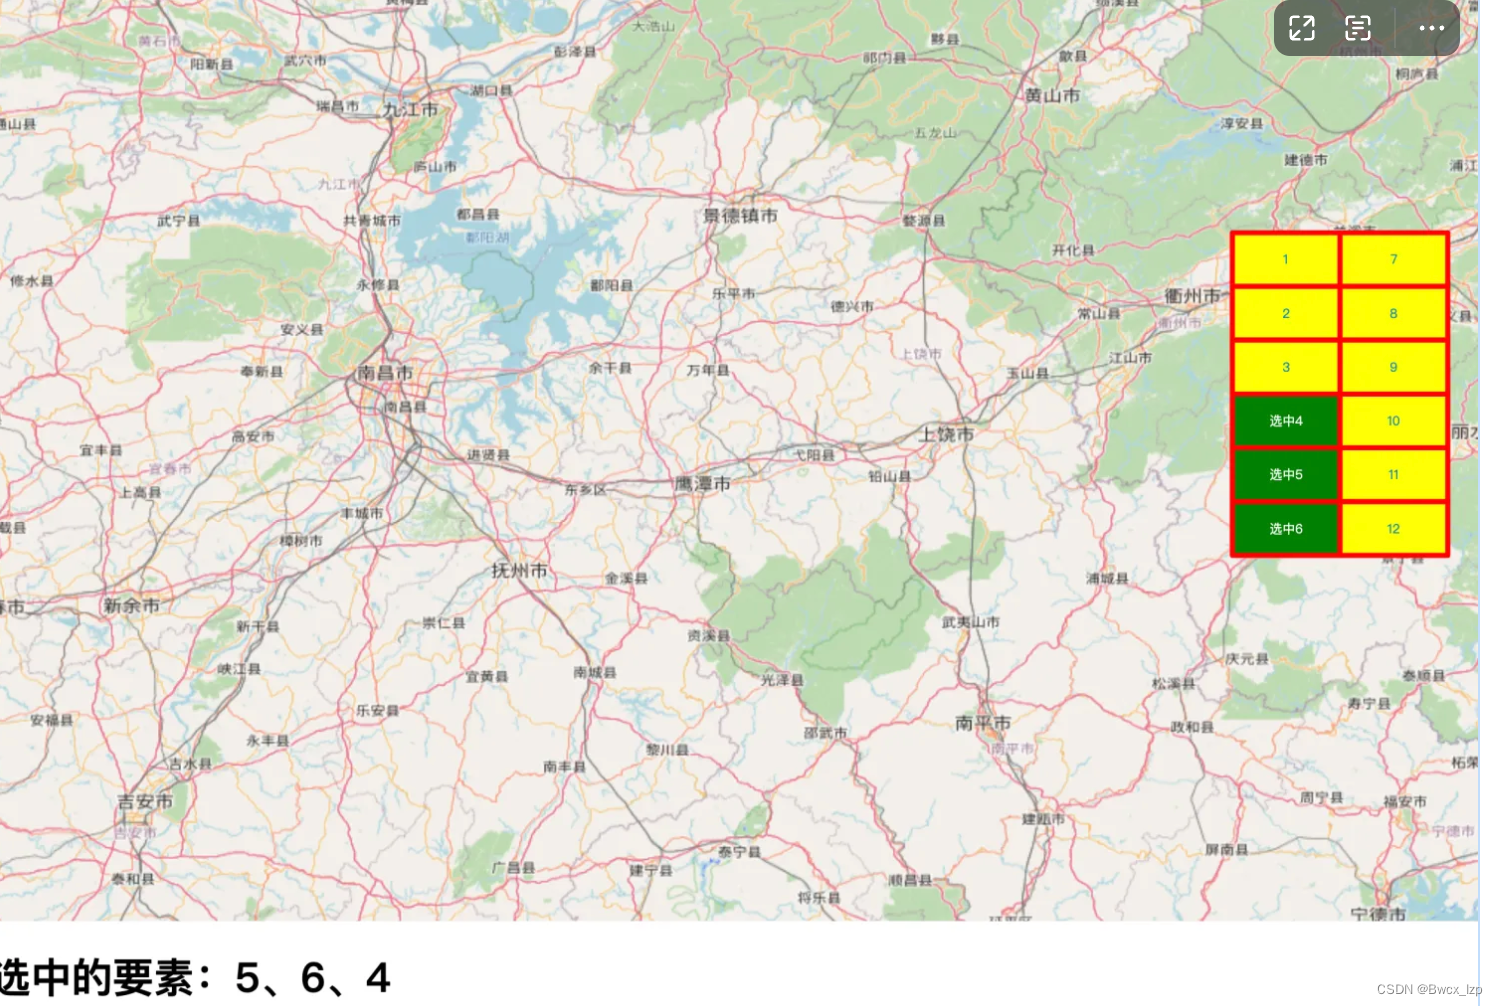
实现:
import "./style.css";
import { Map, View, Feature } from "ol";
import { Polygon } from "ol/geom";
import { Select, DragBox } from "ol/interaction";
import { never, always } from "ol/events/condition";
import TileLayer from "ol/layer/Tile";
import OSM from "ol/source/OSM";
import { Vector as VectorSource } from "ol/source";
import { Vector as VectorLayer } from "ol/layer";
import { Fill, Style, Text, Stroke } from "ol/style";

/**
 * 根据起始点、终止点和步长生成网格
 * @param {Array<number>} startPosition - 左上角经纬度 [经度, 纬度]
 * @param {Array<number>} endPosition - 右下角经纬度 [经度, 纬度]
 * @param {number} lonStep - 经度步长
 * @param {number} latStep - 纬度步长
 * @returns {Array<Feature>} 生成的网格要素数组
 */
const generateGrid = (startPosition, endPosition, lonStep, latStep) => {
  const features = [];
  let idCounter = 1; // 用于给每个长方形赋予一个简单的数字ID,从1开始

  for (let lon = startPosition[0]; lon < endPosition[0]; lon += lonStep) {
    for (let lat = startPosition[1]; lat > endPosition[1]; lat -= latStep) {
      const squareCoords = [
        [
          [lon, lat],
          [lon + lonStep, lat],
          [lon + lonStep, lat - latStep],
          [lon, lat - latStep],
          [lon, lat], // 闭合长方形
        ],
      ];

      const feature = new Feature({
        geometry: new Polygon(squareCoords),
        name: idCounter.toString(), // 将ID转换为字符串作为name
      });

      features.push(feature);
      idCounter++; // 更新ID计数器
    }
  }

  return features;
};

// 使用 generateGrid 函数生成网格并创建 VectorLayer
const vectorSource = new VectorSource({
  features: generateGrid([119.0, 29.2], [119.8, 28.2], 0.4, 0.2),
});

const vectorLayer = new VectorLayer({
  source: vectorSource,
  style: function (feature) {
    // 同原始代码中的样式设置
    return new Style({
      stroke: new Stroke({
        width: 4,
        color: "red",
      }),
      fill: new Fill({
        color: "yellow",
      }),
      text: new Text({
        font: "10px Microsoft YaHei",
        text: feature.get("name"),
        overflow: true,
        textAlign: "center",
        textBaseline: "middle",
        fill: new Fill({
          color: "#0e84ba",
        }),
        offsetX: 0,
      }),
    });
  },
});

// 创建地图
const map = new Map({
  target: "map",
  layers: [
    new TileLayer({
      source: new OSM(),
    }),
  ],
  view: new View({
    projection: "EPSG:4326",
    center: [119.2, 29.2],
    zoom: 10,
  }),
});
map.addLayer(vectorLayer);

// 创建选择工具,用于盛放矩形框内的要素
const select = new Select({
  condition: never,
  style: function (feature) {
    return new Style({
      stroke: new Stroke({
        width: 4,
        color: "red",
      }),
      fill: new Fill({
        color: "green",
      }),
      text: new Text({
        font: "10px Microsoft YaHei",
        text: "选中" + feature.get("name"),
        overflow: true,
        textAlign: "center",
        textBaseline: "middle",
        fill: new Fill({
          color: "#ffffff",
        }),
        offsetX: 0,
      }),
    });
  },
});

// 创建绘制工具
const dragBox = new DragBox({
  condition: always,
});

// 开始绘制,清除已有要素
dragBox.on("boxstart", function () {
  select.getFeatures().clear();
});

// 结束绘制
dragBox.on("boxend", function () {
  // 获取被选择的要素
  const extent = dragBox.getGeometry().getExtent();
  vectorLayer
    .getSource()
    .forEachFeatureIntersectingExtent(extent, function (feature) {
      select.getFeatures().push(feature);
    });

  // 遍历被选中的要素
  const selected = [];
  const selectedFeatures = select.getFeatures();
  for (let i = 0; i < selectedFeatures.getLength(); i++) {
    const feature = selectedFeatures.item(i);
    const name = feature.get("name");
    selected.push(name);
  }
  // 输出查询结果
  const msg = selected.join("、");
  document.getElementById("msg").innerText = "被选中的要素:" + msg;
});

// 监听地图的点击事件,点击时清除框选
map.on("singleclick", function () {
  select.getFeatures().clear();
  document.getElementById("msg").innerText = "";
});

// 添加交互工具
map.addInteraction(dragBox);
map.addInteraction(select);
3. 监听地图的分辨率变化
/** 动态设置内部蓝色圆样式的函数 */
function updateStyleBasedOnResolution(feature, resolution) {
  // resolution分辨率
  const fontSize = Math.round((12 / resolution) * 120)
  const radius = Math.round((10 / resolution) * 100)

  const dynamicLabelStyle = new Style({
    text: new Text({
      text: feature.style_.text_.text_,
      font: `${fontSize}px`,
      fill: new Fill({ color: '#fff' })
    }),
    image: new CircleStyle({
      radius: radius,
      fill: new Fill({ color: '#1D59F2' }),
      stroke: new Stroke({ color: '#1D59F2', width: 2 })
    })
  })
  feature.setStyle(dynamicLabelStyle)
}

// 监听地图的分辨率变化
map.value.getView().on('change:resolution', function() {
  // const resolution = map.value.getView().getResolution()
  // 缩放蓝色圆圈部分
  features.value.forEach((feature, idx) => {
    // if (idx % 2) { updateStyleBasedOnResolution(feature, resolution) }
  })
})
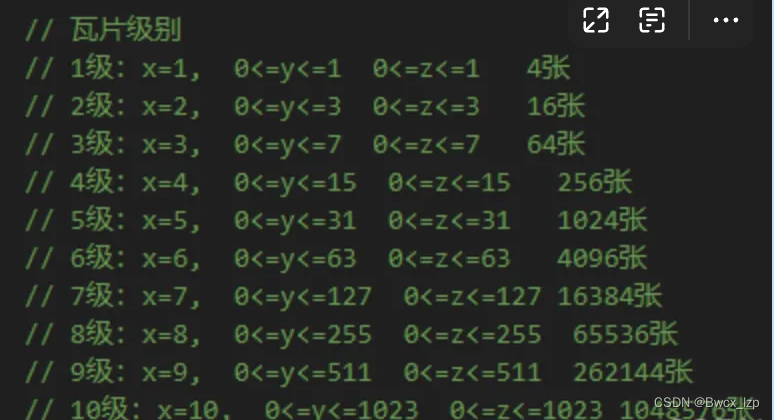
4. 离线瓦片部署
4.1 瓦片资源下载
一款极速瓦片地图下载器-tiler,支持mapbox矢量瓦片下载。支持谷歌影像、百度地图、高德、天地图、四维、OSM等瓦片地图下载,离线地图soeasy。
使用chatgpt写了个简单的node统计程序
const fs = require('fs');
const path = require('path');
const colors = require('ansi-colors');

function countJPGFilesInDirectory(directoryPath) {
    let count = 0;

    function traverseDirectory(currentPath) {
        const files = fs.readdirSync(currentPath);

        files.forEach((file, index) => {
            const filePath = path.join(currentPath, file);
            const stats = fs.statSync(filePath);

            if (stats.isDirectory()) {
                traverseDirectory(filePath);
            } else if (path.extname(file).toLowerCase() === '.jpg') {
                count++;
            }

            // 模拟延时效果
            setTimeout(() => {
                const progress = ((index + 1) / files.length * 100).toFixed(2);
                process.stdout.write(`\r${colors.blue('Progress:')} ${colors.green(`${progress}%`)}`);
            }, 50);
        });
    }

    traverseDirectory(directoryPath);

    return count;
}

const directoryPath = '../tianditu/9';
console.log(`Counting JPG files in ${colors.yellow(directoryPath)}...`);
const jpgCount = countJPGFilesInDirectory(directoryPath);
console.log(`\nTotal number of JPG files in ${colors.yellow(directoryPath)} and its subdirectories: ${colors.cyan(jpgCount)}`);
4.2 部署
-
本地node服务
在下载的瓦片文件目录下
安装
npm i http-server -g启动(–cors 解决地图资源跨域)
http-server --cors -
nginx代理
user  nginx;
worker_processes  auto;

error_log  /var/log/nginx/error.log notice;
pid        /var/run/nginx.pid;

events {
    worker_connections  1024;
}

http {
    include       /etc/nginx/mime.types;
    default_type  application/octet-stream;

    log_format  main  '$remote_addr - $remote_user [$time_local] "$request" '
                      '$status $body_bytes_sent "$http_referer" '
                      '"$http_user_agent" "$http_x_forwarded_for"';

    access_log  /var/log/nginx/access.log  main;

    sendfile        on;
    #tcp_nopush     on;

    keepalive_timeout  65;

    #gzip  on;

    server {
        listen 80;
        server_name localhost;

        root /usr/share/nginx/html/tianditu/;
        index index.html;

        location / {
            try_files $uri $uri/ =404;
        }

        location ~* ^/(?<category>[^/]+)/(?<subcategory>[^/]+)/(?<image>[^/]+)$ {
            alias /usr/share/nginx/html/tianditu/$category/$subcategory/$image;
        }
    }

}
4.3 使用
const mapUrl = ref(
   'http://127.0.0.1:8080' + '/{z}/{x}/{y}.jpg'
)


 1549
1549


 被折叠的 条评论
为什么被折叠?
被折叠的 条评论
为什么被折叠?
 到【灌水乐园】发言


