


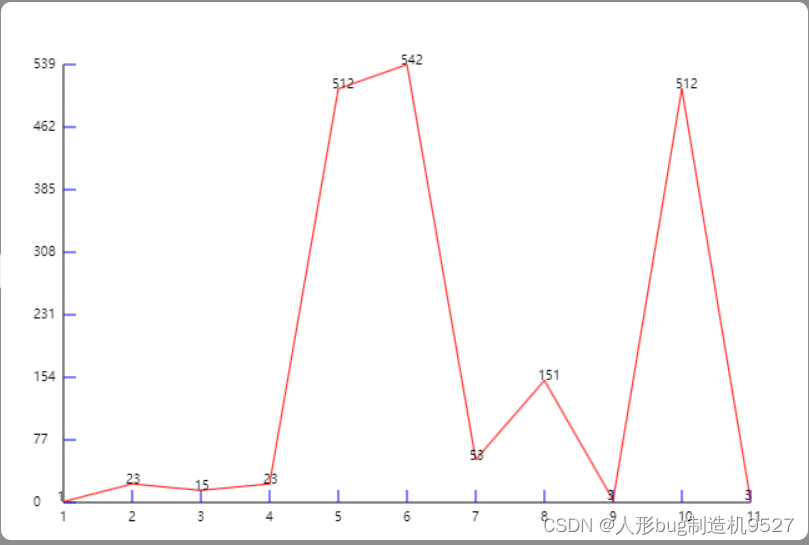
要求x轴根据数据长度自适应
y轴根据数据最大值取长度值
<template>
  <div ref="cvsContainer" class="cvs-container">
    <canvas ref="cvs" class="canvas"></canvas>
  </div>
</template>

<script setup>
import {computed, defineProps, onMounted, ref} from "vue";

onMounted(() => {
  initLine()
})

const data = defineProps({
  list: {
    type: Array,
    default: () => [1,2,3,4,5,6,7,8,9,10]
  }
});

const max = computed(() => {
  return Math.max(...data.list)
})
console.log(max.value)
const dataSize = computed(() => {
  return data.list.length
})
console.log(dataSize.value)

const cvs = ref(null);
const cvsContainer = ref(null);
const initLine = () => {
  const container = cvsContainer.value
  const width = container.offsetWidth
  const height = container.offsetHeight
  cvs.value.width = width
  cvs.value.height = height
  const ctx = cvs.value.getContext('2d')
  ctx.beginPath()
  ctx.moveTo(50, 50)
  ctx.lineTo(50, 400)
  ctx.lineTo(600, 400)
  ctx.stroke()

  // 画x刻度
  // x轴总长550,我们用数据总长度计算出每个刻度要画多长,这里刻度数量=数据长度,例如10cm想要分成2个刻度,那就是开头和结束两个刻度,就等于10个要分成一段也就是10/(2-1)
  const xScale = 550 / (dataSize.value-1);
  for (let i = 1; i <= dataSize.value; i++) {
    ctx.beginPath()
    ctx.strokeStyle = 'blue'
    ctx.lineWidth = 1
    ctx.moveTo(50 + i * xScale, 400)
    ctx.lineTo(50 + i * xScale, 390)
    ctx.stroke()
    ctx.fillText(i, 47 + (i-1) * xScale, 415,)
  }

  // 画y刻度
  // (我们只显示7个y轴刻度)我们计算出最大值分成7份每份有多长
  const yScale = (max.value / 7).toFixed(0);
  console.log('yScale', yScale)
  for (let i = 0; i <= 7; i++) {
    ctx.beginPath()
    ctx.strokeStyle = 'blue'
    ctx.lineWidth = 1
    ctx.moveTo(50, 400 - i * 50)
    ctx.lineTo(60, 400 - i * 50)
    ctx.stroke()
    ctx.fillText(i * yScale, 50 - max.value.toString().length * 8, 403 - i * 50,)
  }

  //  画折线
  for (let i = 0; i < data.list.length; i++) {
    setTimeout(() => {
      ctx.beginPath()
      ctx.strokeStyle = 'red'
      ctx.lineWidth = 1
      ctx.moveTo(50 + i * xScale, 400 - data.list[i] * 350 / max.value)
      ctx.lineTo(50 + (i + 1) * xScale, 400 - data.list[i + 1] * 350 / max.value)
      ctx.stroke()
      ctx.fillText(data.list[i], 45 + i * xScale, 400 - data.list[i] * 350 / max.value,)
    }, 500 / data.list.length * i)
  }
}
</script>

<style lang="scss" scoped>
.cvs-container {
  width: 1200px;
  height: 800px;
  background-color: white;
  border-radius: 15px;

  .canvas {

  }
}

</style>
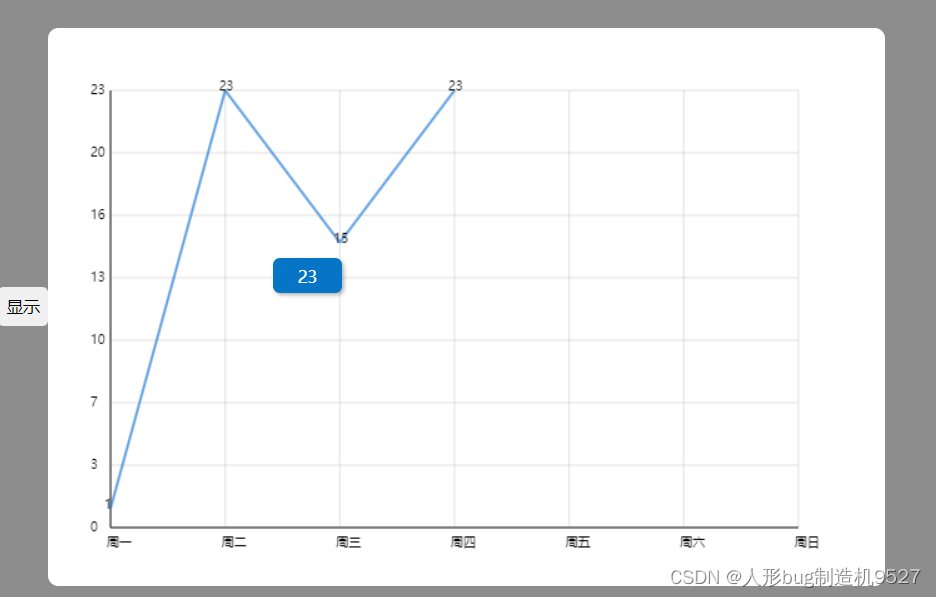
增加了鼠标移动的数值提示框
<template>
  <div ref="cvsContainer" class="cvs-container">
    <canvas ref="cvs" class="canvas"></canvas>
    <div v-show="pageData.pointerShow" class="pointer" :style="`left:${pageData.pointerX}px;top: ${pageData.pointerY}px;`">
      {{pageData.pointer}}
    </div>
  </div>
</template>

<script setup>
import {computed, defineProps, onMounted, reactive, ref} from "vue";

onMounted(() => {
  initLine()
})

const data = defineProps({
  list: {
    type: Array,
    default: () => [1, 2, 3, 4, 5, 6, 7, 8, 9, 10]
  },
  xAxios: {
    type: Array,
    default: () => [1, 2, 3, 4, 5, 6, 7, 8, 9, 10]
  }
});

const pageData = reactive({
  pointer:0,
  pointerX:0,
  pointerY:0,
  pointerShow:false
});

const max = computed(() => {
  return Math.max(...data.list)
})
console.log(max.value)


const cvs = ref(null);
const cvsContainer = ref(null);
const initLine = () => {
  const container = cvsContainer.value
  const width = container.offsetWidth
  const height = container.offsetHeight
  cvs.value.width = width
  cvs.value.height = height
  const ctx = cvs.value.getContext('2d')
  ctx.beginPath()
  ctx.moveTo(50, 50)
  ctx.lineTo(50, 400)
  ctx.lineTo(600, 400)
  ctx.stroke()

  // 画x刻度
  // x轴总长550,我们用数据总长度计算出每个刻度要画多长,这里刻度数量=数据长度,例如10cm想要分成2个刻度,那就是开头和结束两个刻度,就等于10个要分成一段也就是10/(2-1)
  const xScale = 550 / (data.xAxios.length - 1);
  for (let i = 0; i < data.xAxios.length; i++) {
    ctx.beginPath()
    ctx.strokeStyle = '#66666666'
    ctx.lineWidth = 0.5
    ctx.moveTo(50 + i * xScale, 400)
    ctx.lineTo(50 + i * xScale, 50)
    ctx.stroke()
    ctx.fillText(data.xAxios[i], 47 + i * xScale, 415,)
  }

  // 画y刻度
  // (我们只显示7个y轴刻度)我们计算出最大值分成7份每份有多长
  const yScale = (max.value / 7);
  console.log('yScale', yScale)
  for (let i = 0; i <= 7; i++) {
    ctx.beginPath()
    ctx.strokeStyle = '#66666666'
    ctx.lineWidth = 0.5
    ctx.moveTo(50, 400 - i * 50)
    ctx.lineTo(600, 400 - i * 50)
    ctx.stroke()
    ctx.fillText((i * yScale).toFixed(0), 50 - max.value.toString().length * 8, 403 - i * 50,)
  }

  //  画折线
  for (let i = 0; i < data.list.length; i++) {
    // 这里使用定时器渲染,模拟动画
    setTimeout(() => {
      ctx.beginPath()
      ctx.strokeStyle = 'rgba(31,121,211,.7)'
      ctx.lineWidth = 2
      ctx.moveTo(50 + i * xScale, 400 - data.list[i] * 350 / max.value)
      ctx.lineTo(50 + (i + 1) * xScale, 400 - data.list[i + 1] * 350 / max.value)
      ctx.stroke()
      // 字体颜色
      ctx.fillText(data.list[i], 45 + i * xScale, 400 - data.list[i] * 350 / max.value)
    }, 500 / data.list.length * i) // 渲染总时长/数据长度=每个数据渲染时长,使用定时器模拟动画
  }

  // 获取元素的边界信息
  const rect = cvs.value.getBoundingClientRect();
  // 绑定鼠标移动事件
  cvs.value.addEventListener('mousemove', (e) => {
    // 计算鼠标在元素内部的相对位置
    const x = e.clientX - rect.left;
    const y = e.clientY - rect.top;
    // 打印出相对位置
    if (x>50){
      const index = Math.round((x - 50) / xScale);
      // 四舍五入
      // 获取当前点的数据
      const value = data.list[index];
      // 更新提示框的值
      pageData.pointer = value
      pageData.pointerX=x+15
      pageData.pointerY=y+15
    }
  })
  cvs.value.addEventListener('mouseleave', () => {
    pageData.pointerShow = false;
  })
  cvs.value.addEventListener('mouseenter',()=>{
    pageData.pointerShow = true;
  })
}
</script>

<style lang="scss" scoped>
.cvs-container {
  width: 1200px;
  height: 800px;
  background-color: white;
  border-radius: 15px;
  position: relative;
  .canvas {

  }
  .pointer{
    position: absolute;
    width: 100px;
    height: 50px;
    font-size: 24px;
    border-radius: 10px;
    background-color: #0675c5;
    display: flex;
    justify-content: center;
    align-items: center;
    color: white;
    box-shadow: 3px 3px 6px  rgba(0, 0, 0, 0.3);
  }
}

</style>


 6911
6911

 被折叠的 条评论
为什么被折叠?
被折叠的 条评论
为什么被折叠?
 到【灌水乐园】发言


