


Spring boot结合ELK、kafka搭建日志框架
1. 在微服务架构中,各个模块相对分散,日志的维护进行统一维护会很方便,所以搭建统一的日志管理框架。
运行环境: *
win10、idea、springboot项目
Elk:(elasticsearch-6.2.2(以下简称es)、logstash-6.2.2、kibana-6.2.2-windows-x86_64)
Kafka: kafka_2.12-2.3.0*
2. 主体逻辑:
将日志传输到kafka中,logstash通过自己定义配置文件从kafka中获取日志数据,经过过滤匹配等操作,形成自己格式的日志输出到es中,配置输出的es中配置相应的index索引,运行kibana通过索引可以查看可视化的日志数据。
3. 将日志传输到kafka中
(1) pom文件中加入相关依赖
<dependency>
    <groupId>com.github.danielwegener</groupId>
    <artifactId>logback-kafka-appender</artifactId>
    <version>0.2.0-RC1</version>
</dependency>
<dependency>
    <groupId>ch.qos.logback</groupId>
    <artifactId>logback-classic</artifactId>
    <version>1.2.3</version>
</dependency>
<dependency>
    <groupId>ch.qos.logback</groupId>
    <artifactId>logback-core</artifactId>
    <version>1.2.3</version>
</dependency>
(2) 配置logback-spring.xml(系统默认名称)日志配置文件,也可自己定义其他名称(如:logback-spring-back.xml,须在bootstrap或application文件中加入配置)
#yml配置日志文件
logging:
  config: classpath:logback-spring-back.xml

#properties配置日志文件
logging.config=classpath:logback-spring-back.xml
Logback-spring.xml配置文件文件
<?xml version="1.0" encoding="UTF-8"?>
<!--
    小技巧: 在根pom里面设置统一存放路径,统一管理方便维护
    <properties>
        <log-path>/Users/aijm</log-path>
    </properties>
    1. 其他模块加日志输出,直接copy本文件放在resources 目录即可
    2. 注意修改 <property name="${log-path}/log.path" value=""/> 的value模块
-->
<configuration debug="false" scan="false">
    <conversionRule conversionWord="ip" converterClass="com.***.common.util.LogBackGetIP" />

<!--    以下四项值须在配置文件中对应配置-->
    <springProperty scop="context" name="spring.application.name" source="spring.application.name" defaultValue="s"/>
    <springProperty scop="context" name="logging.path" source="logging.path" defaultValue="E"/>
    <springProperty scop="context" name="kafka.server" source="kafka.server"/>
    <springProperty scop="context" name="kafka.topic" source="kafka.topic"/>

    <property name="log.path" value="${logging.path}${spring.application.name}" />
    <property name="kafka.topic" value="${kafka.topic}" />
    <!-- 彩色日志格式 -->
    <property name="CONSOLE_LOG_PATTERN"
              value="${spring.application.name} [%ip] ${CONSOLE_LOG_PATTERN:-%clr(%d{yyyy-MM-dd HH:mm:ss.SSS}){faint} %clr(${LOG_LEVEL_PATTERN:-%5p}) %clr(${PID:- }){magenta} %clr(---){faint} %clr([%15.15t]){faint} %clr(%-40.40logger{39}){cyan} %clr(:){faint} %m%n${LOG_EXCEPTION_CONVERSION_WORD:-%wEx}}"/>
    <!-- 彩色日志依赖的渲染类 -->
    <conversionRule conversionWord="clr" converterClass="org.springframework.boot.logging.logback.ColorConverter"/>
    <conversionRule conversionWord="wex"
                    converterClass="org.springframework.boot.logging.logback.WhitespaceThrowableProxyConverter"/>
    <conversionRule conversionWord="wEx"
                    converterClass="org.springframework.boot.logging.logback.ExtendedWhitespaceThrowableProxyConverter"/>
    <!-- Console log output -->
    <appender name="console" class="ch.qos.logback.core.ConsoleAppender">
        <encoder>
            <pattern>${CONSOLE_LOG_PATTERN}</pattern>
        </encoder>
    </appender>

      <!-- kafka的appender配置 -->
    <appender name="kafkaAppender" class="com.github.danielwegener.logback.kafka.KafkaAppender">
        <encoder class="ch.qos.logback.classic.encoder.PatternLayoutEncoder">
            <pattern>${spring.application.name} [%ip] %date %-5level --- [%thread] %logger{36} : %msg%n</pattern>
<!--            <pattern>${CONSOLE_LOG_PATTERN}</pattern>-->
<!--            <charset>GBK</charset>-->
            <charset>utf-8</charset>
        </encoder>
        <topic>${kafka.topic}</topic>
        <!-- we don't care how the log messages will be partitioned  -->
        <keyingStrategy class="com.github.danielwegener.logback.kafka.keying.NoKeyKeyingStrategy" />
        <!-- use async delivery. the application threads are not blocked by logging -->
        <deliveryStrategy class="com.github.danielwegener.logback.kafka.delivery.AsynchronousDeliveryStrategy" />

        <!-- each <producerConfig> translates to regular kafka-client config (format: key=value) -->
        <!-- producer configs are documented here: https://kafka.apache.org/documentation.html#newproducerconfigs -->
        <!-- bootstrap.servers is the only mandatory producerConfig -->
        <producerConfig>bootstrap.servers=${kafka.server}</producerConfig>
        <!-- don't wait for a broker to ack the reception of a batch.  -->
        <producerConfig>acks=0</producerConfig>
        <!-- wait up to 1000ms and collect log messages before sending them as a batch -->
        <producerConfig>linger.ms=1000</producerConfig>
        <!-- even if the producer buffer runs full, do not block the application but start to drop messages -->
        <producerConfig>max.block.ms=0</producerConfig>
        <!-- Optional parameter to use a fixed partition -->
        <!--<partition>8</partition>-->

    </appender>

    <!--nacos 心跳 INFO 屏蔽-->
    <logger name="com.alibaba.nacos" level="OFF">
        <appender-ref ref="console"/>
    </logger>
    <!-- Level: FATAL 0  ERROR 3  WARN 4  INFO 6  DEBUG 7 -->
    <root level="INFO">
        <appender-ref ref="kafkaAppender" />
        <appender-ref ref="console"/>
        <!--<appender-ref ref="debug"/>-->
    </root>
</configuration>
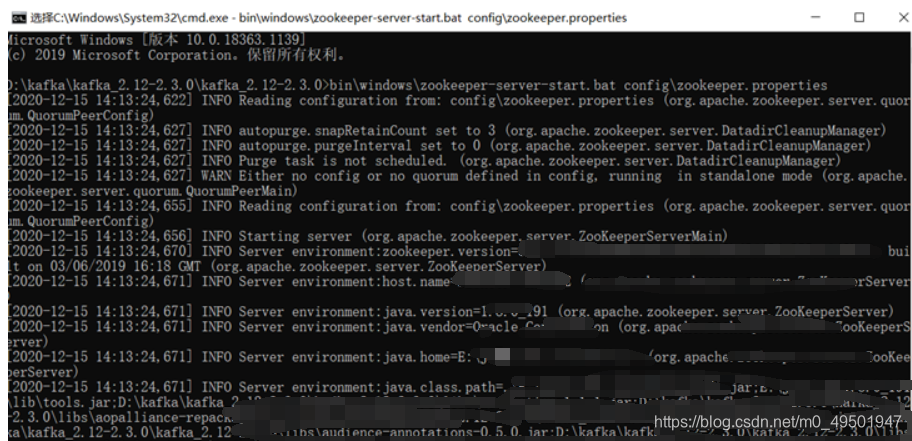
4. 开启kafka(开启kafka之前需要先开启zookeeper)
(1) kafka安装目录下cmd运行bin\windows\zookeeper-server-start.bat config\zookeeper.properties
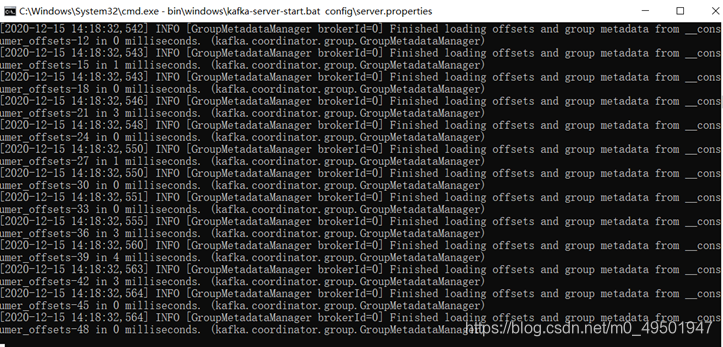
(2) 另开一个窗口运行bin\windows\kafka-server-start.bat config\server.properties
 (3)运行项目,项目控制台可看到日志(对应上面logback-spring.xml配置中的
<appender name="console"> 的配置)
(4) 运行kafaka消息查看命令查看kafka中的日志消息:bin\windows\kafka-console-consumer.bat --bootstrap-server localhost:9092 --topic Logs --from-beginning(Logs是topic名称,与上面logback-spring.xml配置的kafka中的参数对应)
至此,日志消息已传输至kafka中。
5. 配置logstash配置文件,将kafaka日志消息写进logstash并过滤输出至es中。
(1) 在logstash的安装文件夹下的config文件夹下创建test.conf文件(可自己命名),各自对应自己的服务端口号(9092默认kafka端口,9200默认es端口)
#输入
input{
  kafka{
      bootstrap_servers=>"127.0.0.1:9092"
    #   对应logback-spring.xml中配置的topic
      topics=>["Logs"]
      consumer_threads => 1
      decorate_events => true
      codec=>"plain"
      auto_offset_reset=>"latest"
  }
}
#过滤
filter{
    dissect {
        mapping => {
            "message" => "%{app} [%{clientip}] %{ts} %{+ts} %{level} %{PID} --- [%{tname}] %{func} : %{message}"
            }
    }

    mutate {
        remove_field => ["ts", "PID", "tname", "host", "type", "@version", "path"]
    }
}
#输出
output{

    elasticsearch{
        hosts=>["127.0.0.1:9200"]
        index=>"logstash-%{+YYYY.MM.dd}"
        codec=>json{
            charset=>"UTF-8"
        }
    }
    # stdout{codec=>rubydebug}
    stdout{codec=>json}
}
(2) 双击es安装目录下bin文件夹下的elasticsearch.bat文件运行es
(3)logstash文件夹下运行刚刚创建的配置文件:logstash-6.2.2>bin\logstash -f config\test.conf(会有点慢,等一会)出现消息日志,已经输出到es中。
6. 网页输入http://localhost:9200/logstash-2020.12.14/_search (9200是默认的es端口,logsatsh-2020.12.14对应test.conf中配置的index索引),可看到日志消息。
7. 双击kibana安装目录下的bin文件夹下的kibana.bat文件运行kibana,网页输入http://localhost:5601/(5601是kibana默认端口)可看到日志内容已通过kibana进行可视化展示。
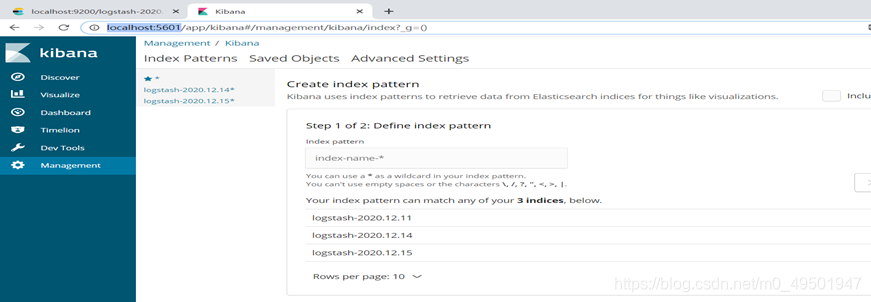
可创建相应的indexname方便查看,点击discover,选择自己想要查看的日志index;


 215
215


 被折叠的 条评论
为什么被折叠?
被折叠的 条评论
为什么被折叠?
 到【灌水乐园】发言


