


首先使用相应的matplotlib来操作,达到的效果是按钮可以控制是否显示某条线。
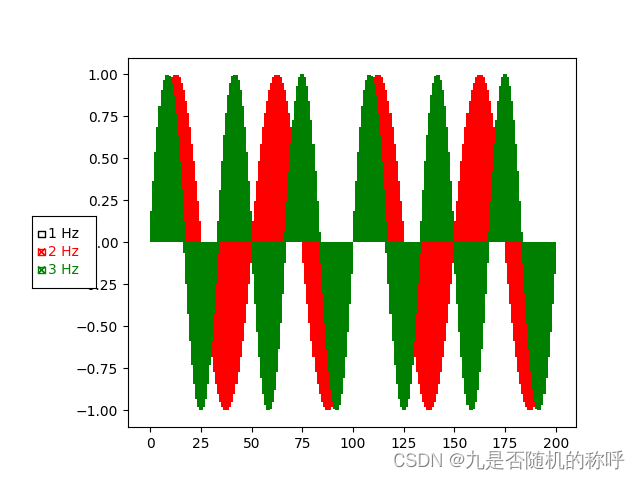
绘制bar图形的
import numpy as np
import matplotlib.pyplot as plt
from matplotlib.widgets import CheckButtons

t = np.arange(0.0, 2.0, 0.01)
s0 = np.sin(2*np.pi*t)
s1 = np.sin(4*np.pi*t)
s2 = np.sin(6*np.pi*t)

fig, ax = plt.subplots()

l0 = ax.bar(np.arange(len(t)), height=s0, width=2, color='black', label='1 Hz')
l1 = ax.bar(np.arange(len(t)), height=s1, width=2, color='red', label='2 Hz')
l2 = ax.bar(np.arange(len(t)), height=s2, width=2, color='green', label='3 Hz')

fig.subplots_adjust(left=0.2)

lines_by_label = {l.get_label(): l for l in [l0, l1, l2]}
line_colors = ['black', 'red', 'green']

rax = fig.add_axes([0.05, 0.4, 0.1, 0.15])

ret = [True, True, True]
col = [l0, l1, l2] #, l1, l2]
for i in range(len(col)):
    for j in col[i]:
        ret[i] = ret[i] & j.get_visible()

check = CheckButtons(
    ax=rax,
    labels = lines_by_label.keys(),
    actives = ret,
    label_props={'color': line_colors},
    frame_props={'edgecolor': line_colors},
    check_props={'facecolor': line_colors},
)

def callback(label):
    ln = lines_by_label[label]
    for j in ln:
        j.set_visible(not j.get_visible())
        j.figure.canvas.draw_idle()

check.on_clicked(callback)
plt.show()
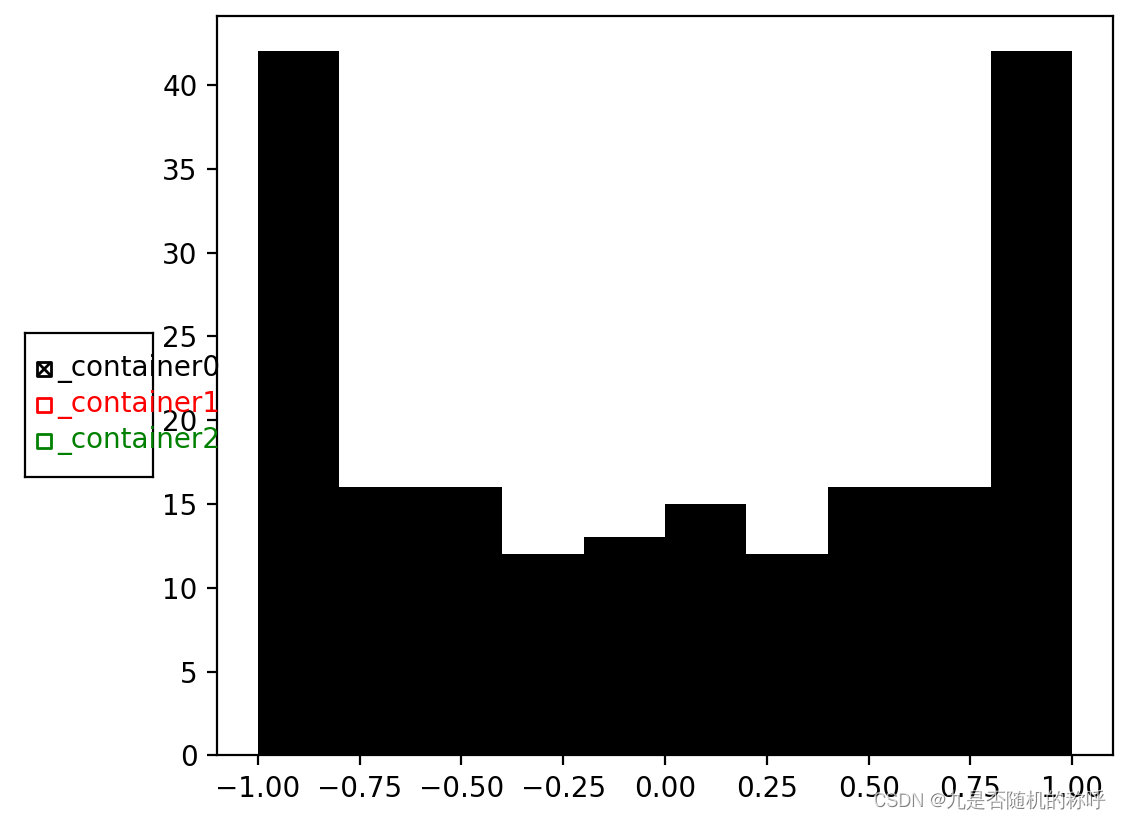
绘制直方图的
import numpy as np
import matplotlib.pyplot as plt
from matplotlib.widgets import CheckButtons

t = np.arange(0.0, 2.0, 0.01)
s0 = np.sin(2*np.pi*t)
s1 = np.sin(4*np.pi*t)
s2 = np.sin(6*np.pi*t)

fig, ax = plt.subplots()

_, __, l0 = ax.hist(s0, bins=10, color='black', label='1 Hz')
_, __, l1 = ax.hist(s1, bins=10, color='red', label='2 Hz')
_, __, l2 = ax.hist(s2, bins=30, color='green', label='3 Hz')

fig.subplots_adjust(left=0.2)

lines_by_label = {l.get_label(): l for l in [l0, l1, l2]}
line_colors = ['black', 'red', 'green']

rax = fig.add_axes([0.05, 0.4, 0.1, 0.15])

ret = [True, True, True]
col = [l0, l1, l2] #, l1, l2]
for i in range(len(col)):
    for j in col[i]:
        ret[i] = ret[i] & j.get_visible()

check = CheckButtons(
    ax=rax,
    labels = lines_by_label.keys(),
    actives = ret,
    label_props={'color': line_colors},
    frame_props={'edgecolor': line_colors},
    check_props={'facecolor': line_colors},
)

def callback(label):
    ln = lines_by_label[label]
    for j in ln:
        j.set_visible(not j.get_visible())
        j.figure.canvas.draw_idle()

check.on_clicked(callback)
plt.show()
绘制散点图的
import numpy as np
import matplotlib.pyplot as plt
from matplotlib.widgets import CheckButtons

t = np.arange(0.0, 2.0, 0.01)
s0 = np.sin(2*np.pi*t)
s1 = np.sin(4*np.pi*t)
s2 = np.sin(6*np.pi*t)

fig, ax = plt.subplots()
l0 = ax.scatter(t, s0, visible=False, lw=2, color='black', label='1 Hz')
l1 = ax.scatter(t, s1, lw=2, color='red', label='2 Hz')
l2 = ax.scatter(t, s2, lw=2, color='green', label='3 Hz')
fig.subplots_adjust(left=0.2)

lines_by_label = {l.get_label(): l for l in [l0, l1, l2]}
line_colors = ['black', 'red', 'green']

# Make checkbuttons with all plotted lines with correct visibility
rax = fig.add_axes([0.05, 0.4, 0.1, 0.15])
check = CheckButtons(
    ax=rax,
    labels=lines_by_label.keys(),
    actives=[l.get_visible() for l in lines_by_label.values()],
    label_props={'color': line_colors},
    frame_props={'edgecolor': line_colors},
    check_props={'facecolor': line_colors},
)
def callback(label):
    ln = lines_by_label[label]
    ln.set_visible(not ln.get_visible())
    ln.figure.canvas.draw_idle()

check.on_clicked(callback)
plt.show()


 被折叠的 条评论
为什么被折叠?
被折叠的 条评论
为什么被折叠?
 到【灌水乐园】发言


