


初步查看es集群状态
curl -XGET http://192.168.1.20:9200/_cluster/health?pretty
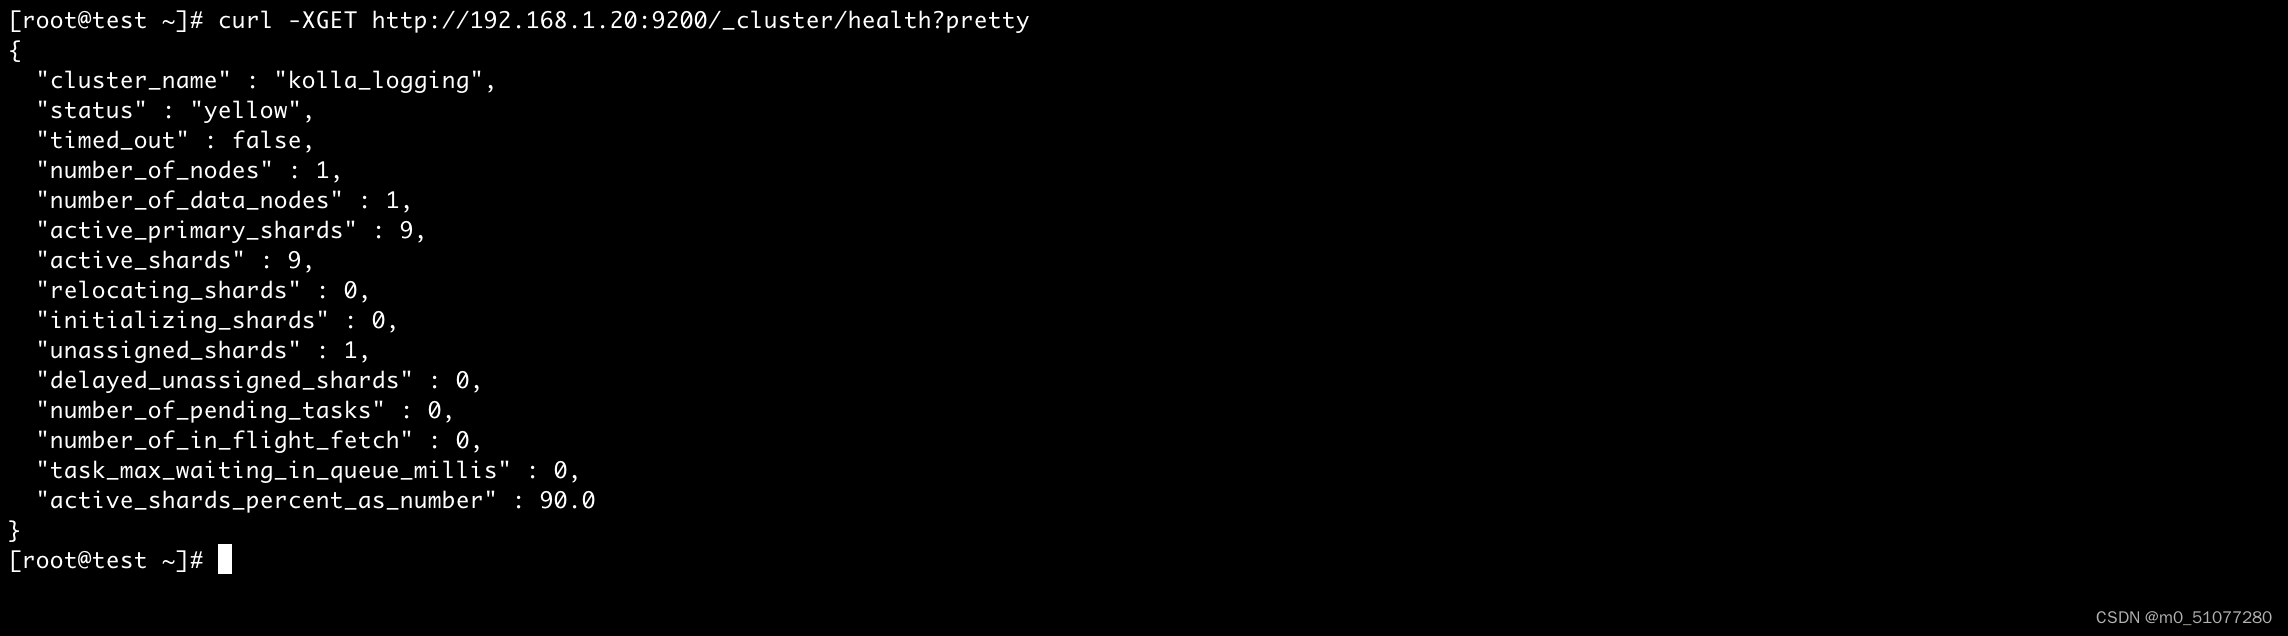
{
  "cluster_name" : "kolla_logging",
  "status" : "yellow",
   ( 集群的运行状况,基于其主要和副本分片的状态。
      – green所有分片均已分配。
      – yellow所有主分片均已分配,但未分配一个或多个副本分片。如果集群中某个节点发生故障,
      则在修复该节点之前,某些数据可能不可用。
      – red未分配一个或多个主分片,因此某些数据不可用。)
  "timed_out" : false,
  "number_of_nodes" : 1,   (集群中的节点数)
  "number_of_data_nodes" : 1,  (作为专用数据节点的节点数)
  "active_primary_shards" : 9,    (活动主分区的数量)
  "active_shards" : 9,    (活动主分区和副本分区的总数)
  "relocating_shards" : 0,
  "initializing_shards" : 0,    (正在初始化的分片数)
  "unassigned_shards" : 1,    (未分配的分片数)
  "delayed_unassigned_shards" : 0,
  "number_of_pending_tasks" : 0,
  "number_of_in_flight_fetch" : 0,
  "task_max_waiting_in_queue_millis" : 0,
  "active_shards_percent_as_number" : 90.0  (集群中活动碎片的比率,以百分比表示)
}
# 以 json 的方式显示集群具体的异常信息
curl -XGET http://192.168.1.20:9200/_cluster/allocation/explain |python3 -m json.tool
报错显示 “allocate_explanation”: “cannot allocate because allocation is not permitted to any of the nodes”
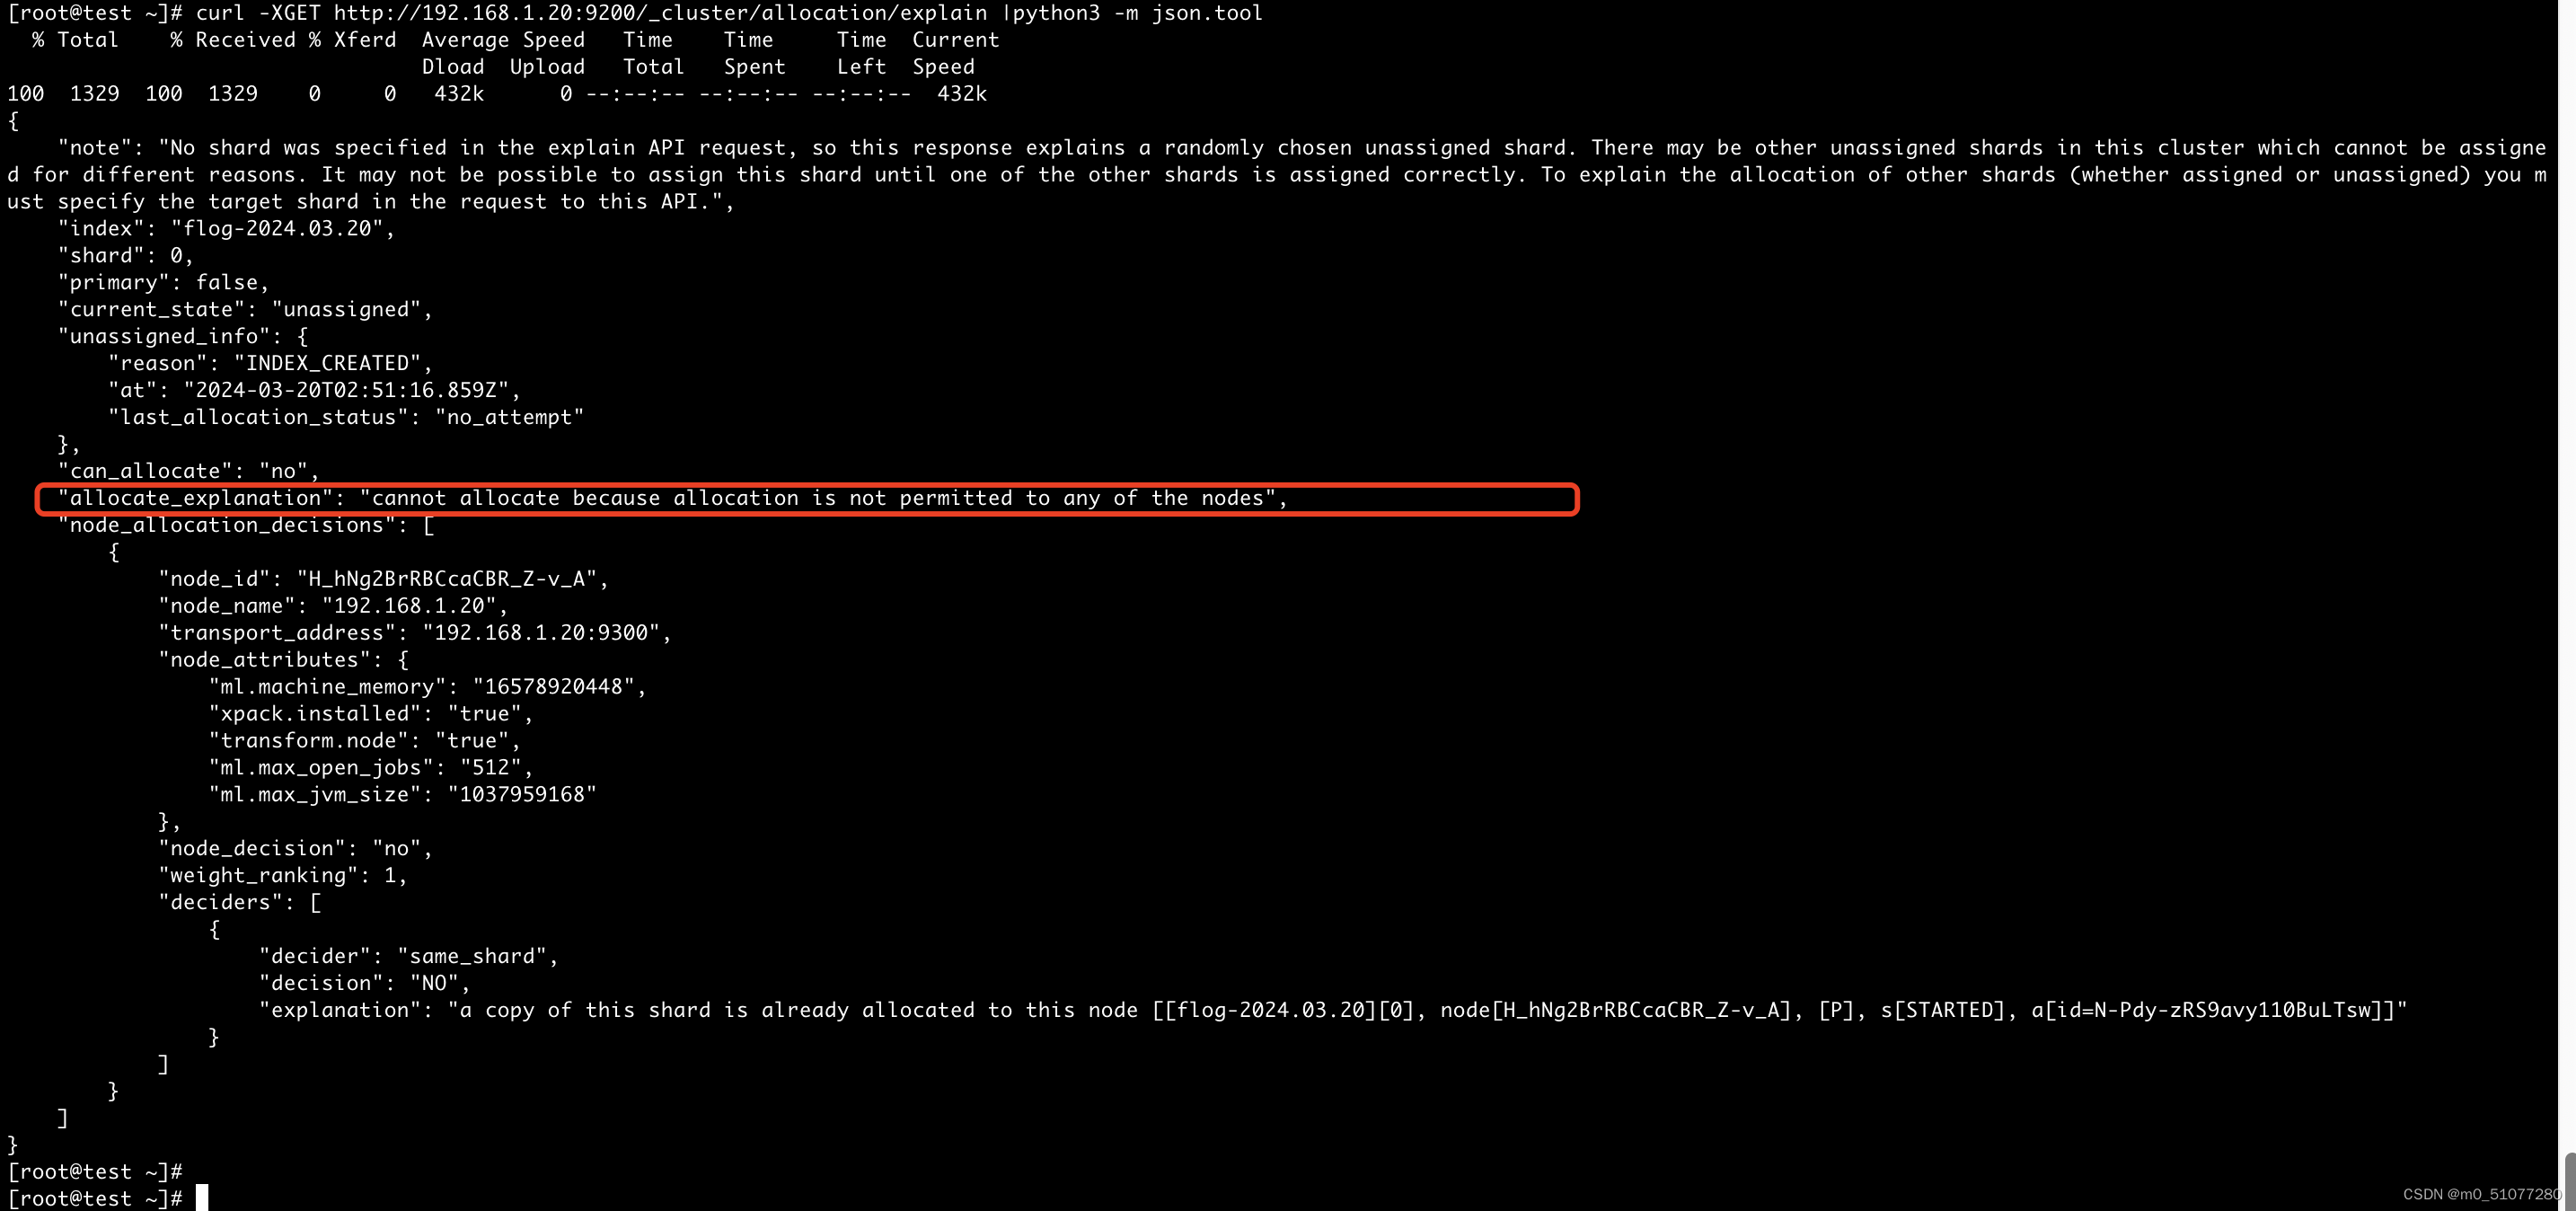
当集群状态异常时,同时需要重点关注unassigned_shards没有正常分配的分片,查看集群状态可知存在一个未分配的分片数
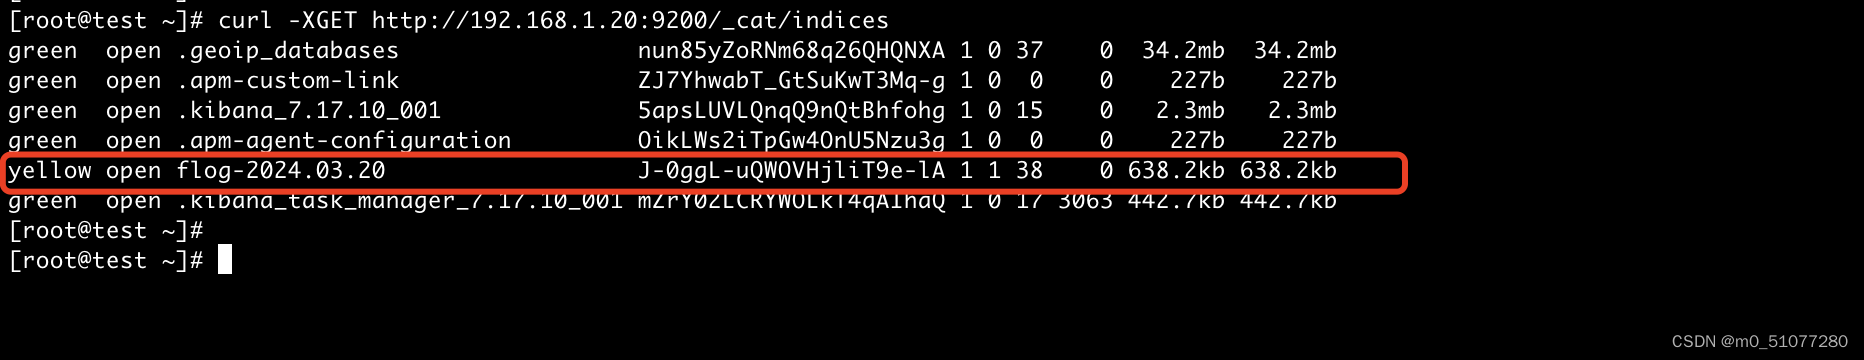
# 查看索引情况,并根据返回找到状态异常的索引
curl -XGET http://192.168.1.20:9200/_cat/indices
查看索引设置
curl -XGET http://192.168.1.20:9200/flog-2024.03.20/_settings
关注 “number_of_replicas” : “1” 代表此处的副本分片的大小。此处假设 number_of_replicas的数量为1,则说明1个分片未分配
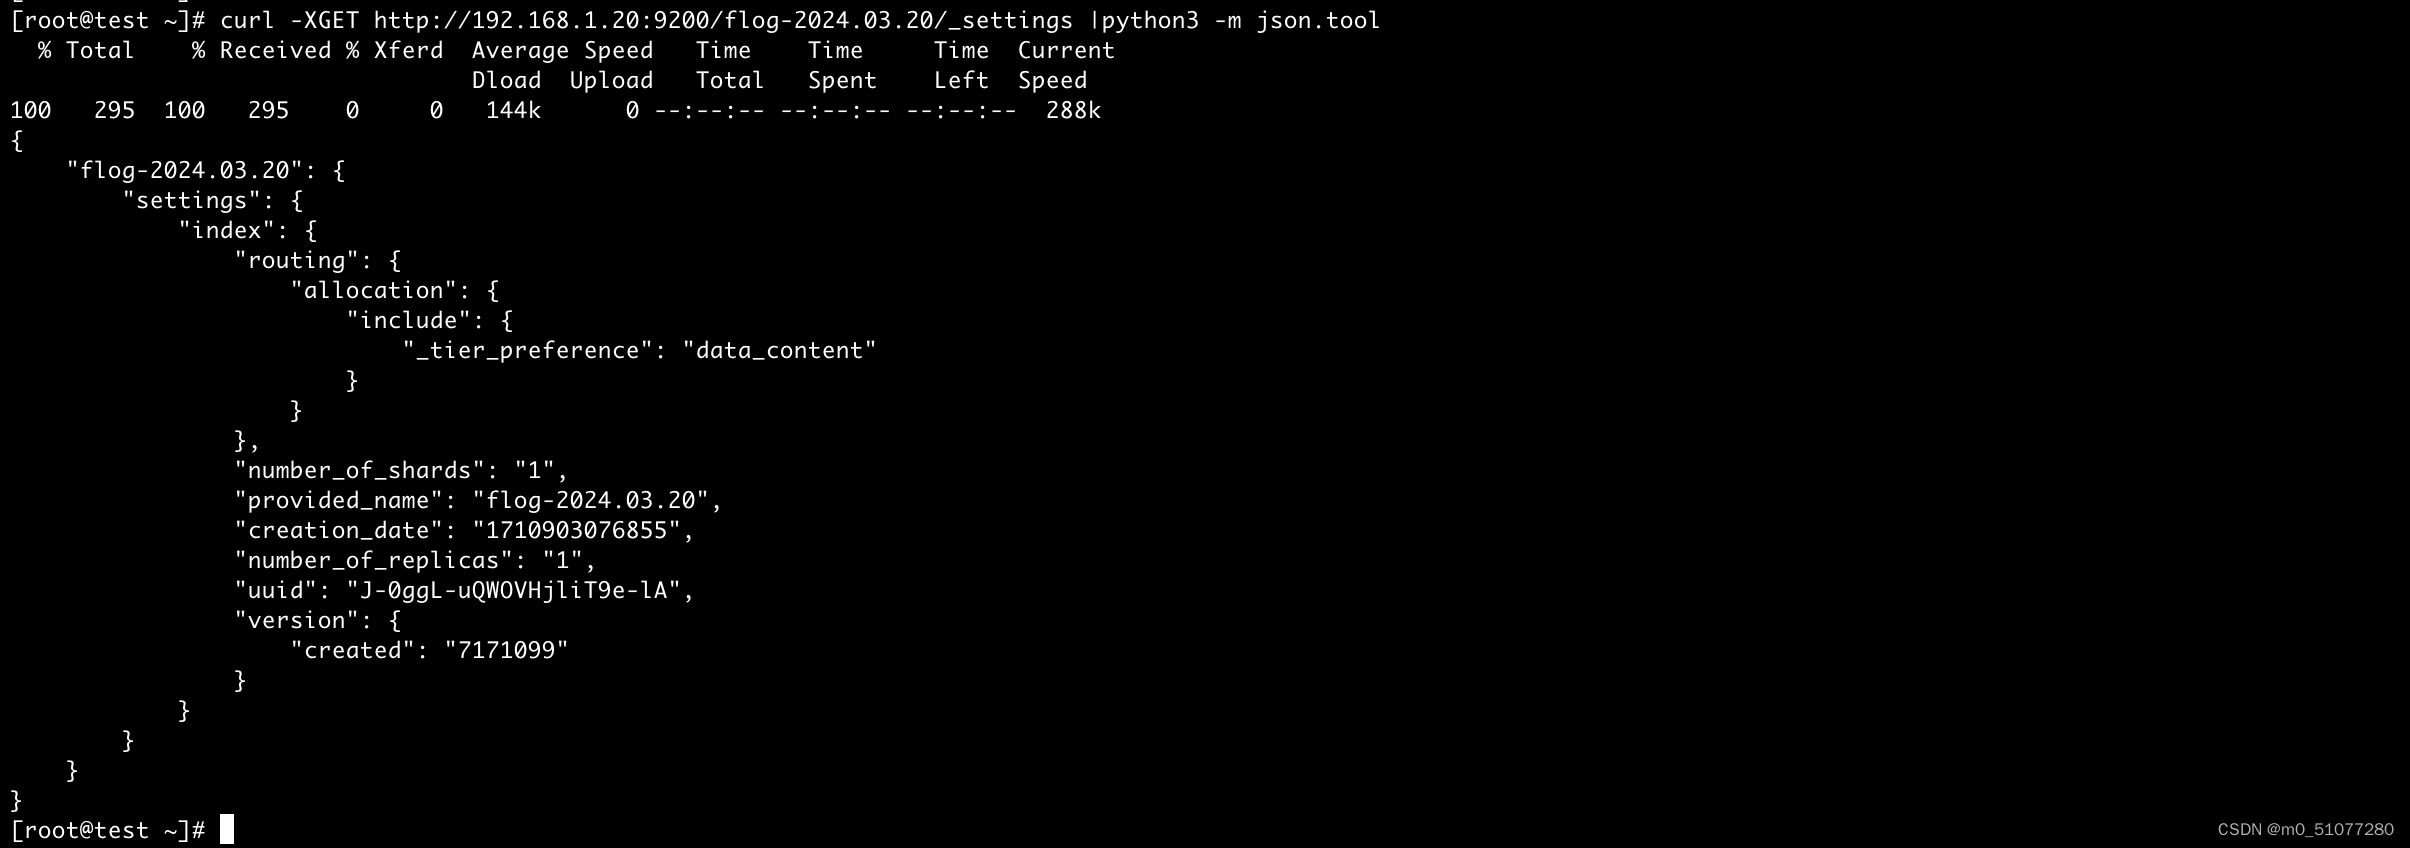
当副本数大于或等于数据节点数时,那么每个分片只能最多有 节点数量-1个副本,无法分配的副本数则为 主分片数x(副本数-(节点数-1))
例如:假设节点数为3,主分片数为5,副本数为3,那么无法分配的副本数则为:5*(3-(3-1))=5。
本环境的ES是单节点测试环境,则副本分片应为0,而yellow状态异常索引settings中,副本分片大小为1,因此此时只需要重新设置该索引副本分片数即可
[root@test ~]# curl -X PUT -H "Content-Type: application/json" -d '{"number_of_replicas":"0"}' 'http://192.168.1.20:9200/flog-2024.03.20/_settings'
{"acknowledged":true}
[root@test ~]#
[root@test ~]#
[root@test ~]# curl -XGET http://192.168.1.20:9200/flog-2024.03.20/_settings |python3 -m json.tool
  % Total    % Received % Xferd  Average Speed   Time    Time     Time  Current
                                 Dload  Upload   Total   Spent    Left  Speed
100   295  100   295    0     0   144k      0 --:--:-- --:--:-- --:--:--  144k
{
    "flog-2024.03.20": {
        "settings": {
            "index": {
                "routing": {
                    "allocation": {
                        "include": {
                            "_tier_preference": "data_content"
                        }
                    }
                },
                "number_of_shards": "1",
                "provided_name": "flog-2024.03.20",
                "creation_date": "1710903076855",
                "number_of_replicas": "0",
                "uuid": "J-0ggL-uQWOVHjliT9e-lA",
                "version": {
                    "created": "7171099"
                }
            }
        }
    }
}
[root@test ~]# curl -XGET http://192.168.1.20:9200/_cluster/health?pretty
{
  "cluster_name" : "kolla_logging",
  "status" : "green",
  "timed_out" : false,
  "number_of_nodes" : 1,
  "number_of_data_nodes" : 1,
  "active_primary_shards" : 9,
  "active_shards" : 9,
  "relocating_shards" : 0,
  "initializing_shards" : 0,
  "unassigned_shards" : 0,
  "delayed_unassigned_shards" : 0,
  "number_of_pending_tasks" : 0,
  "number_of_in_flight_fetch" : 0,
  "task_max_waiting_in_queue_millis" : 0,
  "active_shards_percent_as_number" : 100.0
}
删除异常索引
curl -X DELETE http://192.168.1.20:9200/flog-2024.03.20/
参考链接:
https://cloud.tencent.com/developer/article/1803943


 1万+
1万+


 被折叠的 条评论
为什么被折叠?
被折叠的 条评论
为什么被折叠?
 到【灌水乐园】发言


