


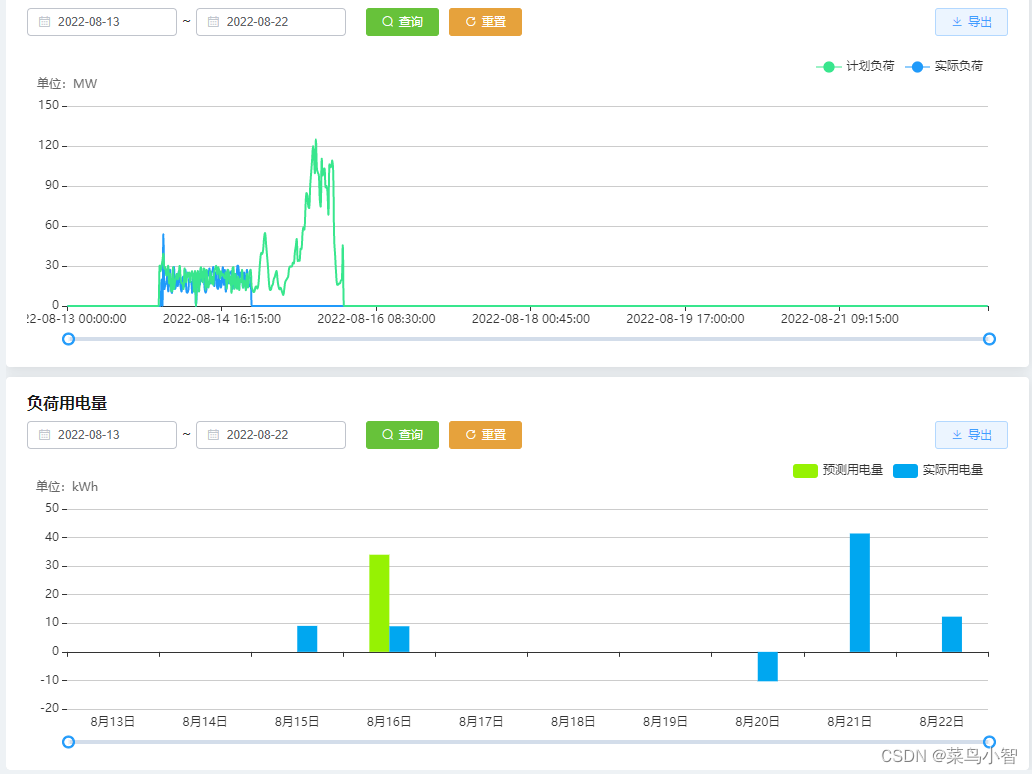
echarts 的显示方式有很多种现在看一种比较复杂的
如图所示,下方可一调整时间显示你想要的时间的就属于稍微的复杂的了 那么请看代码
1 写一个共用的 echarts 组件
<template>
	<div class="emptyChart" :id="optionID"></div>
</template>
<script>
export default {
	name: "emptyChart",
	props: ["optionID", "ops"],
	data() {
		return {
			myChart: null
		}
	},
	created() {},
	updated() {},
	mounted() {
		//定义一个图表方法在methods中调用
		this.emptyEcharts();
	},
	methods: {
		//图表方法
		emptyEcharts(opt) {
			this.myChart = this.$echarts.init(document.getElementById(this.optionID));
			let option = opt? opt:this.ops;
			this.myChart.setOption(option, true); //通过setOption()方法生成图表
			let _this = this;
			window.addEventListener("resize", function() {
				_this.myChart.resize(); //图表自适应的一个方法
			});
		},
		resize() {
			this.$nextTick(() => {
				this.myChart.resize();
			});
		},
	},
	computed: {}
};
</script>

<style scoped>
.emptyChart {
	width: 100%;
	height: 300px;
}
</style>
2.引入到组件
import EchartCom from "@/components/EchartCom";

export default {
  name: "historySearch",
  components: { EchartCom,},
 }
3.组建的 template 中的用法
<template>
	<div>
		<EchartCom "
            ref="loadPlan1"
            class="EchartCom"
            optionID="ii1"
            :ops="shortLoadPlanOpt1"
          ></EchartCom>
		<EchartCom
          ref="energyUseRef"
          optionID="energyUse"
          class="EchartCom"
          :ops="getEnergyUseOpt"
        >
        </EchartCom>
    </div>
</template>
<script>
//引入 封装的组件
import EchartCom from "@/components/EchartCom";
//引入封装的方法
import { chartUtil } from "@/libs/chartUtil.js";
export default {
  name: "historySearch",
  components: { leftTree, EchartCom, BlockTitle, },
  data() {
    return {
    //折线图的数据
      shortLoadPlanData1: {
        timeList: [],
        realDataList: [],
        predictedDataList: [],
        legendData:["计划负荷", "实际负荷"],
      },
		//柱状图的数据
      energyUseOptionData: [],
     }
    },
    created() {
	    this.loadEnergyUseSearch()
	    this.getFrontDayData()
	  },
	  computed: {
		// 折线图
    	shortLoadPlanOpt1() {
	      	let seriseData = [
	          {
	            name: "实际负荷",
	            type: "line",
	            symbol: "none",
	            smooth: true,
	            data: this.shortLoadPlanData1.realDataList,
	          },
	          {
	            name: "计划负荷",
	            type: "line",
	            smooth: true,
	            symbol: "none",
	            data: this.shortLoadPlanData1.predictedDataList,

	          },
	        ]
	      	let xData = this.shortLoadPlanData1.timeList
			let legendData = this.shortLoadPlanData1.legendData
			let dw = '单位:MW'
			let legendIconType = null
	      	let option = chartUtil.dataZoomOption(seriseData, xData, legendData, dw, legendIconType)
			return option
	    },
	    // 柱状图
	    getEnergyUseOpt() {
	      let dimensions = ["date", "预测用电量", "实际用电量"]
	      let source = this.energyUseOptionData
	      let options = chartUtil.bar10Option(dimensions, source)
	      return options
	    },
	},
	methods: {
		//折线图数据获取方法
		getFrontDayData() {
	       	//if (this.lineDate === "") {
		         //this.$message.error("请选择日期");
		         //return;
	       	//}
	       	//this.resform1.queryType = "1"
	       	// this.resform1.beginTime = this.lineDate
	        //this.resform1.endTime = this.lineDate
	        //这是借口  可以注释
	        //queryLoadData(this.resform1).then((res) => {
	          	//this.shortLoadPlanData1.predictedDataList = res.predictedDataList;
	          	//this.shortLoadPlanData1.timeList = res.timeList;
	          	//this.shortLoadPlanData1.realDataList = res.realDataList;
	          	//  绘制echarts
	          	this.$refs.loadPlan1.emptyEcharts(this.shortLoadPlanOpt1);
	        //});
        },
        // 柱状图数据获取方法
	    barData(){
	      //getLoadEnergyUse(this.form2).then((res) => {
	        //this.energyUseOptionData = res.returnList;
	        // 绘制echarts
	        this.$refs.energyUseRef.emptyEcharts(this.getEnergyUseOpt);
	      //});
	    },
	},
}
</script>
4.创建封装方法的 chartUtil.js 文件, 引入 到页面中,引入方式
import { chartUtil } from "@/libs/chartUtil.js";
chartUtil.js 文件
/*
* @Description: echart option 配置
* @Version: 2.0
* @Author: lh
* @Date: 2021-11-30 13:18:32
* @LastEditors: lh
* @LastEditTime: 2022-01-15 18:38:27
*/
import echarts from 'echarts'
export const chartUtil = {
colorList: [
'rgb(73,224,153)',
'rgb(32,154,250)',
'rgb(183,245,247)',
'rgb(0,204,223)',
'rgb(219,214,80)',
'rgb(35,165,251)',
'rgb(73,224,153)',
'rgb(81,244,155)',
'rgb(227,240,79)',
'rgb(75,240,255)',
'rgb(255,167,77)',
'rgb(254,73,73)',
'rgb(57,66,163)',
'rgb(255,105,42)',
'rgb(150,214,253)',
'rgb(173,24,153)',
'rgb(93,124,13)',
'rgb(113,24,13)',
'rgb(173,124,13)',
'rgb(209,224,53)',
'rgb(73,24,103)'
],
pieChart: function(unit) {
let option = {
tooltip: {
trigger: 'item',
formatter: '{b} : {d}%<br/> {c} ' + unit
},
grid: {
left: 0,
right: 0,
top: 0,
bottom: 0
},
legend: {
show: true,
type: 'scroll',
orient: 'vertical',
// itemGap: 100,
left: '5%',
textStyle: {
color: '#999',
fontSize: 12
}
},
series: []
}
return option
},
chart_legendTop: function(yAxisName, toolbox = { show: false }) {
let option = {
tooltip: {
trigger: 'axis',
textStyle: {
align: 'left'
},
axisPointer: {
type: 'line'
}
},
legend: {
show: true,
type: 'scroll',
itemGap: 100,
top: '2%',
left: 'center',
textStyle: {
color: '#999',
fontSize: 12
}
},
dataZoom: [
{
type: 'slider',
show: false,
start: 0,
end: 100
}
],
toolbox: toolbox,
grid: {
top: '25%',
right: '5%',
left: '5%',
bottom: '15%'
},
xAxis: [
{
type: 'category',
data: [],
axisLine: {
lineStyle: {
color: '#999',
// color: '#fff',
fontSize: 12
}
},
axisLabel: {
margin: 10,
// interval: 0,
// rotate: 1,
color: '#999',
align: 'center',
textStyle: {
fontSize: 14
}
}
},
{
type: 'category',
data: [],
position: 'top',
show: false,
axisLine: {
lineStyle: {
color: '#999',
// color: '#fff',
fontSize: 12
}
},
axisLabel: {
margin: 10,
// interval: 0,
// rotate: 1,
color: '#999',
align: 'center',
textStyle: {
fontSize: 14
}
}
}
],
yAxis: [
{
type: 'value',
name: yAxisName,
splitNumber: 5,
axisLabel: {
formatter: '{value}',
color: '#999'
},
axisLine: {
show: true,
lineStyle: {
// color: 'rgba(255,255,255,0.12)'
color: '#999'
}
},
splitLine: {
show: true,
lineStyle: {
color: '#999'
}
}
},
{
position: 'right',
show: false,
type: 'value',
name: yAxisName,
splitNumber: 5,
axisLabel: {
formatter: '{value}',
color: '#999'
},
axisLine: {
show: true,
lineStyle: {
// color: 'rgba(255,255,255,0.12)'
color: '#999'
}
},
splitLine: {
show: true,
lineStyle: {
color: '#999'
}
}
}
],
series: []
}
return option
},
barChart2: function() {
let option = {
tooltip: {
trigger: 'axis',
textStyle: {
align: 'left'
},
axisPointer: {
type: 'none'
}
},
legend: {
show: true,
itemGap: 100,
left: '2%',
textStyle: {
color: '#FFFFFF',
fontSize: 12
}
},
grid: {
top: '15%',
right: '9%',
left: '13%',
bottom: '15%'
},
xAxis: [
{
type: 'category',
data: [],
axisLine: {
lineStyle: {
// color: 'rgba(255,255,255,0.12)',
color: '#fff',
fontSize: 12
}
},
axisLabel: {
margin: 10,
interval: 0,
rotate: 1,
color: '#e2e9ff',
align: 'center',
textStyle: {
fontSize: 14
}
}
}
],
yAxis: [
{
splitNumber: 5,
axisLabel: {
formatter: '{value}',
color: '#e2e9ff'
},
axisLine: {
show: true,
lineStyle: {
// color: 'rgba(255,255,255,0.12)'
color: '#fff'
}
},
splitLine: {
show: true,
lineStyle: {
color: '#233e64'
}
}
},
{
splitNumber: 3,
axisLabel: {
formatter: '{value}',
color: '#e2e9ff'
},
axisLine: {
show: true,
lineStyle: {
// color: 'rgba(255,255,255,0.12)'
color: '#fff'
}
},
splitLine: {
show: false,
lineStyle: {
color: '#233e64'
}
}
}
],
series: [
{
name: 'CO2当量(吨)',
type: 'bar',
data: [],
barWidth: '10px',
yAxisIndex: 0,
itemStyle: {
normal: {
color: new echarts.graphic.LinearGradient(
0,
0,
0,
1,
[
{
offset: 0,
color: 'rgba(245,237,181,1)' // 0% 处的颜色
},
{
offset: 1,
color: 'rgba(242,210,4,1)' // 100% 处的颜色
}
],
false
),
barBorderRadius: [30, 30, 3, 3],
shadowColor: 'rgba(0,160,221,1)',
shadowBlur: 4
}
}
},
{
name: '环比',
type: 'line',
symbolSize: 0,
symbol: 'circle',
yAxisIndex: 1,
itemStyle: {
normal: {
color: 'rgba(255, 196, 53, 1)',
barBorderRadius: 0
}
},
lineStyle: {
normal: {
width: 2,
color: {
type: 'linear',
x: 0,
y: 0,
x2: 0,
y2: 1,
colorStops: [
{
offset: 0,
color: '#F0B62A' // 0% 处的颜色
},
{
offset: 0.45,
color: '#FFC12B' // 45% 处的颜色
},
{
offset: 0.85,
color: '#FFC12B' // 85% 处的颜色
},
{
offset: 1,
color: '#FFC12B' // 100% 处的颜色
}
],
global: false // 缺省为 false
}
}
},
data: []
}
]
}
return option
},
moreLineChart: function() {
let option = {
tooltip: {
trigger: 'axis',
axisPointer: {
lineStyle: {
color: '#57617B'
}
}
},
legend: {
icon: 'rect',
itemWidth: 14,
itemHeight: 5,
itemGap: 25,
data: [],
left: '4%',
textStyle: {
fontSize: 12,
color: '#999'
}
},
grid: {
left: '3%',
top: '15%',
right: '6%',
bottom: '7%',
containLabel: true
},
xAxis: [
{
type: 'category',
boundaryGap: false,
align: 'center',
axisLine: {
lineStyle: {
color: '#fff',
fontSize: 12
}
},
data: []
}
],
yAxis: [
{
type: 'value',
// name: '单位(%)',
scale: true,
axisTick: {
show: false
},
axisLine: {
lineStyle: {
color: '#fff',
fontSize: 12
}
},
axisLabel: {
margin: 10,
textStyle: {
fontSize: 12
}
},
splitLine: {
show: false,
lineStyle: {
color: '#57617B'
}
}
},
{
type: 'value',
// name: '单位(%)',
scale: true,
axisTick: {
show: false
},
axisLine: {
lineStyle: {
color: '#fff',
fontSize: 12
}
},
axisLabel: {
margin: 10,
textStyle: {
fontSize: 12
}
},
splitLine: {
lineStyle: {
color: '#57617B'
}
}
}
],
series: [
{
name: '碳资产价值(万元)',
type: 'line',
smooth: true,
symbol: 'circle',
yAxisIndex: 0,
symbolSize: 5,
showSymbol: false,
lineStyle: {
normal: {
width: 1,
color: 'rgba(162, 204, 70, 1)'
}
},
areaStyle: {
normal: {
color: new echarts.graphic.LinearGradient(
0,
0,
0,
1,
[
{
offset: 0,
color: 'rgba(162, 204, 70, 0.8)'
},
{
offset: 0.8,
color: 'rgba(162, 204, 70, 0.3)'
}
],
false
),
shadowColor: 'rgba(0, 0, 0, 0.1)',
shadowBlur: 10
}
},
itemStyle: {
normal: {
color: 'rgb(137,189,27)',
borderColor: 'rgba(137,189,2,0.27)',
borderWidth: 12
}
},
data: []
},
{
name: 'CCER市场价格',
type: 'line',
smooth: true,
yAxisIndex: 1,
symbol: 'circle',
symbolSize: 5,
showSymbol: false,
lineStyle: {
normal: {
width: 1,
color: 'rgba(0, 103, 218,1)'
}
},
areaStyle: {
normal: {
color: new echarts.graphic.LinearGradient(
0,
0,
0,
1,
[
{
offset: 0,
color: 'rgba(0, 103, 218, 0.8)'
},
{
offset: 0.8,
color: 'rgba(0, 103, 218, 0.3)'
}
],
false
),
shadowColor: 'rgba(0, 0, 0, 0.1)',
shadowBlur: 10
}
},
itemStyle: {
normal: {
color: 'rgb(0,136,212)',
borderColor: 'rgba(0,136,212,0.2)',
borderWidth: 12
}
},
data: []
},
{
name: 'CEA市场价格',
type: 'line',
smooth: true,
symbol: 'circle',
symbolSize: 5,
yAxisIndex: 1,
showSymbol: false,
lineStyle: {
normal: {
width: 1
}
},
areaStyle: {
normal: {
color: new echarts.graphic.LinearGradient(
0,
0,
0,
1,
[
{
offset: 0,
color: 'rgba(242, 210, 7, 0.8)'
},
{
offset: 0.8,
color: 'rgba(242, 210, 7, 0.3)'
}
],
false
),
shadowColor: 'rgba(0, 0, 0, 0.1)',
shadowBlur: 10
}
},
itemStyle: {
normal: {
color: 'rgb(242, 210, 7)',
borderColor: 'rgba(242, 210, 7,0.2)',
borderWidth: 12
}
},
data: []
}
]
}
return option
},
morePieChart: function() {
let colors = ['#FF9532', '#FF375F', '#6BBFFF']
let option = {
legend: {
orient: 'vertical',
icon: 'rect',
x: '54%',
y: 'center',
itemWidth: 12,
itemHeight: 12,
itemGap: 7,
align: 'left',
tooltip: {
show: false
},
textStyle: {
color: '#999',
fontSize: 14,
padding: [0, 0, 0, 10]
},
formatter(name) {
let then = option.series[0].data // 获取series中的data
let str
let sums = 0
then.filter(items => {
sums += parseFloat(items.value)
})
for (let i = 0; i < then.length; i++) {
if (then[i].name == name) {
// p = (then[i].value / total) * 100;
str = name + ' ' + (parseFloat(then[i].value / sums) * 100).toFixed(2) + '%'
}
}
return str
}
},
polar: {
radius: ['44%', '50%']
// center: ['18%', '50%'],
},
angleAxis: {
max: 100,
show: false
},
radiusAxis: {
type: 'category',
show: true,
axisLabel: {
show: false
},
axisLine: {
show: false
},
axisTick: {
show: false
}
},
series: [
// {
// type: 'pie',
// center: ['30%', '50%'],
// radius: ['50%', '60%'],
// clockwise: false,
// avoidLabelOverlap: false,
// legendHoverLink: false,
// hoverAnimation: false,
// startAngle: 180, //起始角度
// hoverOffset: 1,
// tooltip: {
// show: false,
// },
// dispatchAction:({
// type: 'hideTip'
// }),
// zlevel: 25,
// emphasis: {},
// itemStyle: {},
// label: {
// show: false,
// position: 'center',
// color: 'rgba(13, 17, 29,0)',
// },
// data: [],
// },
// {
// type: 'gauge', //旋转小点下面指示盘lh
// name: '',
// radius: '70%',
// startAngle: '0',
// endAngle: '-359.99',
// splitNumber: '200',
// tooltip: {
// show: false,
// },
// dispatchAction:({
// type: 'hideTip'
// }),
// hoverAnimation: false,
// center: ['30%', '50%'],
// pointer: {
// show: false,
// },
// title: {
// show: false,
// },
// detail: {
// show: false,
// },
// data: [
// {
// value: 95,
// name: '',
// },
// ],
// axisLine: {
// lineStyle: {
// width: 20,
// opacity: 0,
// },
// },
// axisTick: {
// show: false,
// },
// splitLine: {
// show: true,
// length: 13,
// lineStyle: {
// color: {
// type: 'linear',
// x: 1,
// y: 0,
// x2: 0,
// y2: 0,
// colorStops: [
// {
// offset: 0,
// color: '#111',
// },
// {
// offset: 0.5,
// color: 'rgba(66, 66, 66, 1)',
// },
// {
// offset: 1,
// color: '#111',
// },
// ],
// globalCoord: false,
// },
// width: 1,
// type: 'solid',
// },
// },
// axisLabel: {
// show: false,
// },
// },
// {
// name: '', //外层光晕
// type: 'pie',
// startAngle: 90,
// tooltip: {
// show: false,
// },
// dispatchAction:({
// type: 'hideTip'
// }),
// hoverAnimation: false,
// radius: ['71%', '73%'],
// hoverAnimation: false,
// center: ['30%', '50%'],
// itemStyle: {
// normal: {
// labelLine: {
// show: false,
// },
// color: 'rgba(66, 66, 66, .4)',
// shadowBlur: 10,
// shadowColor: 'rgba(253, 249, 20, .3)',
// },
// },
// data: [
// {
// value: 100,
// },
// ],
// },
// {
// name: '', //外层光晕
// type: 'pie',
// startAngle: 90,
// tooltip: {
// show: false,
// },
// dispatchAction:({
// type: 'hideTip'
// }),
// hoverAnimation: false,
// radius: ['71.5%', '75%'],
// hoverAnimation: false,
// center: ['30%', '50%'],
// itemStyle: {
// normal: {
// labelLine: {
// show: false,
// },
// color: 'rgba(66, 66, 66, .3)',
// shadowBlur: 10,
// shadowColor: 'rgba(253, 249, 20, .3)',
// },
// },
// data: [
// {
// value: 100,
// },
// ],
// },
// {
// name: '', //外层光晕
// type: 'pie',
// startAngle: 90,
// tooltip: {
// show: false,
// },
// dispatchAction:({
// type: 'hideTip'
// }),
// hoverAnimation: false,
// radius: ['75.5%', '76.8%'],
// hoverAnimation: false,
// center: ['30%', '50%'],
// itemStyle: {
// normal: {
// labelLine: {
// show: false,
// },
// color: 'rgba(66, 66, 66, .2)',
// shadowBlur: 10,
// shadowColor: 'rgba(253, 249, 20, .3)',
// },
// },
// data: [
// {
// value: 100,
// },
// ],
// },
// {
// name: '', //外层光晕
// type: 'pie',
// startAngle: 90,
// tooltip: {
// show: false,
// },
// dispatchAction:({
// type: 'hideTip'
// }),
// hoverAnimation: false,
// radius: ['77.5%', '78.5%'],
// hoverAnimation: false,
// center: ['30%', '50%'],
// itemStyle: {
// normal: {
// labelLine: {
// show: false,
// },
// color: 'rgba(66, 66, 66, .1)',
// shadowBlur: 10,
// shadowColor: 'rgba(253, 249, 20, .3)',
// },
// },
// data: [
// {
// value: 100,
// },
// ],
// },
// {
// name: '', //旋转小圆点 lh
// type: 'custom',
// hoverAnimation: false,
// tooltip: {
// show: false,
// },
// dispatchAction:({
// type: 'hideTip'
// }),
// coordinateSystem: 'none',
// renderItem: {},
// data: [0],
// },
]
}
return option
},
universalEchartsOption: function(seriseData, xData, legendData, dw, legendIconType) {
let yName = dw? dw:''
return {
color: ['#209AFA','#38E68D', '#CFDB48', '#ECAE1F', '#8301FF', '#008080', '#A30113'],
tooltip: {
trigger: "axis"
},
legend: {
data: legendData,
right: 20,
top: 10,
icon: legendIconType,
orient: 'horizontal'
},
grid: {
// top: 20,
bottom: 40,
left: 40,
right: 20,
containLabel: false
},
xAxis: {
type: "category",
data: xData
},
yAxis: {
axisLine: {
show: false
},
nameTextStyle: {
color: "#666"
},
name: yName
},
series: seriseData
}
},
dataZoomOption: function(seriseData, xData, legendData, dw, legendIconType) {
let yName = dw? dw:''
return {
color: ['#209AFA','#38E68D', '#CFDB48', '#ECAE1F', '#8301FF', '#008080', '#A30113'],
tooltip: {
trigger: "axis"
},
legend: {
data: legendData,
right: 20,
top: 10,
icon: legendIconType,
orient: 'horizontal'
},
grid: {
// top: 20,
bottom: 40,
left: 40,
right: 20,
containLabel: false
},
xAxis: {
type: "category",
data: xData
},
yAxis: {
axisLine: {
show: false
},
nameTextStyle: {
color: "#666"
},
name: yName
},
dataZoom: [
{
show: true,
xAxisIndex: [0],
type: 'slider',
top: '290',
height:'6',
start: 0,
end: 100,
handleIcon: //两侧缩放手柄的 icon 形状
'path://m510.511,98.545c-202.52,0 -369.3,166.779 -369.3,369.299c0,205.498 166.779,372.278 369.299,372.278c205.498,0 372.278,-166.779 372.278,-372.278c0,-202.52 -166.779,-369.299 -372.278,-369.299l0,0l0.001,0zm0,77.435c163.802,0 294.844,131.042 294.844,291.865c0,163.802 -131.042,294.845 -294.845,294.845c-160.823,0 -291.865,-131.042 -291.865,-294.845c0,-160.823 131.042,-291.865 291.865,-291.865l0.001,0z',
handleSize: '12',
handleStyle: { //两侧缩放手柄的样式配置
color: '#209AFA',
backgroundColor: '#ffffff',
borderColor: '#209AFA',
// shadowColor: '#209AFA',
},
textStyle: {
color: '#666666'
},
backgroundColor: 'rgba(0,112,222,0.0600)',
borderColor:'#ffffff',// 长条边框颜色
moveHandleSize: 8, //移动手柄的样式配置
moveHandleStyle: {
color: '#fff',
// borderColor: '#209AFA',
shadowColor: '#209AFA',
opacity: 1,
},
emphasis: {
moveHandleStyle: {
color: '#209AFA',
borderColor: '#209AFA',
shadowColor: '#209AFA',
opacity: 1,
},
handleStyle: {
color: '#209AFA',
// borderColor: '#209AFA',
shadowColor: '#209AFA',
},
},
dataBackground: {
lineStyle: {
color: 'none',
shadowColor: 'none',
},
areaStyle: {
color: 'none',
shadowColor: 'none',
},
},
selectedDataBackground: {
lineStyle: {
color: 'none',
shadowColor: 'none',
},
areaStyle: {
color: 'none',
shadowColor: 'none',
},
},
}
],
series: seriseData
}
},
twoYAxischartsOption: function(seriseData, xData, legendData, dw, legendIconType, dw2) {
let yName = dw? dw:''
let yName2 = dw2? dw2:''
return {
color: ['#209AFA','#38E68D', '#CFDB48', '#ECAE1F', '#8301FF', '#008080', '#A30113'],
tooltip: {
trigger: "axis"
},
legend: {
data: legendData,
right: 20,
top: 10,
icon: legendIconType,
orient: 'horizontal'
},
grid: {
// top: 20,
bottom: 40,
left: 40,
right: 40,
containLabel: false
},
xAxis: {
type: "category",
data: xData
},
yAxis: [
{
axisLine: {
show: false
},
nameTextStyle: {
color: "#666"
},
name: yName
},
{
axisLine: {
show: false
},
nameTextStyle: {
color: "#666"
},
name: yName2
}
],
series: seriseData
}
},
bar10Option: function(dimensions, source) {
return {
color: ['#209AFA','#38E68D', '#CFDB48', '#ECAE1F', '#8301FF', '#008080', '#A30113'],
tooltip: {
trigger: "axis"
},
legend: {
right: 20,
top: 10,
icon: 'roundRect',
orient: 'horizontal'
},
dataset: {
dimensions: dimensions,
source: source,
},
grid: {
// top: 20,
bottom: 40,
left: 40,
right: 20,
containLabel: false
},
xAxis: { type: "category" },
yAxis: {
axisLine: {
show: false,
},
nameTextStyle: {
color: "#666",
},
name: "单位:kWh",
},
series: [
{ type: "bar", color: "#96F203", barWidth: 20 },
{ type: "bar", color: "#00A7F0", barGap: "0", barWidth: 20 },
],
dataZoom: [
{
show: true,
xAxisIndex: [0],
type: 'slider',
top: '290',
height:'6',
startValue: 0,
endValue: 9,
handleIcon: //两侧缩放手柄的 icon 形状
'path://m510.511,98.545c-202.52,0 -369.3,166.779 -369.3,369.299c0,205.498 166.779,372.278 369.299,372.278c205.498,0 372.278,-166.779 372.278,-372.278c0,-202.52 -166.779,-369.299 -372.278,-369.299l0,0l0.001,0zm0,77.435c163.802,0 294.844,131.042 294.844,291.865c0,163.802 -131.042,294.845 -294.845,294.845c-160.823,0 -291.865,-131.042 -291.865,-294.845c0,-160.823 131.042,-291.865 291.865,-291.865l0.001,0z',
handleSize: '12',
handleStyle: { //两侧缩放手柄的样式配置
color: '#209AFA',
backgroundColor: '#ffffff',
borderColor: '#209AFA',
// shadowColor: '#209AFA',
},
textStyle: {
color: '#666666'
},
backgroundColor: 'rgba(0,112,222,0.0600)',
borderColor:'#ffffff',// 长条边框颜色
moveHandleSize: 8, //移动手柄的样式配置
moveHandleStyle: {
color: '#fff',
// borderColor: '#209AFA',
shadowColor: '#209AFA',
opacity: 1,
},
emphasis: {
moveHandleStyle: {
color: '#209AFA',
borderColor: '#209AFA',
shadowColor: '#209AFA',
opacity: 1,
},
handleStyle: {
color: '#209AFA',
// borderColor: '#209AFA',
shadowColor: '#209AFA',
},
},
dataBackground: {
lineStyle: {
color: 'none',
shadowColor: 'none',
},
areaStyle: {
color: 'none',
shadowColor: 'none',
},
},
selectedDataBackground: {
lineStyle: {
color: 'none',
shadowColor: 'none',
},
areaStyle: {
color: 'none',
shadowColor: 'none',
},
},
}
]
}
}
}


 1640
1640


 被折叠的 条评论
为什么被折叠?
被折叠的 条评论
为什么被折叠?
 到【灌水乐园】发言


