


下面将爬取中国男女比例数据,生成柱状图,折线图,词云生成,放入HTML文件中
首先导入需要用到的库
import pandas as pd
import requests
import urllib3
from pyecharts.charts import Bar, Line, WordCloud, Page
from pyecharts import options as opts
爬虫
rllib3.disable_warnings()# 屏蔽https证书警告
url = "http://www.stats.gov.cn/ztjc/zdtjgz/zgrkpc/dqcrkpc/ggl/202105/t20210519_1817697.html"
response = requests.get(url, verify=False)#对url网址进行请求,verify当访问https页面出现证书错误,可以使用verify来取消验证
response.encoding = response.apparent_encoding#获取响应对象的编码格式
html = response.text#得到文本数据
data = pd.read_html(html, header=0)[0]#获取html中table标签的表格
data.to_excel('爬虫数据.xlsx')#将爬取的代码放入excel表格中
数据分析
data.columns = ['地区', '男', '女', '性别比']#把每一列的列表名改为'地区','男','女','性别比'
data.drop(data.index[0:2], inplace=True)#删除第一和第二行数据
city = list(data["地区"])#把名为“地区”的列拿出来命名为city
child = list(data["性别比"])#把名为“性别比”的列拿出来命名为child
people = [list(z) for z in zip(city, child)]#把city和child的数据打包放在people中
data.to_excel('数据分析.xlsx')#将分析后的数据放入excel文件中
柱状图
bar = (
Bar()#引入bar这个类
.add_xaxis(city)#x轴数据定义为city
.add_yaxis("男女比例", child)#y轴数据定义为child
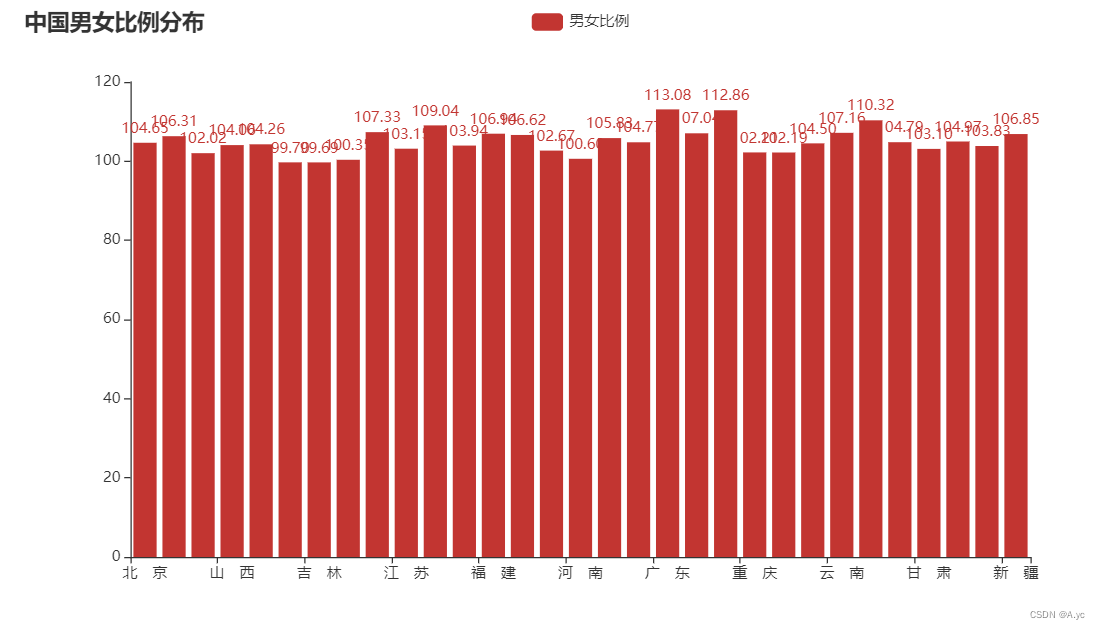
.set_global_opts(title_opts=opts.TitleOpts(title="中国男女比例分布"))#生成柱状图的标题
)柱状图效果图片
折线图
line = (
Line()#引入Line类
.add_xaxis(city)#定义x轴的值
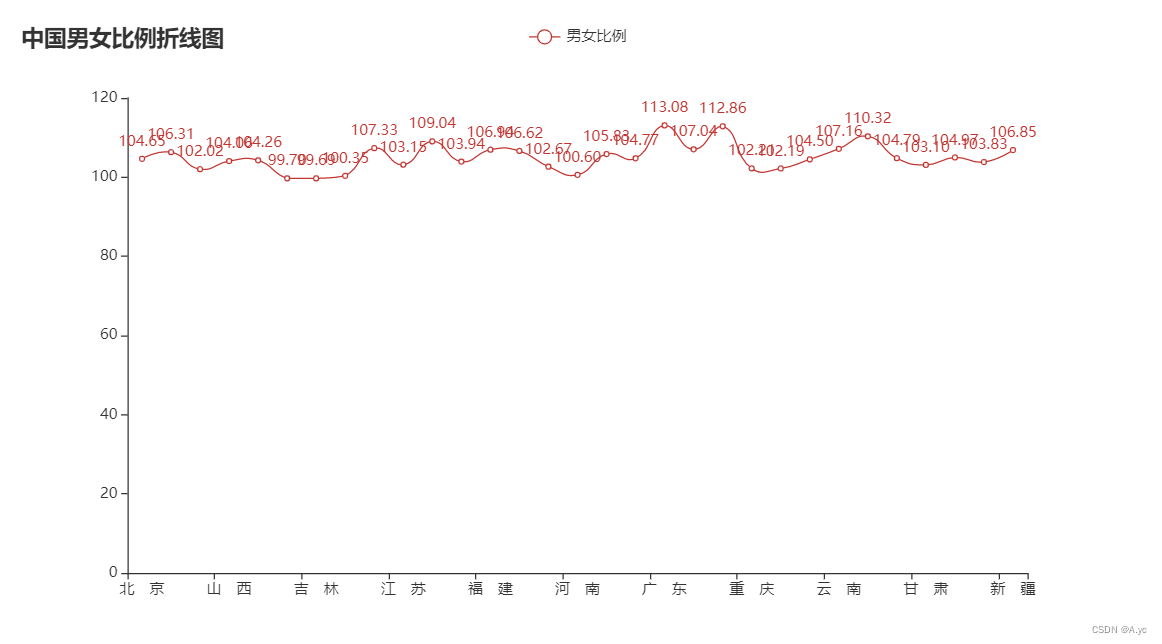
.add_yaxis('男女比例', child, is_smooth=True)#定义y轴的值
.set_global_opts(title_opts=opts.TitleOpts(title="中国男女比例折线图")) # 生成折线图的标题
)折线图效果图
词云图
wordcloud = (
    WordCloud()#引入WordCloud类
    .add("", people, word_size_range=[20, 60])#定义词云的数据
    .set_global_opts(title_opts=opts.TitleOpts(title="中国男女比例词云图"))#生成词云的标题
)
词云图效果图

把词云图,柱状图,词云图放入HTML文件中
page = Page(layout=Page.SimplePageLayout)#定义html中SimplePageLayout布局
page.add(
    bar,
    line,
    wordcloud,
)
生成HTML文件
page.render('中国男女比例分布.html')#生成一个名为中国男女比例分布的html文件完整代码
import pandas as pd
import requests
import urllib3
from pyecharts.charts import Bar, Line, WordCloud, Page
from pyecharts import options as opts

#爬虫
urllib3.disable_warnings()# 屏蔽https证书警告
url = "http://www.stats.gov.cn/ztjc/zdtjgz/zgrkpc/dqcrkpc/ggl/202105/t20210519_1817697.html"
response = requests.get(url, verify=False)#对url网址进行请求,verify当访问https页面出现证书错误,可以使用verify来取消验证
response.encoding = response.apparent_encoding#获取响应对象的编码格式
html = response.text#得到文本数据
data = pd.read_html(html, header=0)[0]#获取html中table标签的表格
data.to_excel('爬虫数据.xlsx')

# 数据清洗
data.columns = ['地区', '男', '女', '性别比']#把每一列的列表名改为'地区','男','女','性别比'
data.drop(data.index[0:2], inplace=True)#删除第一和第二行数据
city = list(data["地区"])#把名为“地区”的列拿出来命名为city
child = list(data["性别比"])#把名为“性别比”的列拿出来命名为child
people = [list(z) for z in zip(city, child)]#把city和child的数据打包放在people中
data.to_excel('数据分析.xlsx')

#柱状图
bar = (
    Bar()#引入bar这个类
    .add_xaxis(city)#x轴数据定义为city
    .add_yaxis("男女比例", child)#y轴数据定义为child
    .set_global_opts(title_opts=opts.TitleOpts(title="中国男女比例分布"))#生成柱状图的标题
)

#折线图
line = (
    Line()#引入Line类
    .add_xaxis(city)#定义x轴的值
    .add_yaxis('男女比例', child, is_smooth=True)#定义y轴的值
    .set_global_opts(title_opts=opts.TitleOpts(title="中国男女比例折线图"))  # 生成折线图的标题
)

#词云图
wordcloud = (
    WordCloud()#引入WordCloud类
    .add("", people, word_size_range=[20, 60])#定义词云的数据
    .set_global_opts(title_opts=opts.TitleOpts(title="中国男女比例词云图"))#生成词云的标题
)

page = Page(layout=Page.SimplePageLayout)#定义html中SimplePageLayout布局
page.add(
    bar,
    line,
    wordcloud,
)#把柱状图,折线图,词云图放在一个html中

page.render('中国男女比例分布.html')#生成一个名为中国男女比例分布的html文件


 被折叠的 条评论
为什么被折叠?
被折叠的 条评论
为什么被折叠?
 到【灌水乐园】发言


