


C++代码
#include <iostream>
#include <Python.h>
#include<string>
#include<vector>
#include<array>
#include <numpy/arrayobject.h>

using namespace std;


void init_numpy() {
	_import_array();
}


int main()
{
	std::array<float, 10> x = { 2597.1, 2232.0, 2022.6, 1781.0, 1569.4, 1319.0, 1132.0, 946.0, 743.0, 532.3 };
	std::array<float, 10> y = { 696.9, 623.8, 550.8, 477.7, 404.6, 328.8, 255.7, 182.7, 109.6, 36.5 };
	std::array<float, 10> y2 = { 699.7, 696.7, 550.8, 477.7, 404.6, 328.8, 255.7, 182.7, 109.6, 36.5};
	std::array<std::array<float, 10>, 3> input_nums = { x, y, y2 };
	int rows = input_nums.size();
	int columns = x.size();
	float** array1 = (float**)malloc(sizeof(float*) * rows);
	for (int i = 0; i < rows; i++)
	{
		array1[i] = &input_nums[i][0];
	}
	npy_intp Dims[2] = { rows, columns }; // difine the dimension
	Py_Initialize(); //Initialize
	if (!Py_IsInitialized()) {
		std::cout << "python init failed" << std::endl;
		return 1;
	}
	init_numpy();

	PyRun_SimpleString("import sys");
	PyRun_SimpleString("sys.path.append('./../PythonAppTest/')"); // Python Project Path
	PyObject* pModule = PyImport_ImportModule("ZoomTest"); // copy the "py" to the PythonAppTest project
	PyObject* PyArray = PyArray_SimpleNewFromData(2, Dims, NPY_FLOAT, *array1);//delete the array to python
	PyObject* ArgArray = PyTuple_New(1);
	PyTuple_SetItem(ArgArray, 0, PyArray);// define the PyTuple object size as PythonFunction parameter
	// create PyObject object,2 representative dimension,second is dimension array Dims, third is the array types,forth is the input array
	if (!pModule)
	{
		std::cout << "Can't find your py file.";
		getchar();
		return -1;
	}
	PyObject* pFunc = PyObject_GetAttrString(pModule, "main"); // create python function object

	// parameter type chage
	PyObject* pArg = PyTuple_New(1);

	//Call the function and pass the parameter
	PyObject* py_result = PyObject_CallObject(pFunc, ArgArray);


	Py_DECREF(pModule);
	Py_DECREF(pFunc);
	Py_DECREF(py_result);
	Py_DECREF(pArg);
	Py_Finalize();
	system("pause");
	return 0;
}
Python代码
import numpy as np
import matplotlib.pyplot as plt
import matplotlib as mpl
from matplotlib import cycler
from matplotlib.text import Text, Annotation
from matplotlib.patches import Polygon, Rectangle, Circle, Arrow, ConnectionPatch,Ellipse,FancyBboxPatch
from matplotlib.widgets import Button, Slider, Widget
def call_move(event, fig): # event mouse press/release
global mPress # whether mouse button press or not
global startx
global starty
# print(mPress)
if event.name=='button_press_event':
axtemp=event.inaxes
# Whether mouse in a coordinate system or not, yes is the figure in the mouse location, no is None
if axtemp and event.button==1:
print(event)
mPress=True
startx=event.xdata
starty=event.ydata
elif event.name=='button_release_event':
axtemp=event.inaxes
if axtemp and event.button==1:
mPress=False
elif event.name=='motion_notify_event':
axtemp=event.inaxes
if axtemp and event.button==1 and mPress: # the mouse continuing press
x_min, x_max = axtemp.get_xlim()
y_min, y_max = axtemp.get_ylim()
w=x_max-x_min
h=y_max-y_min
# mouse movement
mx=event.xdata-startx
my=event.ydata-starty
axtemp.set(xlim=(x_min-mx, x_min-mx+w))
axtemp.set(ylim=(y_min-my, y_min-my+h))
fig.canvas.draw_idle() # Delay drawing
return
def call_scroll(event, fig):
print(event.name)
axtemp=event.inaxes
print('event:',event)
print(event.xdata,event.ydata)
# caculate the xlim and ylim after zooming
if axtemp:
x_min, x_max = axtemp.get_xlim()
y_min, y_max = axtemp.get_ylim()
w = x_max - x_min
h = y_max - y_min
curx=event.xdata
cury=event.ydata
curXposition=(curx - x_min) / w
curYposition=(cury - y_min) / h
# Zoom the figure for 1.1 times
if event.button == 'down':
print('befor:',w,h)
w = w*1.1
h = h*1.1
print('down',w,h)
elif event.button == 'up':
print('befor:',w,h)
w = w/1.1
h = h/1.1
print('up',w,h)
print(curXposition,curYposition)
newx=curx - w*curXposition
newy=cury - h*curYposition
axtemp.set(xlim=(newx, newx+w))
axtemp.set(ylim=(newy, newy+h))
fig.canvas.draw_idle() # drawing
def update_annot(ind, l1, annot, x_str, y_str, fig):
posx = np.array(l1.get_data())[0][ind["ind"][0]] #get the x in the line
posy = np.array(l1.get_data())[1][ind["ind"][0]] #get the y in the line
annot.xy = ([posx, posy])
text = "{}, {}".format(" ".join([x_str[n] for n in ind["ind"]]),
" ".join([y_str[n] for n in ind["ind"]]))
annot.set_text(text)
cmap = plt.cm.RdYlGn
norm = plt.Normalize(1,4)
c = np.random.randint(1,10,size=20) # the upper colour
annot.get_bbox_patch().set_facecolor(cmap(norm(c[ind["ind"][0]])))
annot.get_bbox_patch().set_alpha(0.4)
def hover(event, l1, annot, ax, x_str, y_str, fig):
vis = annot.get_visible()
if event.inaxes == ax:
cont, ind = l1.contains(event)
if cont: # the mouse in the point
update_annot(ind, l1, annot, x_str, y_str, fig)
annot.set_visible(True)
else:
if vis:
annot.set_visible(False)
fig.canvas.draw_idle()
def SetFigSize(ax, x, y):
x_min = min(x)
x_max = max(x)
y_min = min(y)
y_max = max(y)
ax.set_xlim(x_min, x_max) # xlabel start limition
ax.set_ylim(y_min, y_max) # ylabel start limition
def set_colors(color_nums):
num_plots = color_nums # the number of colour types
colormap = plt.cm.gist_ncar
c = [colormap(i) for i in np.linspace(0, 1, num_plots)]
myCycler = cycler(color = c)
plt.gca().set_prop_cycle(myCycler) # set the colour change
def main(Array):
fig = plt.figure() # Set up Canvas
ax = fig.add_subplot(111)
annot = ax.annotate("", xy=(0,0), xytext=(20,20),textcoords="offset points",
bbox=dict(boxstyle="round", fc="w"),
arrowprops=dict(arrowstyle="->")) # set annot
set_colors(20) # set line color types
x = np.array([])
y = np.array([])
for i in range(1, len(Array)): # from second row
x = np.hstack((x, Array[0]))
y = np.hstack((y, Array[i]))
l = plt.plot(Array[0], Array[i])
x = np.around(x, decimals=2) # Keep 2 decimal places
y = np.around(y, decimals=2)
x_str = np.array(x).astype(str)
y_str = np.array(y).astype(str)
l1, = plt.plot(x, y)
l1.remove() #hide the l1
#l2, = plt.plot(x, y2,color='red',linewidth=1.0,linestyle='--',label='square line')
#plt.legend(handles=[l1, l2], labels=['up', 'down'], loc='upper right')
annot.set_visible(False) # mouse not display the information when not pointing
plt.grid()
startx=0
starty=0
mPress=False
fig.canvas.mpl_connect('scroll_event', lambda event: call_scroll(event, fig)) # Event mouse wheel
fig.canvas.mpl_connect('button_press_event', lambda event: call_move(event, fig)) # Event mouse button press
fig.canvas.mpl_connect('button_release_event', lambda event: call_move(event, fig)) # Event mouse button release
#fig.canvas.mpl_connect('draw_event', call_move) # Event draw figure
fig.canvas.mpl_connect('motion_notify_event', lambda event: call_move(event, fig)) # Event mouse move
fig.canvas.mpl_connect("motion_notify_event", lambda event: hover(event, l1, annot, ax, x_str, y_str, fig))
plt.show()
SetFigSize(ax, x, y) # Set the starting figsize,ax is the canvas
if __name__ == "__main__":
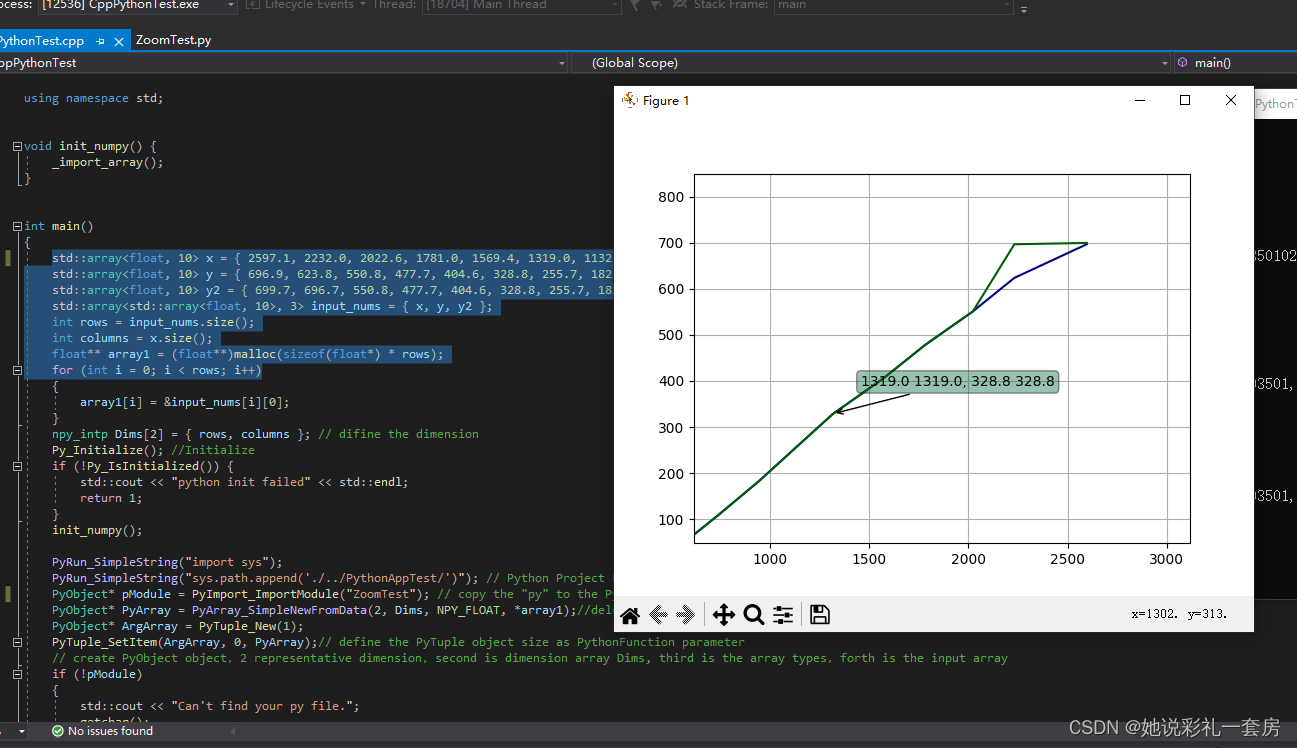
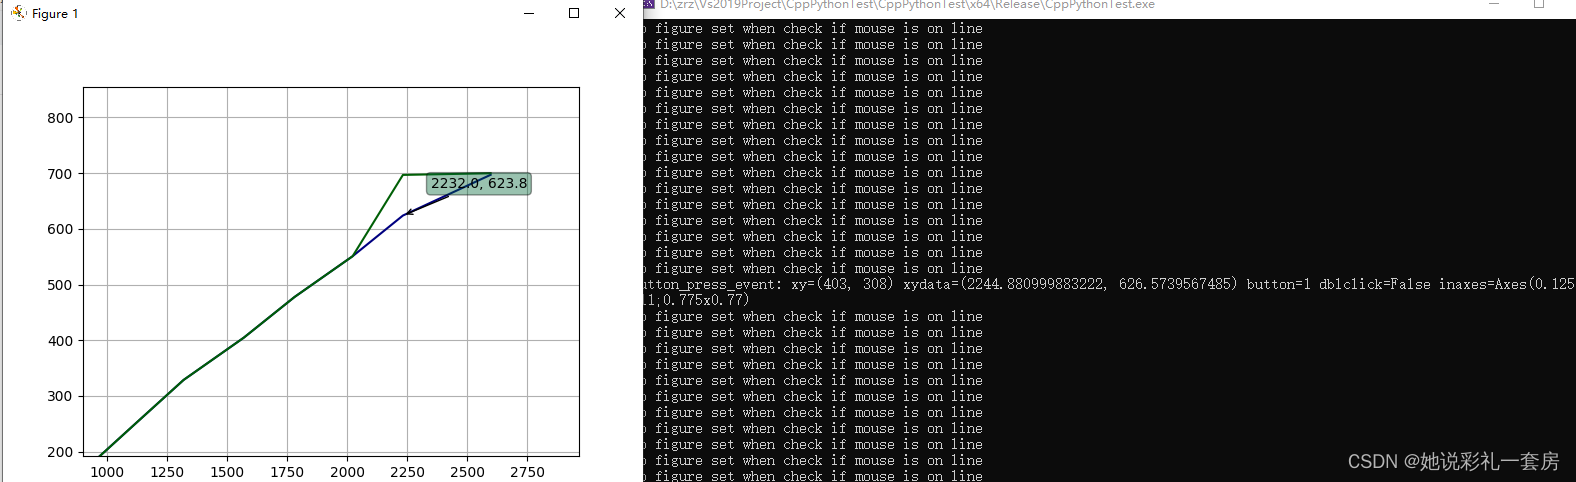
main(Array)实验结果:


 1189
1189


 被折叠的 条评论
为什么被折叠?
被折叠的 条评论
为什么被折叠?
 到【灌水乐园】发言


