


前言
爬取网站:https://item.jd.com/100014278890.html
利用scrapy框架实现京东螺蛳粉评论数据爬取及可视化分析(对任课老师下发任务二的一个小总结),实战次数少,代码过程中若有不当之处,还望各位留言哦~

开发工具
python3.8
一、数据爬取(Scrapy)
1、配置scrapy框架
- 终端配置
pip install scrapy
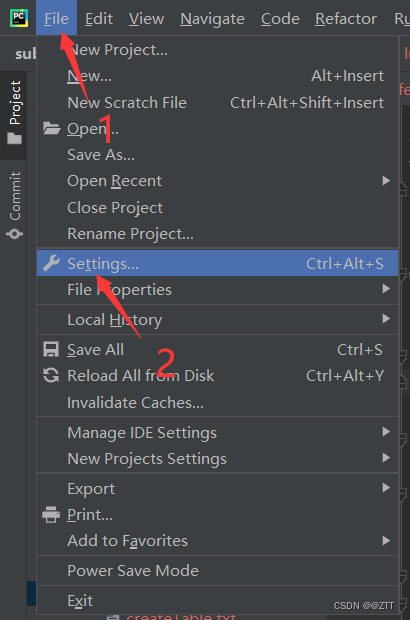
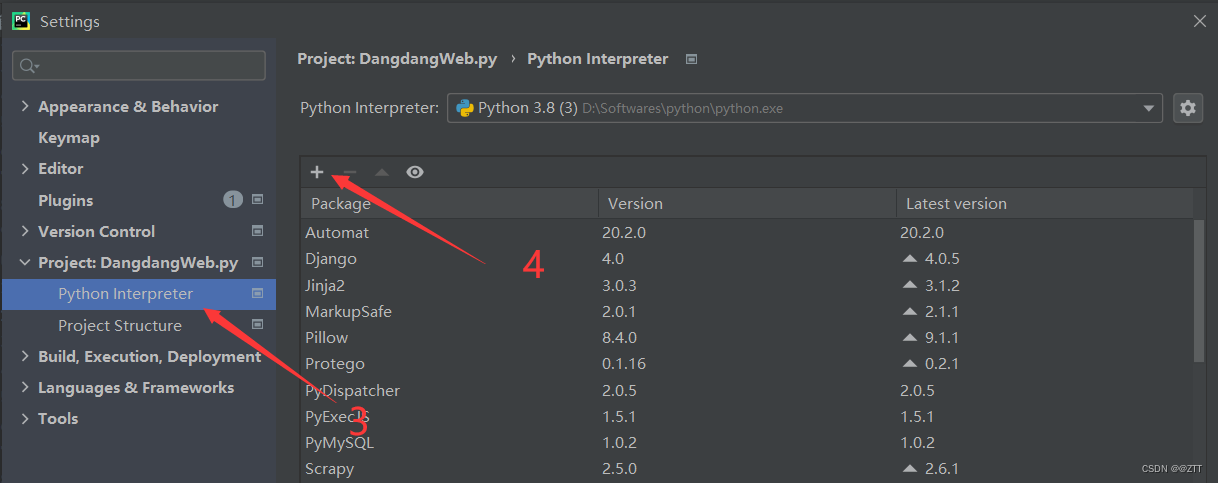
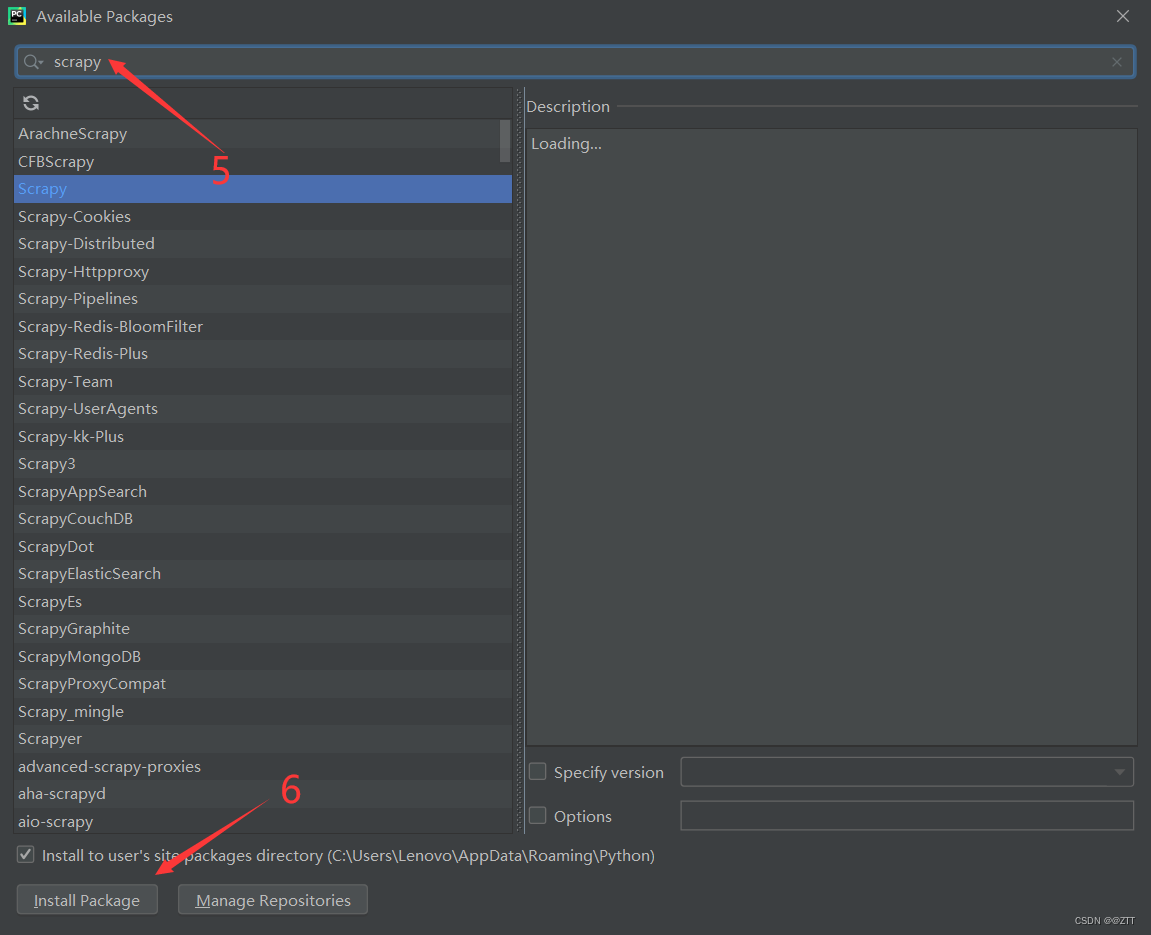
- pycharm里面配置
2、在cmd里面创建Scrapy项目工程
- 在指定目录下创建工程

- 创建源文件(一般情况下不需要添加http协议)

注意:创建执行文件的目录一定要正确!!!
3、对spiders项目下的文件进行修改
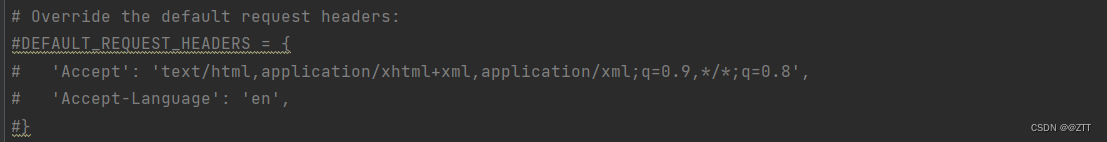
(1)修改settings.py
- 不遵守robots协议
修改前

修改后

- 添加用户代理
修改前
修改后

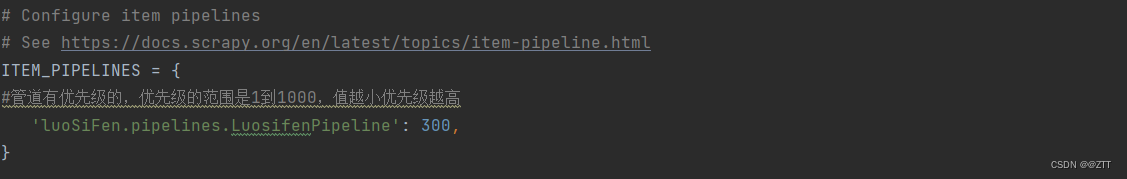
- 设置管道优先级
修改前
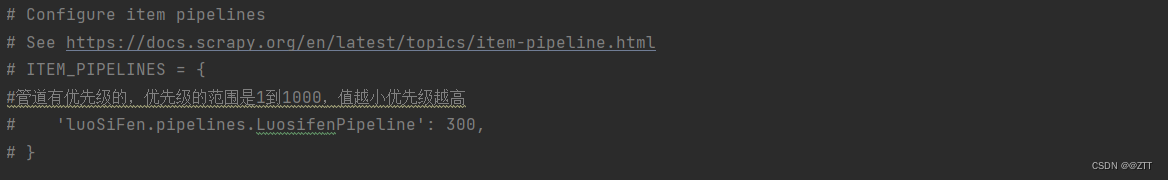
修改后
(2)修改items.py
定义数据输出格式
import scrapy
class LuosifenItem(scrapy.Item):
    # define the fields for your item here like:
    score = scrapy.Field()
    productName = scrapy.Field()
    content = scrapy.Field()
    userNum = scrapy.Field()
    commentDate = scrapy.Field()
(3)编写执行文件
import random
import scrapy
import json
from luoSiFen.items import LuosifenItem
import time


class LuosiSpider(scrapy.Spider):
    name = 'luoSi'
    allowed_domains = ['jd.com']
    start_urls = [
        'https://item.jd.com/100014278890.html']

    def parse(self, response):
        divTags = response.xpath("//*[@id='choose-attr-1']/div[2]/div")  # 是个selector对象
        for divTag in divTags:
            idNum = divTag.xpath('./@data-sku').extract_first()  # 取出选择类别里面的四个id
            # goodsName = divTag.xpath('./a/i/text()').extract_first()  # 取出选择类别里面的分类
            for score in range(0, 6):
                for pageNum in range(0, 2):
                    url = "https://club.jd.com/comment/skuProductPageComments.action?callback=fetchJSON_comment98&productId=" + str(
                        idNum) + "&score=" + str(score) + "&sortType=5&page=" + str(
                        pageNum) + "&pageSize=10&isShadowSku=0&rid=0&fold=1"
                    print(url)
                    time.sleep(random.randint(6,7))
                    if url:
                        yield scrapy.Request(url=url, callback=self.parseSecond,method="GET")  # 抛出一个数据,相当于不结束的return
                        # dont_filter=False,dont_filter意思就是不去重

    def parseSecond(self, response):
        data = response.text  # 四个分类的第一页全部评论
        data = data.strip()#去除空字符串
        if len(data) <= 0:
            return
        dataAll = data.replace('fetchJSON_comment98(', '').replace(');', '')
        dataLast = json.loads(dataAll)  # 将json文件转换成python格式
        commentAll = dataLast["comments"]
        for information in commentAll:
            global score, productName, content, userNum, image, commentDate
            try:
                score = information['score'].replace("\t","").replace(" ","")  # 判断中差好追评
                productName = information["productColor"].replace("\t","").replace(" ","")  # 爬取商品名称
                content = information['content'].replace("\t","").replace(" ","")  # 全部评论的具体内容
                print(content)
                userNum = information['id']  # 获取用户id
                commentDate = information['creationTime'].replace("\t","")  # 评论具体日期
            except:
                print("解析出现异常")
            comment = LuosifenItem(score=score, productName=productName, content=content, userNum=userNum,
                                   commentDate=commentDate)
            yield comment
注意:这里的评论页数暂时的第一页的评论内容!!!
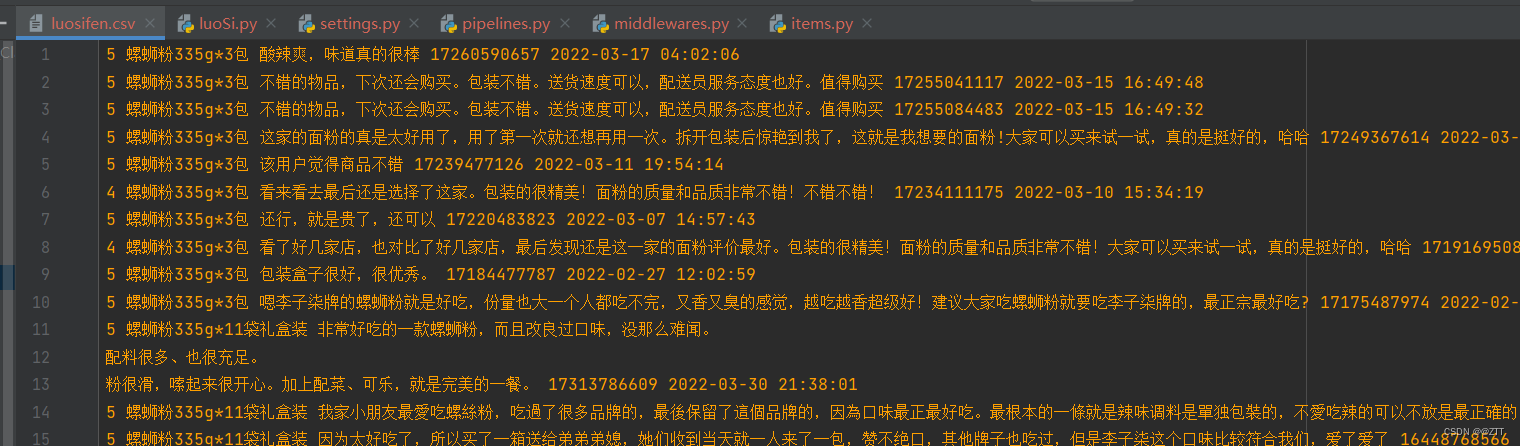
(4)根据工程执行文件编写pipelines.py
- 数据存储成csv文件(大家尽量把评论内容放到表格末端哦,这样在后期的操作中会有意想不到的惊喜,哈哈哈)

# Define your item pipelines here
#
# Don't forget to add your pipeline to the ITEM_PIPELINES setting
# See: https://docs.scrapy.org/en/latest/topics/item-pipeline.html


# useful for handling different item types with a single interface
from itemadapter import ItemAdapter

'''数据存储'''
class LuosifenPipeline:
    '''在爬虫文件开始之前就执行的一个方法'''

    def open_spider(self, spider):
        self.fp = open('luosifen.csv', mode='a+', encoding="utf-8")

    # item就是yield后面的book对象
    def process_item(self, item, spider):
        self.fp.write("{} {} {} {} {}".format(item["score"],item["productName"],item["content"],item["userNum"],item["commentDate"]+"\n"))
        '''以下模式不推荐 因为每传递过来的一个对象,那么就会打开一次文件,对文件的操作过于频繁'''
        # write方法必须要写一个字符串,而不能是其他的对象
        # with open("luosifen.txt","a",encoding="utf-8") as fp:#将a改为w的话,那么只有一条数据
        #     fp.write(str(item))
        return item

    '''在爬虫文件执行完之后执行的方法'''

    def close_spider(self, spider):
        self.fp.close()
(5)执行工程
- scrapy crawl luoSi -s LOG_FILE=spider.log
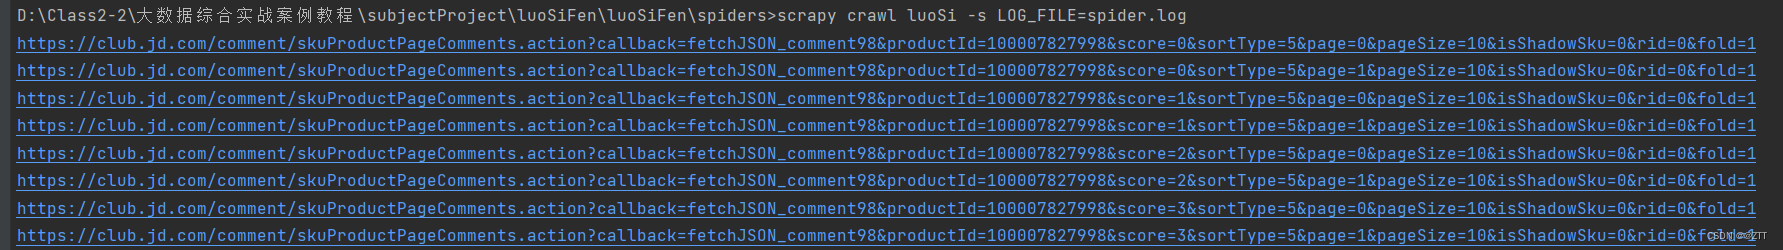
- 查看结果
二、数据预处理(pandas)
这个模块的内容主要是在jupyter里面进行!!!

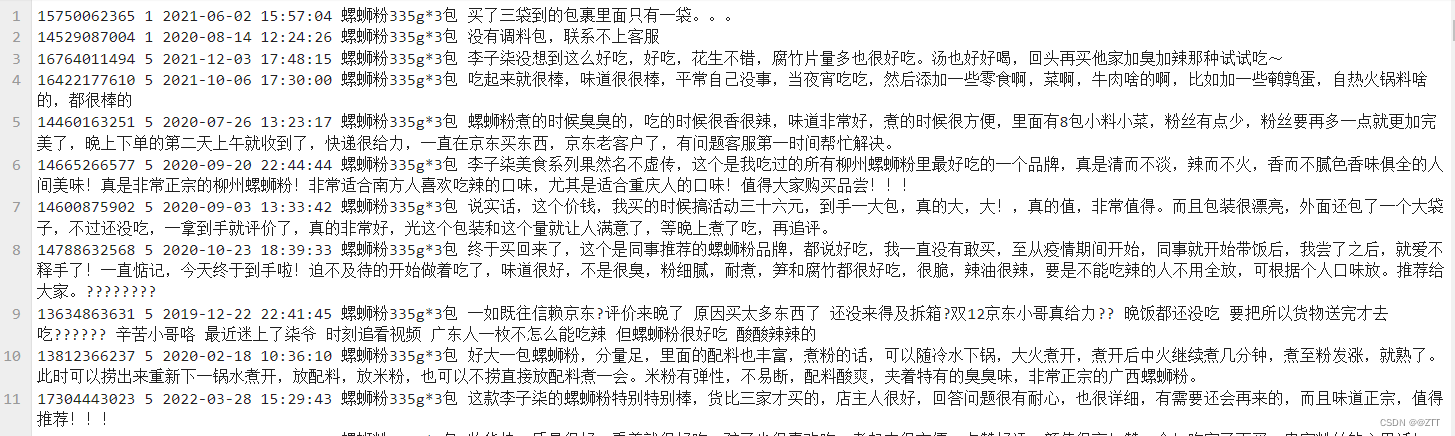
为了对数据进行友好的处理,笔者使用的是同班同学的txt文件,其数据的主要区别就是将评论内容放到表格末尾
文件内容展示
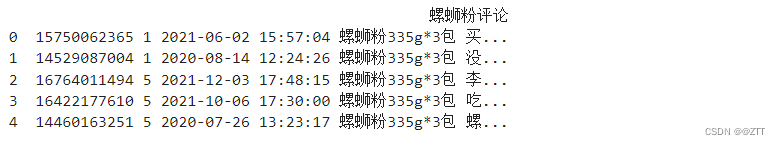
- 导入txt文件,同时查看数据前五行
import pandas as pd
import numpy as np
data = pd.read_table("luosifen3.txt",sep="\t",encoding = 'utf-8',names=["螺蛳粉评论"])
print(data.head(5))
查看结果
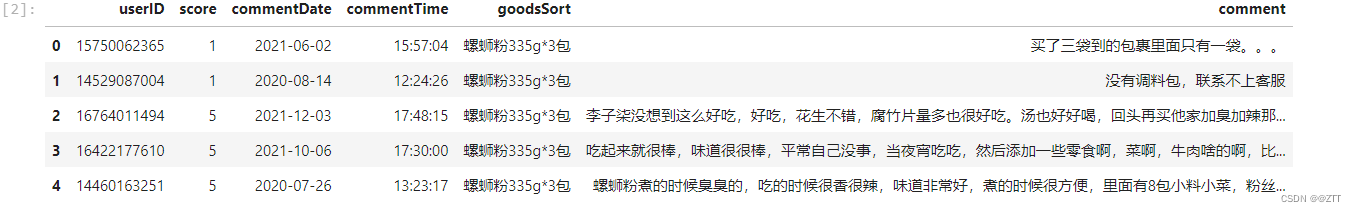
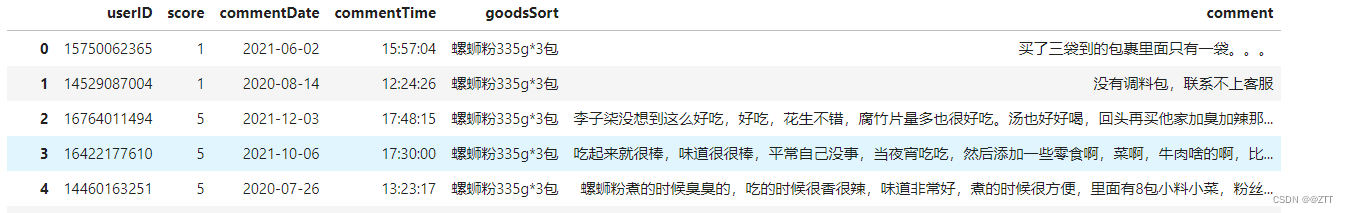
- 对数据进行空格分割,同时添加列名
data1 = data['螺蛳粉评论'].str.replace("\n","")
data1=data1.str.split(" ",5,True)
data1.columns=['userID','score','commentDate','commentTime','goodsSort','comment']
data1.head(5)
查看结果
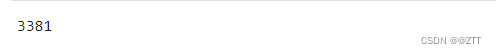
- 查看重复值
data1.duplicated().sum()
查看结果
- 去除重复值
data1=data1.drop_duplicates()
data1.duplicated().sum()
查看结果

- 对源数据进行重新索引
data1 = data1.reset_index(drop=True)
data1
查看结果
- 查看缺失值
data1.isnull().any()
查看结果
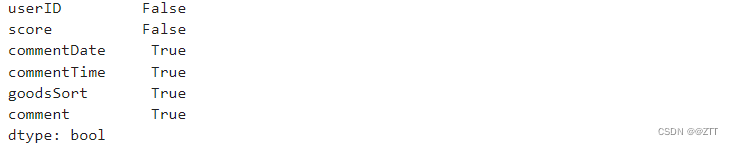
因为本次案例的主要任务是对评论的相关数据信息进行处理,所以我们主要与评论相关的数据
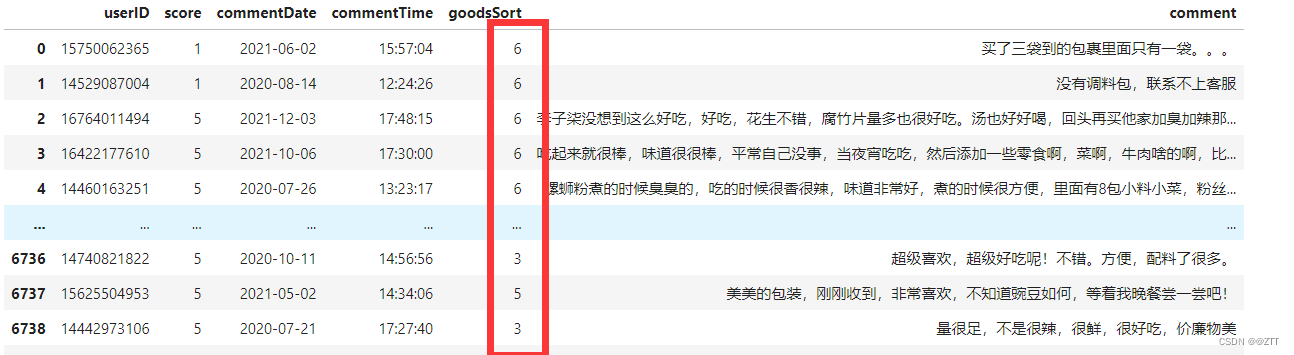
- 查看评论一列的缺失值
data1[data1['comment'].isnull()]
查看结果

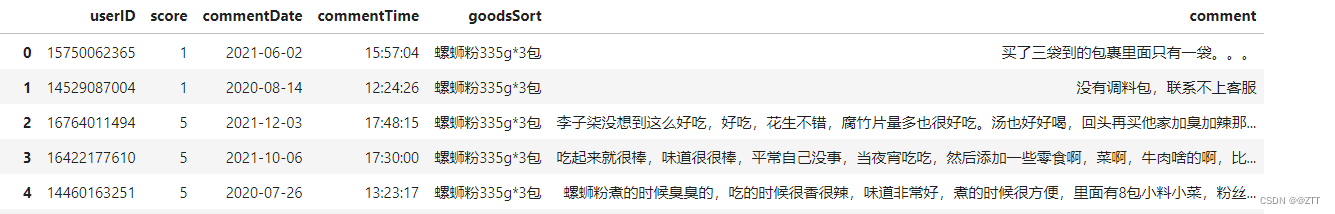
- 处理缺失值( 删除评论中的无用信息)
data1 = data1.drop(3138,axis=0)
data1
查看结果
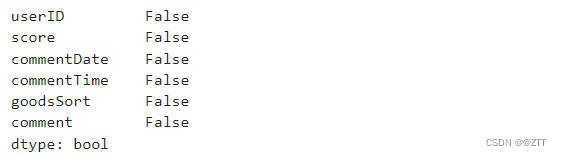
- 填充评论中的空值信息
data1['comment'] = data1['comment'].fillna('此用户没有评价')
data1.isnull().any()
查看结果
- 商品种类分组
data1.groupby(['goodsSort']).size()
查看结果
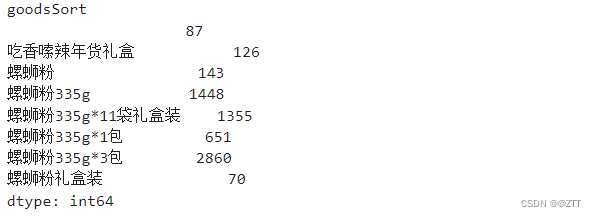
- 使用数字替换商品种类类别
data1['goodsSort'] = data1['goodsSort'].replace("","0").replace("吃香嗦辣年货礼盒","1").replace("螺蛳粉","2").replace("螺蛳粉335g","3").replace("螺蛳粉335g*11袋礼盒装","4").replace("螺蛳粉335g*1包","5").replace("螺蛳粉335g*1包","5").replace("螺蛳粉335g*3包","6").replace("螺蛳粉礼盒装","7")
data1
查看结果
- 为了数据分析与可视化,可以对日期进行一个分列处理
data1[['year','month','day']]=data1.commentDate.str.split('-',2,True)
data1[['hours','minute','second']]=data1.commentTime.str.split(':',2,True)
- 存储处理后的数据
data1.to_csv("luoDeal.csv")
查看csv文件
三、数据存储(Hadoop)
- 启动集群

- 创建文件夹存放csv文件

- 上传数据

四、数据分析(Spark)
注意:此模块的代码编写是在idea里面运行,同时在存储的时候可以将列名去掉,以便后面的数据分析与可视化
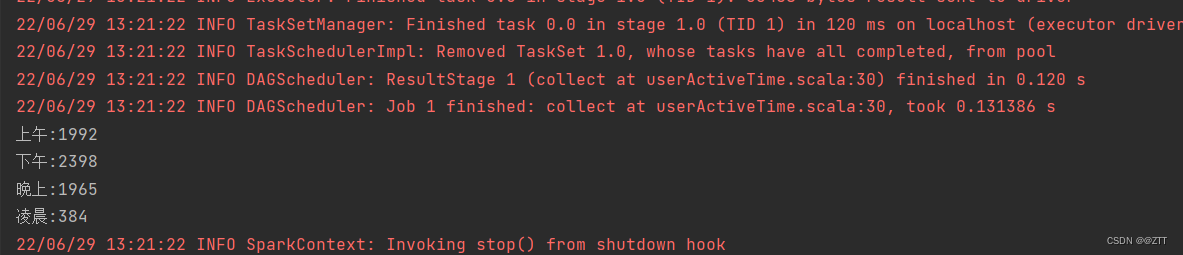
1、统计螺蛳粉的用户评论活跃时间
- 代码展示
package luoSiFen

import org.apache.spark.{SparkConf, SparkContext}
import org.apache.spark.rdd.RDD
//统计螺蛳粉的用户评论活跃时间(早中晚)


object userActiveTime {
  def main(args: Array[String]): Unit = {
    System.setProperty("hadoop.home.dir", "D:\\Class2\\Spark\\hadoop-3.3.0")

    val conf: SparkConf = new SparkConf()
    conf.setMaster("local").setAppName("count")
    val sc: SparkContext = new SparkContext(conf)
    val lines: RDD[String] = sc.textFile("D:\\Class2\\Data_views\\Notebook\\JDluosifen\\luoDeal.csv")
        lines.foreach(println)

    /** 使用,进行分割 */
    val allTime: RDD[String] = lines.map(line => {
      line.split(",")(4)
    })
    //    allTime.foreach(println)

    /**使用map获取具体小时*/
    val allHours: RDD[String] = allTime.map(line => {
      line.split(":")(0)
    })
    //    println(allHours.getClass)#查看数据类型

    val timeLimit: Array[String] = allHours.collect()
    //    println(timeLimit.getClass)

    var morning = 0
    var afternoon = 0
    var evening = 0
    var dawnTime = 0
    for(i<- 0 until timeLimit.length - 1){
      if( 6 <= timeLimit(i).toInt && timeLimit(i).toInt <= 12){
        morning += 1
      }
      else if(12 < timeLimit(i).toInt && timeLimit(i).toInt <= 18){
        afternoon += 1
      }else if(18 < timeLimit(i).toInt && timeLimit(i).toInt <= 23){
        evening += 1
      }else if(0 <= timeLimit(i).toInt && timeLimit(i).toInt <= 5){
        dawnTime += 1
      }

    }
    println("上午:"+morning)
    println("下午:"+afternoon)
    println("晚上:"+evening)
    println("凌晨:"+dawnTime)

    /**第二种写法*/
    //    for (i<- 0 until timeLimit.length - 1
    //         if 6 <= timeLimit(i).toInt && timeLimit(i).toInt <= 12) {
    //         println("上午"+":"+timeLimit(i))
    //    }

    /**第三种写法*/
    //    val hourLimit: RDD[String] = allHours.filter(hour => {
    //      hour <= "12" && hour >= "06"
    //    })
    //    hourLimit.foreach(println)

  }
}
结果展示
2、按照月份统计商品的评论数
- 代码展示
package luoSiFen

import org.apache.spark.{SparkConf, SparkContext}
import org.apache.spark.rdd.RDD

object monthCount {
  def main(args: Array[String]): Unit = {
    System.setProperty("hadoop.home.dir", "D:\\Class2\\Spark\\hadoop-3.3.0")

    val conf: SparkConf = new SparkConf()
    conf.setMaster("local").setAppName("count")
    val sc: SparkContext = new SparkContext(conf)
    val lines: RDD[String] = sc.textFile("D:\\Class2\\Data_views\\Notebook\\JDluosifen\\luoDeal.csv")

    /** 使用,进行分割 */
    val allTime: RDD[String] = lines.map(line => {
      line.split(",")(3)
    })


    /** 使用map获取具体月份 */
    val allHours: RDD[String] = allTime.map(line => {
      line.split("/")(1)
    })

    val monthTuple: RDD[(String, Int)] = allHours.map(month => {
      new Tuple2(month, 1)
    })

    val monthSum: RDD[(String, Int)] = monthTuple.reduceByKey((num1, num2) => {
      num1 + num2
    })
    monthSum.foreach(println)
  }
}
结果展示

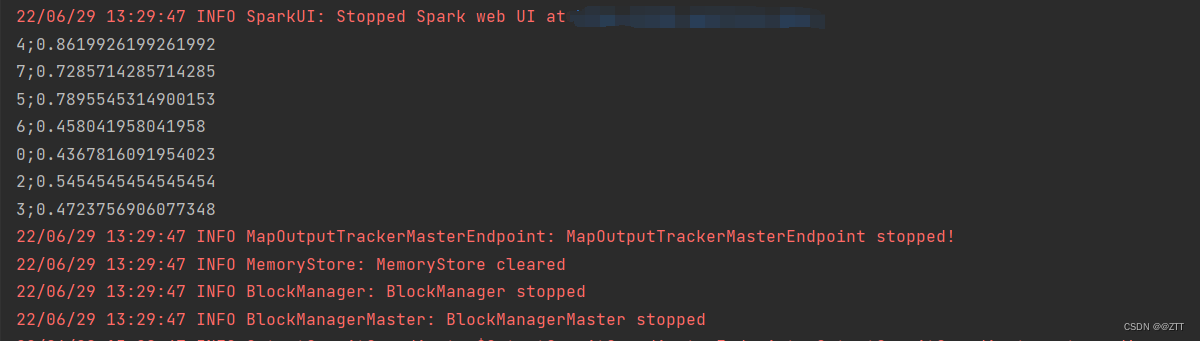
3、统计每种商品的好评率
- 代码展示
package luoSiFen

import org.apache.spark.rdd.RDD
import org.apache.spark.{SparkConf, SparkContext}

object luoGoodScore {
  def main(args: Array[String]): Unit = {
    System.setProperty("hadoop.home.dir", "D:\\Class2\\Spark\\hadoop-3.3.0")

    val conf: SparkConf = new SparkConf()
    conf.setMaster("local").setAppName("count")
    val sc: SparkContext = new SparkContext(conf)
    val lines: RDD[String] = sc.textFile("D:\\Class2\\Data_views\\Notebook\\JDluosifen\\luoDeal.csv")
    //    lines.foreach(println)

    /** 使用,进行分割 */
    val lineSplit: RDD[Array[String]] = lines.map(line => {
      line.split(",")
    })
    //    lineSplit.foreach(words=>{
    //      println(words(2))
    //    })//查看分割后的结果

    /** 查看score等于5的数据取出来 */
    val filterResult: RDD[Array[String]] = lineSplit.filter(words => {
      words(2) == "5"
    })
//      filterResult.foreach(words=>{
//        println(words(2))
//      })

    /** 使用map方法对商品名称进行逐个计数--->(1,1) (2,1) */
    val productTuples: RDD[(String, Int)] = filterResult.map(lineArray => {
      new Tuple2(lineArray(5), 1)
    })
        productTuples.foreach(println)

    /** 使用reduceByKey方法统计商品名称评分为5的总数量 */
    val goodScoreResult: RDD[(String, Int)] = productTuples.reduceByKey((num1, num2) => {
      num1 + num2
    })
    //    goodScoreResult.foreach(println)

    /** 使用map方法对商品名称进行逐个计数 */
    val allProductTuples: RDD[(String, Int)] = lineSplit.map(lineArray => {
      new Tuple2(lineArray(5), 1)
    })
//        allProductTuples.foreach(println)

    /** 使用reduceByKey方法统计各个商品所有评论的总数量 */
    val allScoreResult: RDD[(String, Int)] = allProductTuples.reduceByKey((num1, num2) => {
      num1 + num2
    })

    /** 好评除以总数量 */
    val goodArray: Array[(String, Int)] = goodScoreResult.collect()
    val allArray: Array[(String, Int)] = allScoreResult.collect()
    for (i <- 0 until goodArray.length - 1) {
//      println(goodArray(i)._1 + ";" + (goodArray(i)._2/ allArray(i)._2))
      println(goodArray(i)._1 + ";" + (goodArray(i)._2.toDouble / allArray(i)._2.toDouble))
    }
  }
}
结果展示
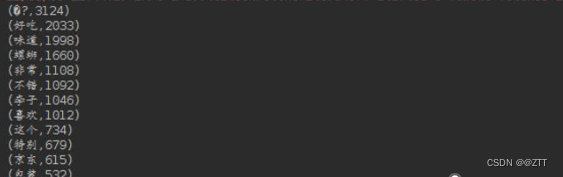
4、评论词频统计
- 代码展示
参考博客:https://blog.csdn.net/weixin_38255219/article/details/107207105
package luoSiFen
//参考博客 ---> https://blog.csdn.net/weixin_38255219/article/details/107207105
import org.apache.spark.{SparkConf, SparkContext}
import org.apache.spark.rdd.RDD

import java.util

object jiebaWordCount {
  def main(args: Array[String]): Unit = {
    System.setProperty("hadoop.home.dir", "D:\\Class2\\Spark\\hadoop-3.3.0")

    val conf: SparkConf = new SparkConf()
    conf.setMaster("local").setAppName("count")
    val sc: SparkContext = new SparkContext(conf)
    val lines: RDD[String] = sc.textFile("D:\\Class2\\Data_views\\Notebook\\JDluosifen\\luoDeal.csv")
    /** 使用,进行分割 */
    val lineSplit: RDD[Array[String]] = lines.map(line => {
      line.split(",")
    })
    //    lineSplit.foreach(words=>{
    //      println(words(2))
    //    })//查看分割后的结果

    /** 查看score等于5的数据取出来 */
    val filterResult: RDD[Array[String]] = lineSplit.filter(words => {
      words(2) == "5"
    })
    /** 查看score等于5的所有评论 */
    val scoreComments: RDD[String] = filterResult.map(word => {
      word(6)
    })
    //scoreComments.foreach(println)
    val scoreJieBa: RDD[util.ArrayList[String]] = scoreComments.map(comment => {
      import scala.collection.JavaConversions._
      val word_list = new JiebaSegmenter().sentenceProcess(comment.trim)
      val ls = new util.ArrayList[String]()
      ls.add(comment.trim)
      word_list.foreach(word => {
        if (word.length > 1) {
          ls.add(word)
        }
      })
      ls
    })
    val firstArray: RDD[AnyRef] = scoreJieBa.flatMap(words => {
      words.toArray()
    })
    val result: RDD[(AnyRef, Int)] = firstArray.map(words => {
      Tuple2(words, 1)
    })
    val allResult: RDD[(AnyRef, Int)] = result.sortBy(_._2, false)
    allResult.foreach(println)
  }
}
结果展示
五、数据可视化(pyecharts)
此模块是在jupyter里面进行!!!
导入原始数据
import pandas as pd
import numpy as np
data = pd.read_csv("luoJD.csv",index_col=0)
data = data.reset_index(drop=True)#对源数据进行重新索引
data
1、螺蛳粉词云统计图
from pyecharts import options as opts
from pyecharts.charts import WordCloud
import PIL.Image as Image
import jieba
# data['comment'].loc[0] #0代表第1行数据
commentAll = [] #先做一个空List,用来装下所有关键词
for i in range(6739): #已知一共6740条数据
    review = jieba.lcut(data['comment'].loc[i],cut_all=True)#cut_all=True其中cut_all=True表示采用全模型进行分词。即在文本中从不同的角度分词,变成不同的词语。
    commentAll.extend(review)


## 1、对出现的词语进行累计统计
counts= {}
cloud_data = []
excludes = {",",":","“","。","”","、",";"," ","!","?"," ","\n"}
for word in commentAll:
    if len(word) == 1: #不使用单字作为关键词
        continue
    elif word in excludes:
        continue
    else:
        wordAll = word
    counts[wordAll] = counts.get(wordAll, 0) + 1
## 2、输出频次前200的关键词
items = list(counts.items())
items.sort(key=lambda x:x[1],reverse = True)
for i in range(200):
    word, count = items[i]
    cloud_data.extend([word, count])
cloud_data

L = [] #做一个新的空List用来装下我们要用的元组
for i in range(399): #由于我们取Top200关键词+频次,所以一共是400个元素
    if i % 2 == 0:#偶数位[i]是我们需要的关键词,[i+1]即对应的频次
        a = cloud_data[i]
        b = cloud_data[i+1]
        tuple_x = tuple([cloud_data[i],cloud_data[i+1]])#List转元组
        L.append(tuple_x) #这里不能用extend,只能用append
c = (
    WordCloud(
        init_opts=opts.InitOpts(#对图表画布进行调整
        width="1100px",
        height="700px",
            )
    )
    .add("",
         L,
         word_gap = 0, #词语之间的间隔
         word_size_range=[10, 400], #词语字体大小范围
         rotate_step = 30, #词语旋转角度范围
         shape='diamond',
         width = 1000,
         height =1000,
         is_draw_out_of_bound = False
        )
    .set_global_opts(
        title_opts=opts.TitleOpts(
            title="京东螺蛳粉词云图",
            title_textstyle_opts=opts.TextStyleOpts(font_size=30)
        ),
    )
    .render("luosifenCount.html")
)
词云图展示

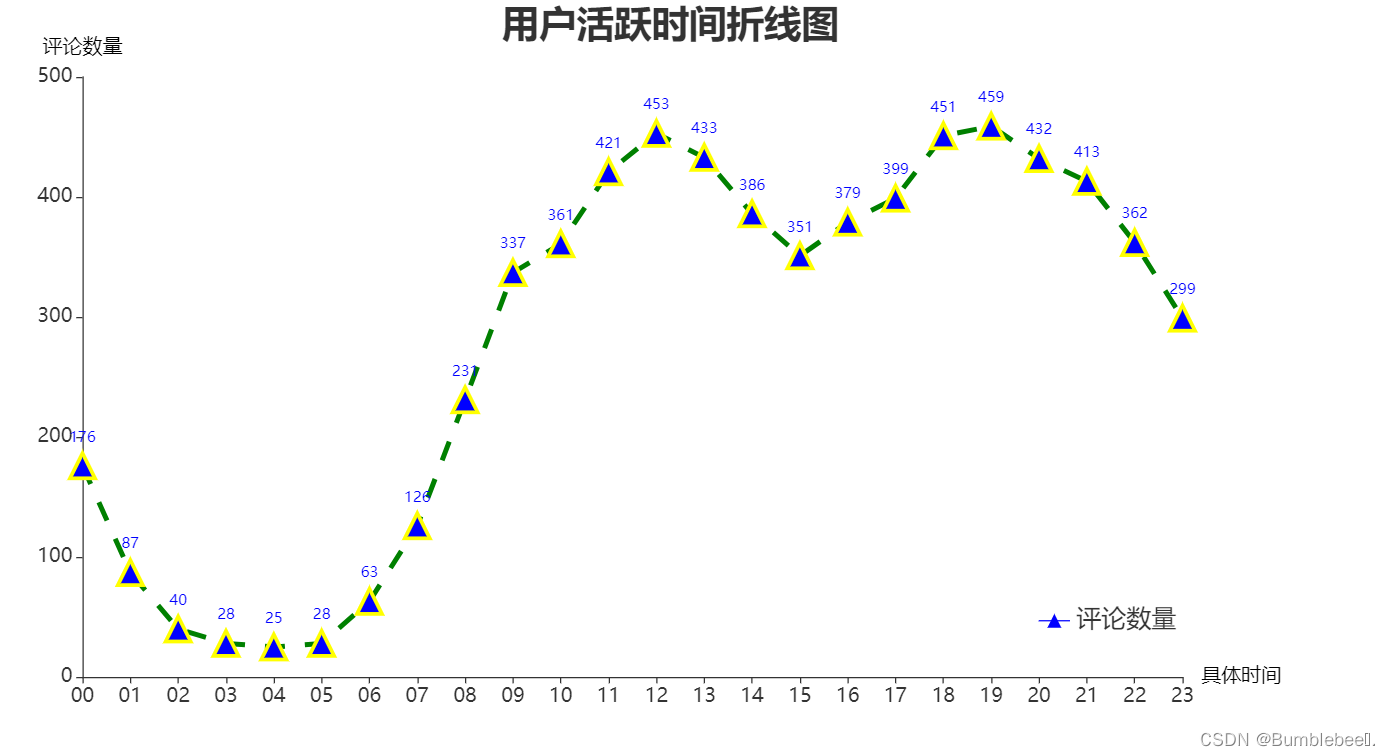
2、用户活跃时间折线图
import pyecharts.options as opts
from pyecharts.charts import Line
# data[['hours','minute','second']]=data.commentTime.str.split(':',2,True)
data['minute']=data.commentTime.str.split(':',2,True)[0]#将时间单独抽取作为一列
xName=data.groupby('minute').size().to_dict().keys()
yName=data.groupby('minute').size().to_dict().values()
c = (
    Line(
        init_opts=opts.InitOpts(#对图表画布进行调整
        width="1100px",
        height="600px",
            ))
    .add_xaxis(xName)
    .add_yaxis(
        "评论数量",
        yName,
        symbol="triangle",
        symbol_size=20,
        linestyle_opts=opts.LineStyleOpts(
            color="green", width=4, type_="dashed"),
        itemstyle_opts=opts.ItemStyleOpts(
            border_width=3, border_color="yellow", color="blue"
        ),
    )
    .set_global_opts(title_opts=opts.TitleOpts(title="用户活跃时间折线图",
                                               pos_top="0%",
                                               pos_left="40%",
                                               title_textstyle_opts=opts.TextStyleOpts(font_size=30)),
                     xaxis_opts=opts.AxisOpts(name="具体时间", type_="category",name_textstyle_opts=opts.TextStyleOpts(color='black',font_size=16),boundary_gap=False,axislabel_opts=opts.LabelOpts(font_size=16)),
                     yaxis_opts=opts.AxisOpts(name="评论数量",name_textstyle_opts=opts.TextStyleOpts(color='black',font_size=16),axislabel_opts=opts.LabelOpts(font_size = 16)),
                     legend_opts=opts.LegendOpts(pos_top="80%",pos_right="10%",textstyle_opts=opts.TextStyleOpts(font_size=20))
                    )
    .render("luosifenLine.html")
)
图形展示
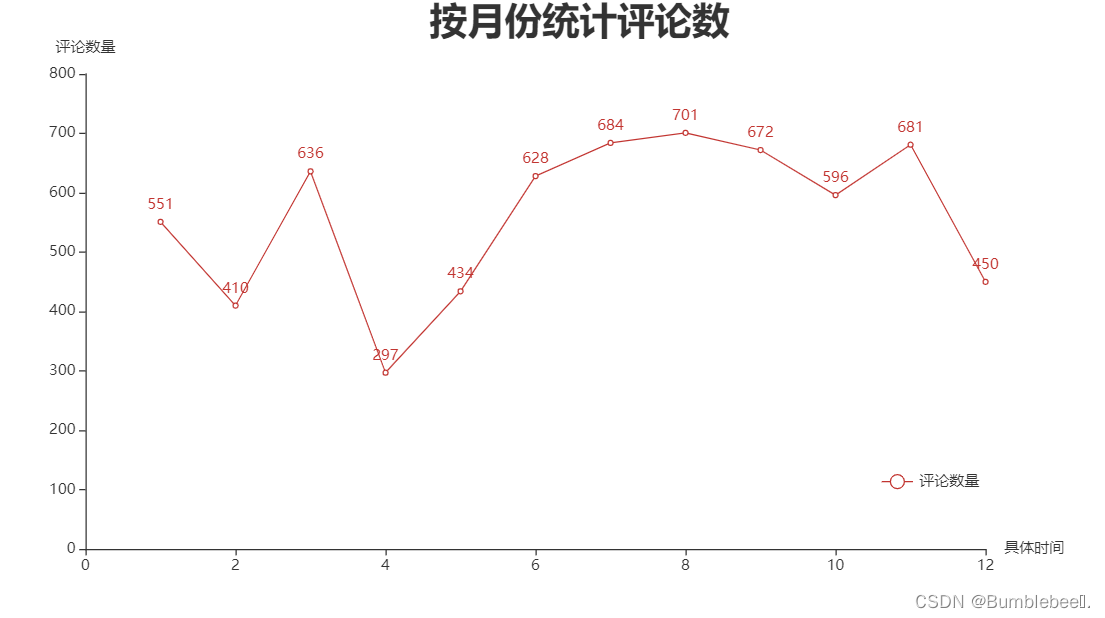
3、按月份统计评论数
import pyecharts.options as opts
from pyecharts.charts import Line
data['month']=data.commentDate.str.split('-',2,True)[1]#将月份单独抽取作为一列
xName=data.groupby('month').size().to_dict().keys()
yName=data.groupby('month').size().to_dict().values()
print(yName)
c = (
    Line()
    .add_xaxis(xName)
    .add_yaxis("评论数量", yName, is_connect_nones=True)
    .set_global_opts(title_opts=opts.TitleOpts(title="按月份统计评论数",pos_top="0%",
                                               pos_left="40%",
                                               title_textstyle_opts=opts.TextStyleOpts(font_size=30)),
                     xaxis_opts=opts.AxisOpts(name="具体时间"),
                     yaxis_opts=opts.AxisOpts(name="评论数量",is_show = True),
                     legend_opts=opts.LegendOpts(pos_top="75%",pos_right="10%"))
    .render("月份数量统计.html")
)
图形展示
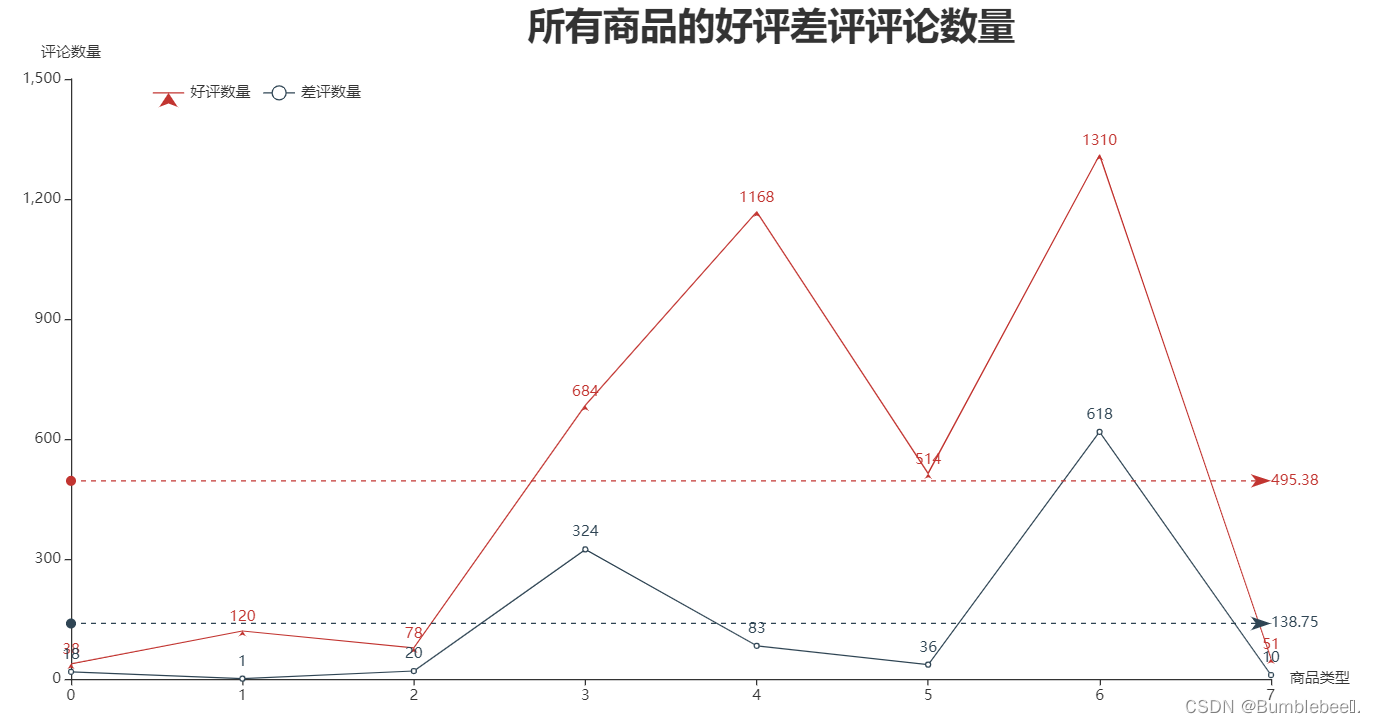
4、所有商品好评差评评论数量
import pyecharts.options as opts
from pyecharts.charts import Line
goodscore=data[data.score==5]#把评分等于5的数据全部筛选出来
badscore=data[data.score==1]#把评分等于1的数据全部筛选出来
xName=goodscore.groupby('goodsSort').size().to_dict().keys()
yName=goodscore.groupby('goodsSort').size().to_list()
y2Name=badscore.groupby('goodsSort').size().to_list()
c = (
    Line(
        init_opts=opts.InitOpts(#对图表画布进行调整
        width="1200px",
        height="600px",))
    .add_xaxis(xName)
    .add_yaxis(
        "好评数量",
        y_axis=yName,
        symbol="arrow",
        is_symbol_show=True,
        markline_opts=opts.MarkLineOpts(data=[opts.MarkLineItem(type_="average")]))
    .add_yaxis(
        "差评数量",
        y2Name,
        markline_opts=opts.MarkLineOpts(data=[opts.MarkLineItem(type_="average")]))
    .set_global_opts(title_opts=opts.TitleOpts(title="所有商品的好评差评评论数量",pos_top="0%",
                                               pos_left="40%",
                                               title_textstyle_opts=opts.TextStyleOpts(font_size=30)),
                    xaxis_opts=opts.AxisOpts(name="商品类型",is_show = True),
                    yaxis_opts=opts.AxisOpts(name="评论数量"),
                    legend_opts=opts.LegendOpts(pos_top="10%",pos_left="15%"))
    .render("commentScoreSum.html")
)
图形展示

六、总结
总的来说,这次项目总体的难度不算高,但是有个点是特别需要注意的,就是在存储数据的时候需要将评论放在最后一列,这样在分列的时候不会单独成一列,影响之后对数据的分析。
数据分析以及可视化这两个模块笔者呈现的只是最简单的一部分,所以读者可以从自己的观察角度分析,得出不同的结论。


 被折叠的 条评论
为什么被折叠?
被折叠的 条评论
为什么被折叠?
 到【灌水乐园】发言


