


一,
选择热门微博,爬取该条微博下的评论,进行分析与可视化。
二, 在爬取微博评论阶段,首先对该条微博的网页进行检查,找到了返回评论内容的 url,发现只需加入四个参数’uid’,’id’,”max_id”,与 max_id_type,就可以利用 request,一次获得 20 条评论信息。其中 uid 为用户 id,id 为微 博 id,均为固定值。而 max_id 与 max_id_type,则是在存储在 request 该 url 返回的数据当 中,用于获取下一次的 20 条评论信息。因此爬虫利用 request 进行循环爬取评论,每次循 环中利用 json 解析返回数据,获得参数 max_id 与 max_id_type,进入下一次爬取,直至 max_id 与 max_id_type 值为零,则评论爬取完毕,最后用 pandas 将所有信息进行存储。 而在分析与可视化中,主要采用 pandas,pyecharts,对所获得的所有评论信息进行分 析,处理,而后对所得的分析结果进行可视化。另外,还利用 matplotlib,wordcloud,jieba 对评论内容处理后得到词云,以及利用 snownlp 进行简单的情感分析。
#_*_coding=utf-8_*_
import time
import random
import re
import requests
from bs4 import BeautifulSoup
import pandas as pd

def fetchUrl(pid, max_id,max_id_type,cookie):

    # url
    url = "https://m.weibo.cn/comments/hotflow?"
    # 请求头
    user_agent_list = [
        "Opera/9.80 (X11; Linux i686; Ubuntu/14.10) Presto/2.12.388 Version/12.16",
        "Mozilla/5.0 (Linux; U; Android 2.2; en-gb; GT-P1000 Build/FROYO) AppleWebKit/533.1 (KHTML, like Gecko) Version/4.0 Mobile Safari/533.1",
        "Opera/9.80 (Windows NT 6.0) Presto/2.12.388 Version/12.14",
        "Mozilla/5.0 (Windows NT 6.0; rv:2.0) Gecko/20100101 Firefox/4.0 Opera 12.14",
        "Mozilla/5.0 (compatible; MSIE 9.0; Windows NT 6.0) Opera 12.14",
        "Opera/12.80 (Windows NT 5.1; U; en) Presto/2.10.289 Version/12.02",
        "Mozilla/5.0 (Windows NT 10.0; Win64; x64) AppleWebKit/537.36 (KHTML, like Gecko) Chrome/96.0.4664.110 Safari/537.36"
    ]
    headers = {
        "user-agent": "Mozilla/5.0 (Windows NT 10.0; Win64; x64) AppleWebKit/537.36 (KHTML, like Gecko) Chrome/96.0.4664.110 Safari/537.36",
        'cookie': cookie
    }
    headers["User-Agent"] = random.choice(user_agent_list)
    # 参数
    params = {
        "flow" : 0,
        "is_reload" : 1,
        "id" : pid,
        'mid': pid,
        "is_show_bulletin" : 2,
        "is_mix" : 0,
        "max_id" : max_id,
        "count" : 20,
        "uid" : 5994531722,
        'max_id_type': max_id_type

    }
    while 1:

        r= requests.get(url, headers = headers, params = params)
        if r.content:
            print('成功')
            js = r.json()
            if js['ok']==1:
                break
            else:
                headers["cookie"]=input("请输入新cookie:")

    return js


def parseJson(_json):

    data = _json["data"]
    max_id_type=data["max_id_type"]
    max_id = data["max_id"]
    commentData = []
    for item in data['data']:

        # 评论id
        comment_Id = item["id"]
        # 评论内容
        content = BeautifulSoup(item["text"], "html.parser").text
        # 评论时间
        created_at = item["created_at"]
        # 点赞数
        like_counts = item["like_count"]
        # 评论数
        total_number = item["total_number"]
        #ip属地
        userCity=item["source"][2:]
        # 评论者 id,name,city
        user = item["user"]
        usergender=user["gender"]
        userID = user["id"]
        userName = user["screen_name"]

        dataItem = [usergender,comment_Id, created_at, userID, userName,userCity, like_counts, total_number, content]
        #print(dataItem)
        commentData.append(dataItem)

    return commentData, max_id,max_id_type

def save_data(data, filename):
    dataframe = pd.DataFrame(data)
    dataframe.to_csv(filename, encoding='utf_8_sig', mode='a', index=False, sep=',', header=False )

def rand_sleep(second):
    print('sleeping...')
    time.sleep(random.randint(int(second / 2), int(second * 1.5)))

def main(pid, max_id,max_id_type,cookie):
    while 1:
        html = fetchUrl(pid, max_id,max_id_type,cookie)
        comments, max_id,max_id_type = parseJson(html)
        save_data(comments, filename)
        rand_sleep(2)
        print(max_id,max_id_type)
        if max_id == 0:
            print('结束')
            break

if __name__ == "__main__":
    a=input("输入微博网址:")#https://m.weibo.cn/detail/4793948122123215#comment
    pid = re.search(r'\d+',a)    # input("微博id:")
    uid = input("微博用户id:")  # 5994531722
    max_id = 0
    max_id_type=0
    cookie="SUB=_2A25P5VuODeRhGeNH4lYU8y_LyT6IHXVtJmXGrDV6PUJbkdCOLUn3kW1NSksGlDlxfN-boBDINHolw1OIR8WEE5h0; MLOGIN=1; _T_WM=33094101827; WEIBOCN_FROM=1110106030; M_WEIBOCN_PARAMS=oid=4793948122123215&luicode=20000061&lfid=4793948122123215&uicode=20000061&fid=4793948122123215; XSRF-TOKEN=fce04b; mweibo_short_token=43201c83c1"

    filename = "./weibocomments0.csv"   # 保存的文件名
    Header = [["性别","评论id", "发布时间", "用户id", "用户昵称", "用户城市", "点赞数", "回复数", "评论内容"]]
    save_data(Header, filename)

    main(pid, max_id,max_id_type,cookie)
三,结果:
(一),评论信息爬取结果:在爬取该条微博下共计 28858 条评论时,因微博可能不开 放所有评论,或其他原因,评论未全部爬取完,max_id 与 max_id_type 值即为零,多次爬 取,并数据去重后最终只获取了共计 17289 条评论信息,内容分别为用户性别,评论 id, 评论时间,用户 id,用户昵称,用户城市,点赞数,回复数,评论内容,评论日期。
(二),分析可视化结果
1,评论日期分布: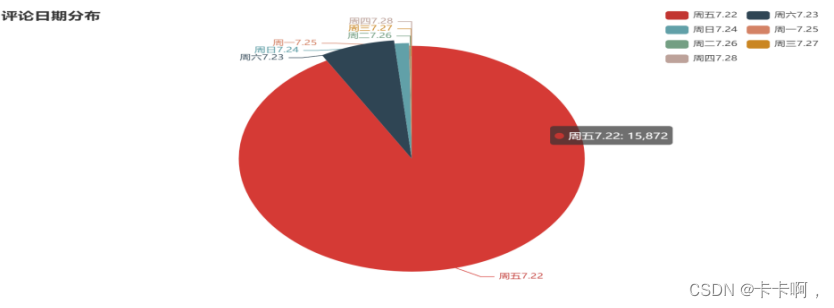
2,评论时间分布: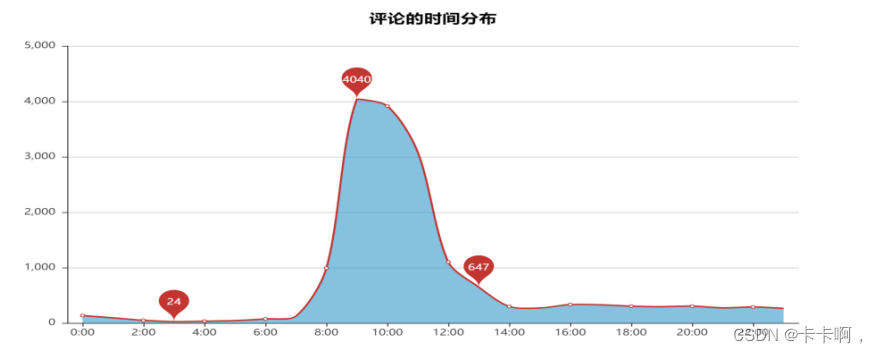
3,评论用户性别比例: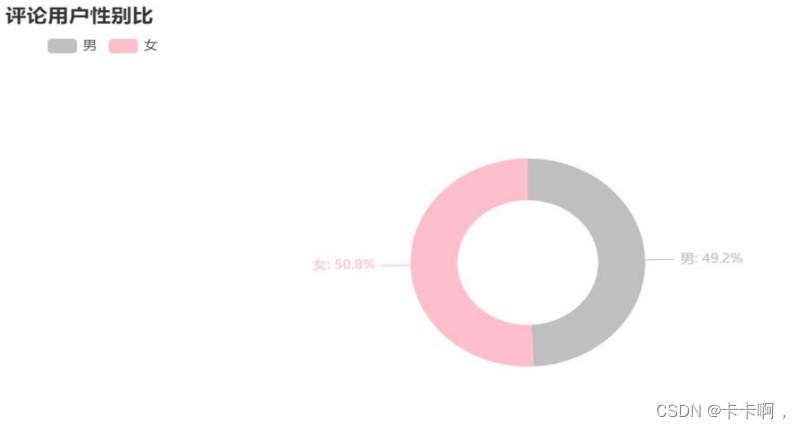
4,用户属地分布: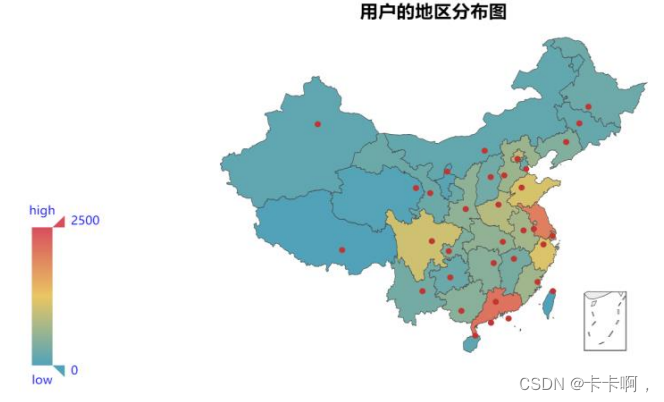
5,评论情感倾向分布: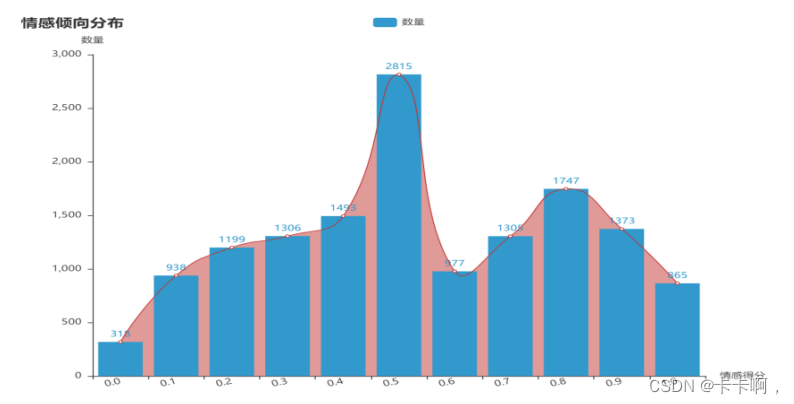 6,词云:
6,词云:
'''
import pandas as pd
#绘制用户性别比例
from pyecharts.charts import Pie
def g_gender():
    f=open("C:/Users/l'd/Desktop/可视化/py作业/gender.csv",'r',encoding='utf-8-sig')
    data=pd.read_csv(f,header=0)

    x=data.iloc[:,0]
    y=data.iloc[:,1]
    pie=(Pie().add("",[list(z) for z in zip(x,y)],radius=[60,100]).set_colors(["silver", "pink"]).set_global_opts(title_opts=opts.TitleOpts(title="评论用户性别比"),
    legend_opts=opts.LegendOpts(pos_top="30",pos_left="4%")).set_series_opts(label_opts=opts.LabelOpts(formatter="{b}: {c}%")))
    pie.render("性别比例.html")
'''

'''
import pandas as pd
import pyecharts.options as opts
from pyecharts.charts import Pie
#绘制评论日期:
def g_date():
    f=open('C:/Users/l'd/Desktop/可视化/py作业/result.csv','r',encoding='utf-8')
    data=pd.read_csv(f)
    x=data.iloc[:,0]
    y=data.iloc[:,1]
    pie=(Pie()
    .add("",[list(z) for z in zip(x,y)])
    .set_global_opts(title_opts=opts.TitleOpts(title="评论日期分布"),
    legend_opts=opts.LegendOpts(pos_left="80%")))
    pie.render("评论日期.html")
'''


'''
#评论时间分布图
import pandas as pd
from pyecharts  import Line
def g_time():
    df = pd.read_csv("C:/Users/l'd/Desktop/可视化/py作业/time.csv", header=0, encoding='utf-8-sig')
    print(df.info())
    df['time'] = [int(i.split(':')[0]) for i in df['时间']]
    # 分组汇总
    date_message = df.groupby(['time'])
    date_com = date_message['time'].agg(['count'])
    date_com.reset_index(inplace=True)
    # 绘制分布图
    attr = [str(j)+":00" for j in date_com['time']]
    v1 = date_com['count']
    line =Line("评论的时间分布", title_pos='center', title_top='10', width=900, height=500)
    line.add("", attr, v1, is_smooth=True, is_fill=True,
        area_color="#3299CC", is_xaxislabel_align=True,
        xaxis_min="dataMin", area_opacity=0.6,

        mark_point=['max', 'min', 'average'], mark_point_symbol="pin",
        mark_point_symbolsize=50,line_width=2,
        )

    line.render("评论的时间分布.html")
'''


'''
#用户属地分布
import pandas as pd
from pyecharts import Map
def g_map():
    df = pd.read_csv("C:/Users/l'd/Desktop/可视化/py作业/all_comments.csv", header=0, encoding='utf-8-sig')
    df['location'] = df['用户城市']#
    # 分组汇总
    loc_message = df.groupby(['location'])
    loc_com = loc_message['location'].agg(['count'])
    loc_com.reset_index(inplace=True)
    # 绘制地图
    a= [i for i in loc_com['location']]
    v= [i for i in loc_com['count']]

    map = Map("用户的地区分布图", title_pos='center', title_top=1)
    map.add("", a, v, maptype="china", is_visualmap=True, visual_text_color="blue", is_map_symbol_show=False, visual_range=[0, 2500])
    map.render('用户的地区分布图.html')

'''

'''
词云图
#
from wordcloud import WordCloud
import matplotlib.pyplot as plt
import pandas as pd
import random
import jieba
from PIL import Image
import numpy as np

# 设置文本随机颜色
def random_color_func(word=None, font_size=None, position=None, orientation=None, font_path=None, random_state=None):
    h, s, l = random.choice([(2,100,50),(62,89,36),(205,73,59)])
    return "hsl({}, {}%, {}%)".format(h, s, l)

def get_wc():
    # 读取信息
    df1= pd.read_csv("C:/Users/l'd/Desktop/可视化/py作业/all_comments.csv", header=0, encoding='utf-8-sig',quoting=3,error_bad_lines=False)
    df=df1['评论内容']
    df=df.dropna()
    words = pd.read_csv("C:/Users/l'd/Desktop/可视化/csstop.txt", encoding='utf-8=sig', sep='\t', names=['stopword'],quoting=3,error_bad_lines=False)
# 分词
    text = ''
    for line in df:
        text += ' '.join(jieba.cut(str(line), cut_all=False))
    # 停用词
    stopwords = set('')
    stopwords.update('事情','这是','说','地方','干','做','发生','事','拆','想','请','真','发现','太', '有人','干什么')
    stopwords.update(words['stopword'])
#背景
    backgroud_Image = np.array(Image.open("C:/Users/l'd/Desktop/可视化/z.png"))
    mask=backgroud_Image

    wc = WordCloud(
                    background_color='black',
                    mask=mask,
                    font_path='FZSTK.TTF',
                    max_words=2000,
                    max_font_size=500,
                    min_font_size=15,
                    color_func=random_color_func,
                    prefer_horizontal=1,
                    random_state=60,
                    stopwords=stopwords
                    )
    plt.imshow(wc)
    plt.axis('off')
    wc.to_file("词云.png")
    print('成功!')

'''
'''
#评论情感分布图:
import pandas as pd
from pyecharts.charts import Bar,Line
from pyecharts import options as opts
import snownlp

def feci():#计算
    df1= pd.read_csv("C:/Users/l'd/Desktop/可视化/py作业/all_comments.csv", header=0, encoding='utf-8-sig',quoting=3,error_bad_lines=False)
    df=df1.iloc[:,[1,8]]
    df.columns=['id','com1']
    df = df.drop_duplicates()
    df=df.dropna()
    df['com2'] = df['com1'].str.extract(r"([\u4e00-\u9fa5]+)")
    df = df.dropna()
    df['score'] = df["com2"].apply(lambda i:snownlp.SnowNLP(i).sentiments)
    dataframe = pd.DataFrame(df)
    dataframe.to_csv("./s.csv", encoding='utf_8_sig', mode='a', index=False, sep=',', header=0 )


def fl(i):
    x=float(i)
    return format(x,"0.1f")

def xt():
    df1 = pd.read_csv("C:/Users/l'd/Desktop/可视化/s.csv", header=0, encoding='utf-8-sig')
    df=df1.iloc[:,[0,3]]
    df.columns=['id','com']
    df['s'] = [fl(i) for i in df['com']]
# 分组汇总
    date_message = df.groupby(['s'])
    date_c= date_message['s'].agg(['count'])
    date_c.reset_index(inplace=True)
    i=[x for x in date_c['count']]
    e=[x for x in date_c['s']]

    bar =Bar(init_opts=opts.InitOpts(width="800px", height="600px"))
    bar.add_xaxis(e)
    bar.add_yaxis(series_name='数量',
                  y_axis=i,
                  label_opts=opts.LabelOpts(is_show=True),
                  itemstyle_opts=opts.ItemStyleOpts('black')
                  )
    bar.set_global_opts(title_opts=opts.TitleOpts(title="情感倾向分布"),
                        tooltip_opts=opts.TooltipOpts(is_show=True, trigger="axis"),
                        xaxis_opts=opts.AxisOpts(name='情感得分',axislabel_opts={"rotate": 16},
                        axispointer_opts=opts.AxisPointerOpts(is_show=True, type_="shadow")),
                        yaxis_opts=opts.AxisOpts(
                        name="数量",
                        max_=3000,
                        #axislabel_opts=opts.LabelOpts(formatter="{value} ")
                        ))
    # 折线图
    line = Line()
    line.add_xaxis(e)
    line.add_yaxis(
                    series_name='数量',
                    itemstyle_opts=opts.ItemStyleOpts("#E6E6FA"),
                    y_axis=i,
                    is_smooth=True,
                    label_opts=opts.LabelOpts(is_show=False),
                    areastyle_opts=opts.AreaStyleOpts(opacity=0.5),
                    z=2
                       )

    # 把折线图叠到条形图上面
    bar.overlap(line).render_notebook()
    # 保存为html文件.overlap(line)
    bar.render("C:/Users/l'd/Desktop/可视化/py作业/1情感分布.html")

if __name__=="__main__":
    feci()
    xt()
    '''


 1050
1050


 被折叠的 条评论
为什么被折叠?
被折叠的 条评论
为什么被折叠?
 到【灌水乐园】发言


