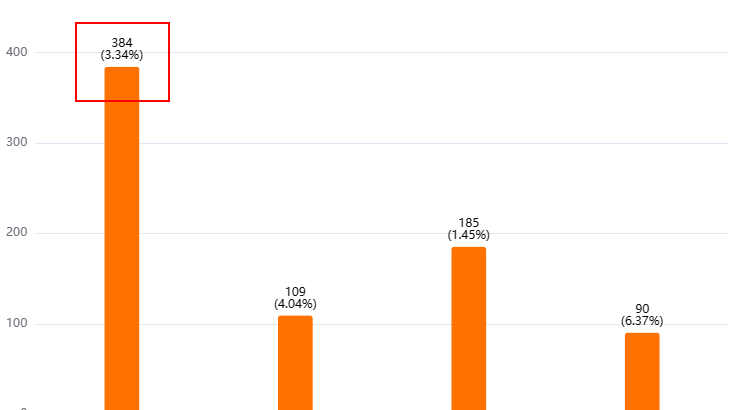
Echarts柱状图(顶部和内部的数值显示)/(内部数值的百分比计算)/(顶部显示多行数据)/(柱体圆角)

先看效果:

如何实现顶部和内部的数值显示并且计算出两个柱状图的百分比:

首先是全部源码:

<div ref="country" id="country" class="drawing"></div>

<script setup>
    // 引入图表
    import * as echarts from "echarts";
    const country = ref(null);

    // 在项目中countryEcharts里面的data是我请求过来的数据,这里我就用json数据模拟了
    // function countryEcharts(data) {
    function countryEcharts() {
    // 后台模拟数据
    let data = {
        countryType: [
            {name: '总体',count:897},
            {name: '个人',count:331},
            {name: '法人',count:83},
            {name: '自然人/法人',count:483},
        ],
        unCountryType: [
            {name: '总体',count:384},
            {name: '个人',count:109},
            {name: '法人',count:185},
            {name: '自然人/法人',count:90},
        ],
    }
    const dataList = []; // x轴标签
    const dataList1 = []; // 国家级
    const dataList2 = []; // 我省覆盖
    data.countryType.forEach(item => {
        dataList.push(item.name) // x轴标签
        dataList1.push(item.count) // 国家级
    })
    data.unCountryType.forEach(item => {
        dataList2.push(item.count) // 我省覆盖
    })
    const myChart = echarts.init(country.value);
    myChart.setOption({
        tooltip: {
            trigger: 'axis',
            axisPointer: {
                type: 'shadow'
            }
        },
        legend: {
            data: ['国家级','我省覆盖']
        },
        color: ['#73a0fa','#ff7100'],
        grid: {
            left: '2%',
            right: '2%',
            top: '14%',
            bottom: '3%',
            containLabel: true
        },
        xAxis: {
            type: 'category',
            data: dataList,
            axisLine:{
                lineStyle:{
                    color: '#7e7b7b' // x轴颜色
                }
            },
            axisTick: { show: false }, // x轴坐标刻度样式(显示或者隐藏)
            axisLabel: {
                interval: 0,// 使x轴上的文字显示完全
            },
        },
        yAxis: {
            type: 'value'
        },
        series: [
            {
                barWidth: '30%',
                name: '国家级',
                type: 'bar',
                data: dataList1,
                //显示数值
                /*itemStyle: {
                    normal: {
                        label: {
                            show: true, //开启显示
                            position: 'inside', //内部显示
                            formatter:function (params) {
                                return params.value/100 + '%';
                            },
                            textStyle: {
                                //数值样式
                                color: 'black',
                                fontSize: 12,
                            },
                        },
                    },
                },*/
                markPoint: {
                    symbol: 'image://http://example.website/a/b.png',
                    data: [
                        {coord: [0,dataList1[0]]},{coord: [1,dataList1[1]]},{coord: [2,dataList1[2]]},{coord: [3,dataList1[3]]}
                    ],
                    label: {
                        show: true, //开启显示
                        formatter:function (params) {
                            // dataIndex是当前柱状图的索引
                            return dataList1[params.dataIndex];
                        },
                    },
                    symbolOffset: [0, '-30%'] // 偏移量
                }
            },
            {
                barWidth: '30%',
                name: '我省覆盖',
                type: 'bar',
                data: dataList2,
                //显示数值
                itemStyle: {
                    normal: {
                        label: {
                            show: true, //开启显示
                            position: 'inside', //内部显示
                            formatter:function (params) {
                                // dataIndex是当前柱状图的索引
                                let num = (dataList1[params.dataIndex] + dataList2[params.dataIndex])/dataList2[params.dataIndex]
                                num = Math.round(num*100)/100 // 保留两位小数,不四舍五入
                                return num + '%';
                            },
                            textStyle: {
                                //数值样式
                                color: 'black',
                                fontSize: 12,
                            },
                        },
                    },
                },
                markPoint: { // 标注
                    symbol: 'image://http://example.website/a/b.png',
                    data: [
                        {coord: [0,dataList2[0]]},{coord: [1,dataList2[1]]},{coord: [2,dataList2[2]]},{coord: [3,dataList2[3]]}
                    ],
                    label: {
                        show: true, //开启显示
                        formatter:function (params) {
                            // dataIndex是当前柱状图的索引
                            return dataList2[params.dataIndex];
                        },
                    },
                    symbolOffset: [0, '-30%'] // 偏移量
                }
            }
        ]
    })
}
<script/>

蓝色柱子只在顶部显示数值(两种方法):

series: [
            {
                barWidth: '30%',
                name: '国家级',
                type: 'bar',
                data: dataList1,
                /*
                itemStyle这种比较简单,直接通过position属性设置对应的位置就可以了
                */
                itemStyle: {
                    normal: {
                        label: {
                            show: true, //开启显示
                            position: 'top', //顶部显示
                            textStyle: {
                                //数值样式
                                color: 'black',
                                fontSize: 12,
                            },
                        },
                    },
                },
                /*
                下面这种是通过markPoint图表标注的方法来实现的
                */
                /*markPoint: { // 图表标注
                    symbol: 'image://http://example.website/a/b.png',// 标注图形
                    // data是标注的数据数组
                    data: [
                        // coord是标注坐标[x,y]
                        // x轴的值就是根据你dataList1数组的索引
                        // y轴的值就是根据你dataList1数组索引所对应的值(在这里相当于y轴的高度)
                        {coord: [0,dataList1[0]]},{coord: [1,dataList1[1]]},{coord: [2,dataList1[2]]},{coord: [3,dataList1[3]]}
                    ],
                    label: {
                        show: true, //开启显示
                        formatter:function (params) {  // 这里就是标注所显示的值
                            // dataIndex是当前柱状图的索引
                            return dataList1[params.dataIndex];
                        },
                    },
                    symbolOffset: [0, '-30%'] // 标注偏移量
                }*/
            }
        ]

橘色柱子要在顶部和内部都要显示并且内部显示百分比:

series: [
            {
                barWidth: '30%',
                name: '我省覆盖',
                type: 'bar',
                data: dataList2,
                //itemStyle对象里面显示的是内部的数据
                itemStyle: {
                    normal: {
                        label: {
                            show: true, //开启显示
                            position: 'inside', //内部显示
                            formatter:function (params) {
                                // dataIndex是当前柱状图的索引
                                // 这里柱状图的数值是dataList1(国家级数量)+dataList2(我省覆盖)的和除以dataList2(我省覆盖)
                                let num = (dataList1[params.dataIndex] + dataList2[params.dataIndex])/dataList2[params.dataIndex]
                                num = Math.round(num*100)/100 // 保留两位小数,不四舍五入
                                return num + '%';
                            },
                            textStyle: {
                                //数值样式
                                color: 'black',
                                fontSize: 12,
                            },
                        },
                    },
                },
                // markPoint对象里面是顶部的数据
                markPoint: { // 图表标注
                    symbol: 'image://http://example.website/a/b.png',// 标注图形
                    data: [
                        //coord是标注坐标
                        {coord: [0,dataList2[0]]},{coord: [1,dataList2[1]]},{coord: [2,dataList2[2]]},{coord: [3,dataList2[3]]}// 标注坐标
                    ],
                    label: {
                        show: true, //开启显示
                        formatter:function (params) {
                            // dataIndex是当前柱状图的索引
                            return dataList2[params.dataIndex];
                        },
                    },
                    symbolOffset: [0, '-30%'] // 标注偏移量
                }
            }
        ]

在 markPoint 图表标注中通过 formatter 显示数值要用 dataList2[params.dataIndex] 来获取.

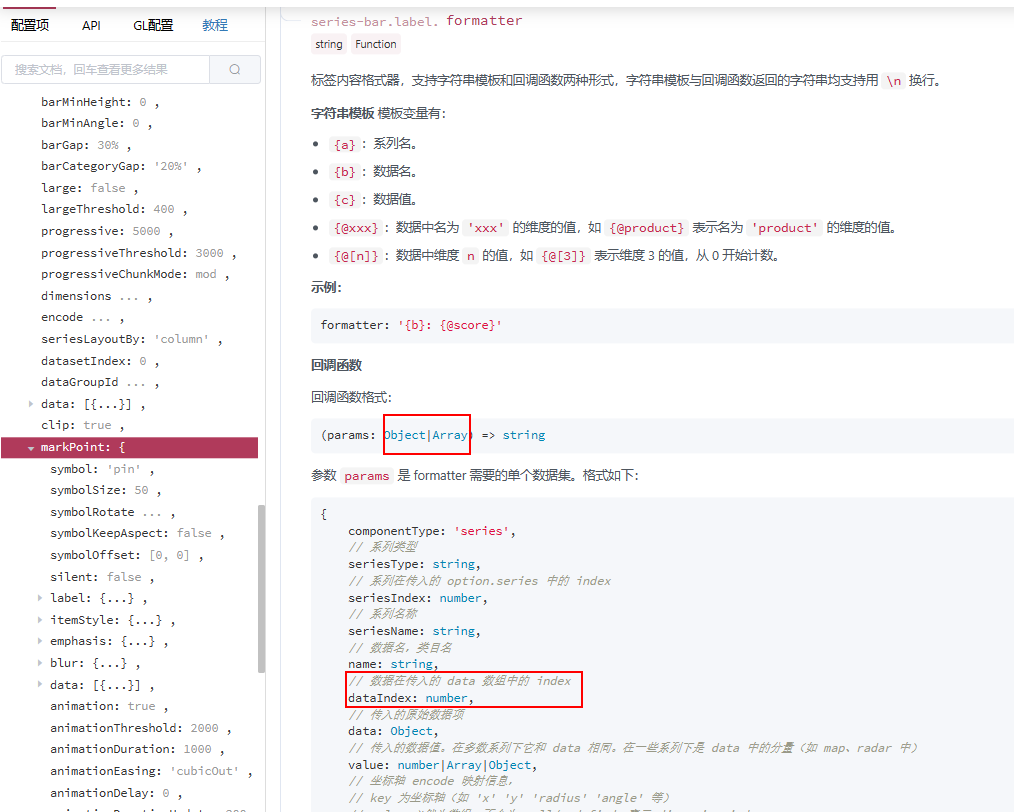
Documentation - Apache ECharts

顶部显示多行数据:

series: [
            {
                barWidth: '20%', // 柱子宽度
                data: dataList2,
                type: 'bar',
                itemStyle: { // 显示数值
                    normal: {
                        borderRadius: [3, 3, 0, 0], // 圆角
                        label: {
                            show: true, //开启显示
                            position: 'top', //顶部显示
                            formatter:function (params) {
                                // dataIndex是当前柱状图的索引
                                // 这里柱状图的数值是dataList1(国家级数量)+dataList2(我省覆盖)的和除以dataList2(我省覆盖)
                                let num = (dataList1[params.dataIndex] + dataList2[params.dataIndex])/dataList2[params.dataIndex]
                                num = Math.round(num*100)/100 // 保留两位小数,不四舍五入
                                let num1 = dataList2[params.dataIndex]
                                // num(百分比) num1(数值)
                                return num1 + '\n' + '(' + num + '%)';// 用 '\n' 换行
                            },
                            textStyle: {
                                color: 'black',
                                fontSize: 12,
                            },
                        },
                    },
                }
            }
        ]

柱体圆角:

itemStyle:{
    normal: {
        borderRadius: [3, 3, 0, 0], // 左上 右上 右下 左下
    }
}

  • 4
    点赞
  • 11
    收藏
    觉得还不错? 一键收藏
  • 打赏
    打赏
  • 0
    评论

“相关推荐”对你有帮助么?

  • 非常没帮助
  • 没帮助
  • 一般
  • 有帮助
  • 非常有帮助
提交
评论
添加红包

请填写红包祝福语或标题

红包个数最小为10个

红包金额最低5元

当前余额3.43前往充值 >
需支付:10.00
成就一亿技术人!
领取后你会自动成为博主和红包主的粉丝 规则
hope_wisdom
发出的红包

打赏作者

开发那点事儿~

你的鼓励将是我创作的最大动力

¥1 ¥2 ¥4 ¥6 ¥10 ¥20
扫码支付:¥1
获取中
扫码支付

您的余额不足,请更换扫码支付或充值

打赏作者

实付
使用余额支付
点击重新获取
扫码支付
钱包余额 0

抵扣说明:

1.余额是钱包充值的虚拟货币,按照1:1的比例进行支付金额的抵扣。
2.余额无法直接购买下载,可以购买VIP、付费专栏及课程。

余额充值