


1、下载插件
cnpm install echarts
cnpm install echarts-wordcloud
2、在外部文件夹中创建vue文件(SonCloud.vue),写词云图基本配置
<template>
  <div id="charts-content"></div>
</template>

<script setup>
import * as echarts from 'echarts';
import 'echarts-wordcloud';
import { onMounted,defineProps } from "vue";
// 引入 lodash 中的 merge、深克隆
import merge from 'lodash/merge';


const props = defineProps({
  options:{
    type : [String,Number,Array,Object]
  }
})


// 词云图默认属性
const defaultSeries = [{
  type: 'wordCloud',
  shape: 'star',
  keepAspect: false,
  left: 'center',
  top: 'center',
  width: '100%',
  height: '100%',
  right: null,
  bottom: null,
  // 词云文本大小范围,  默认为最小12像素,最大60像素
  sizeRange: [12, 60],
  // 词云文字旋转范围和步长。 文本将通过旋转在[-90,90]范围内随机旋转步骤45
  // 如果都设置为 0 , 则是水平显示
  rotationRange: [-90, 90],
  rotationStep: 45,
  /**
   * 词间距, 距离越大,单词之间的间距越大, 单位像素
   * 这里间距太小的话,会出现大词把小词套住的情况,比如一个大的口字,中间会有比较大的空隙,这时候他会把一些很小的字放在口字里面,这样的话,鼠标就无法选中里面的那个小字
   */
  gridSize: 8,
  // 设置为true可以使单词部分在画布之外绘制, 允许绘制大于画布大小的单词
  drawOutOfBound: false,
  /**
   * 布局的时候是否有动画
   * 注意:禁用时,当单词较多时,将导致UI阻塞。
   */
  layoutAnimation: true,
  // 这是全局的文字样式,相对应的还可以对每个词设置字体样式
  textStyle: {
    fontFamily: 'sans-serif',
    fontWeight: 'bold',
    // 颜色可以用一个函数来返回字符串
    color: function () {
      // 随机颜色
      return (
          'rgb(' +
          [
            Math.round(Math.random() * 160),
            Math.round(Math.random() * 160),
            Math.round(Math.random() * 160),
          ].join(',') +
          ')'
      )
    },
  },
  // 鼠标hover的特效样式
  emphasis: {
    focus: 'self',
    textStyle: {
      textShadowBlur: 10,
      textShadowColor: '#999'
    }
  },
  data: []
}]
let seriesData = props.options.series;
const series = merge({}, defaultSeries[0], seriesData[0]) // {}表示合并后的新对象,可以传入一个空对象作为初始值

function DrawWordCloud() {
  // 词云
  let mychart = echarts.init(document.getElementById("charts-content")) // 可以设置主题色'dark'
  mychart.setOption({
    series: series
  })
}

onMounted(() => {
  DrawWordCloud()
})
</script>
3、引入词云图文件
<template>
<div class="bestsellers-container">
<chart-word-cloud :options="state.chartOptions"></chart-word-cloud>
</div>
</template>
<script setup>
import ChartWordCloud from './SonCloud.vue'
import { onMounted, reactive } from 'vue'
const state = reactive({
chartOptions: {
series: [{
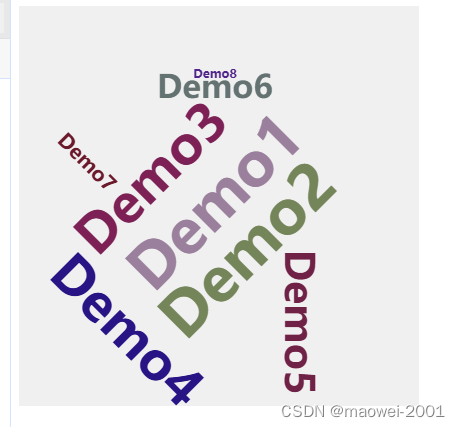
data: [
{ name: 'Demo1', value: 30},
{ name: 'Demo2',value: 30},
{ name: 'Demo3', value: 28 },
{ name: 'Demo4', value: 28 },
{ name: 'Demo5', value: 25 },
{ name: "Demo6", value: 23 },
{ name: 'Demo7', value: 20 },
{ name: 'Demo8', value: 18 },
],
}],
},
})
</script>
<style scoped>
.bestsellers-container {
height: 400px;
width:400px;
background: #f0f0f0;
}
#charts-content {
/* 需要设置宽高后才会显示 */
width: 100%;
height: 100%;
}
</style>


 1021
1021


 被折叠的 条评论
为什么被折叠?
被折叠的 条评论
为什么被折叠?
 到【灌水乐园】发言


