


目录
注:该笔记是学习b站上 MATLAB GUI教学视频而记录的笔记,笔记来源于本人。若有侵权,请联系本人删除,谢谢。若有错误,欢迎在评论区里指出。
一、实例效果
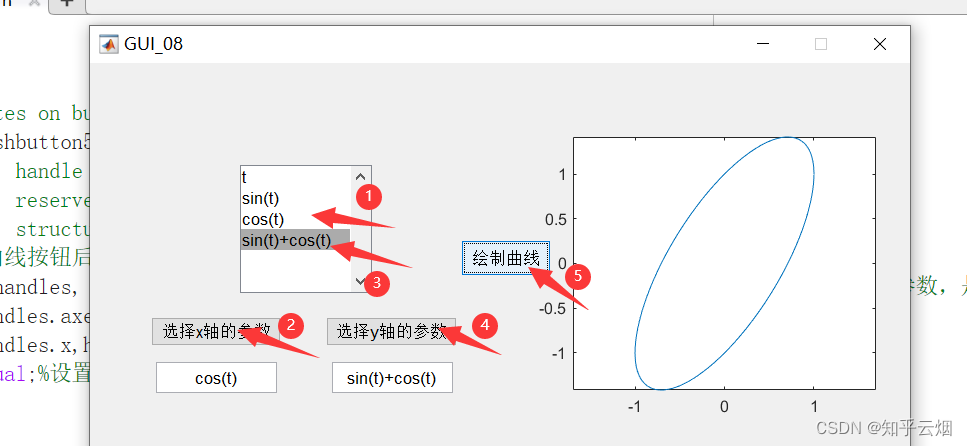
如图所示,界面左侧是一个列表框(ListBox),可以通过更改选项来调整所选择的函数。可选择其中一个函数作为x轴参数,另一个函数作为y轴参数。当x、y的参数方程选择好以后,点击绘制曲线,就可以在右边的坐标系中显示出对应的函数曲线。
二、步骤
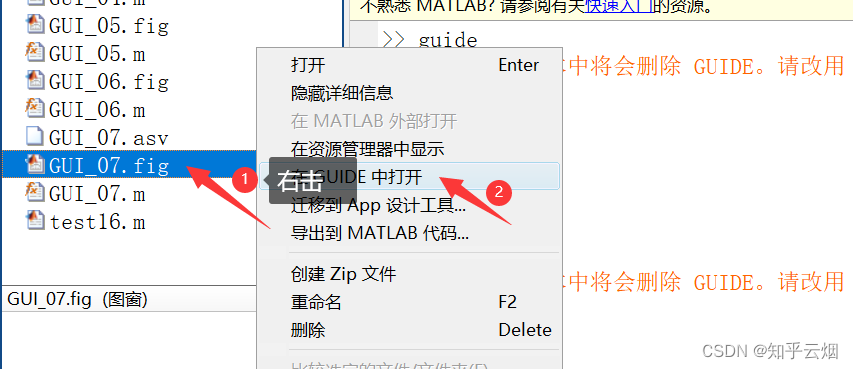
1.打开上一个博客的GUI。
注:本人为了保留上一个博客的GUI,按照上一个博客再做了一个相同的GUI。
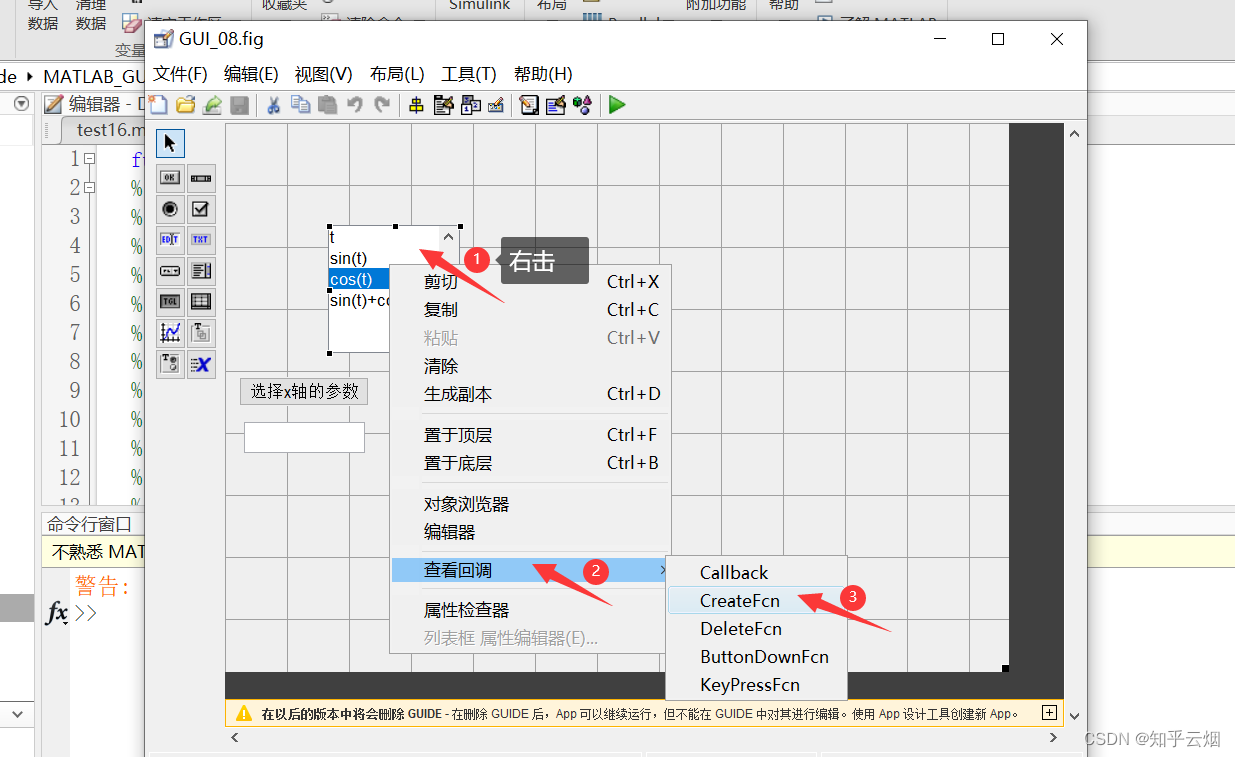
2.进入列表框(ListBox)的Crate Function中(该函数是在 创建控件时 执行的,常用于设置背景,不像回调函数那样可以通过控件直接触发),编写创建函数。
代码如下:
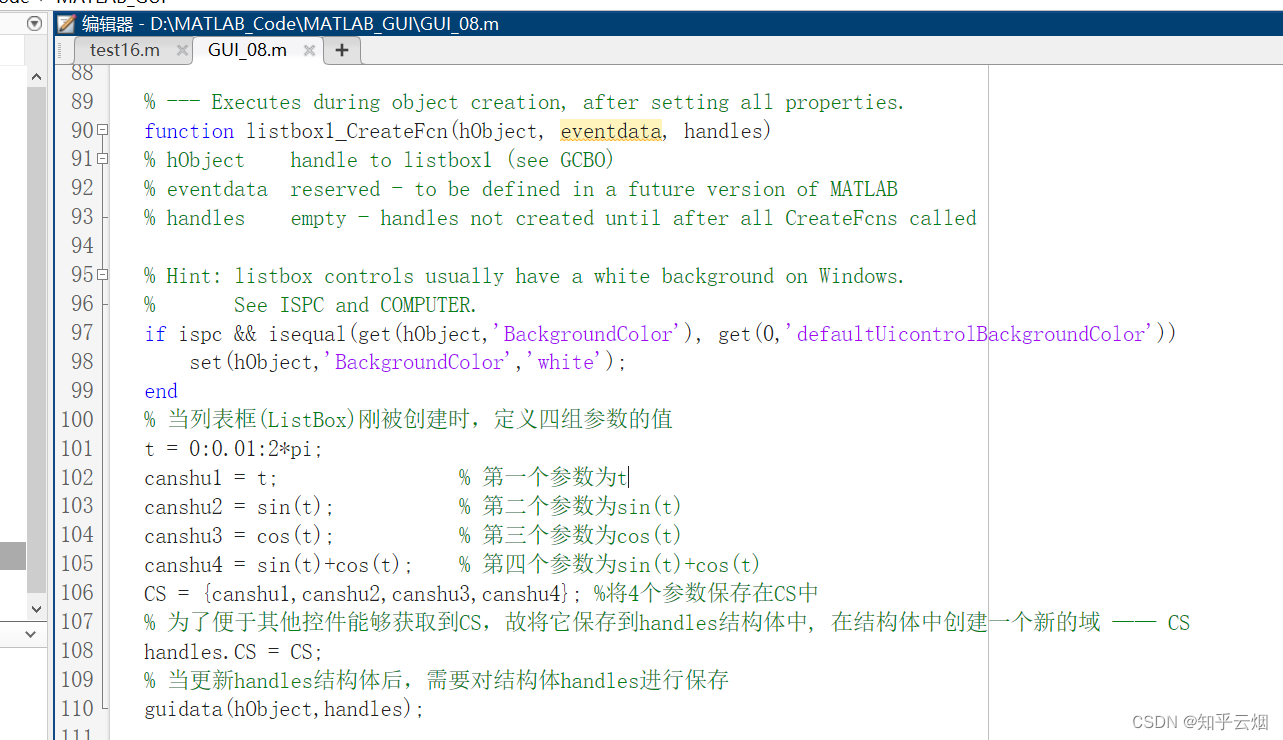
该创建函数的作用是:在创建列表框(ListBox)时,就定义了参数t、sin(t)、cos(t)、sin(t)+cos(t)的取值范围,并存储在结构体handles中的变量CS中。
% --- Executes during object creation, after setting all properties.
function listbox1_CreateFcn(hObject, eventdata, handles)
% hObject    handle to listbox1 (see GCBO)
% eventdata  reserved - to be defined in a future version of MATLAB
% handles    empty - handles not created until after all CreateFcns called

% Hint: listbox controls usually have a white background on Windows.
%       See ISPC and COMPUTER.
if ispc && isequal(get(hObject,'BackgroundColor'), get(0,'defaultUicontrolBackgroundColor'))
    set(hObject,'BackgroundColor','white');
end
% 当列表框(ListBox)刚被创建时,定义四组参数的值
t = 0:0.01:2*pi;
canshu1 = t;                % 第一个参数为t
canshu2 = sin(t);           % 第二个参数为sin(t)
canshu3 = cos(t);           % 第三个参数为cos(t)
canshu4 = sin(t)+cos(t);    % 第四个参数为sin(t)+cos(t)
CS = {canshu1,canshu2,canshu3,canshu4}; %将4个参数保存在CS中
% 为了便于其他控件能够获取到CS,故将它保存到handles结构体中, 在结构体中创建一个新的域 —— CS
handles.CS = CS;
% 当更新handles结构体后,需要对结构体handles进行保存
guidata(hObject,handles);
3.进入按钮“选择x的参数”的回调函数中,获取x轴的数据。
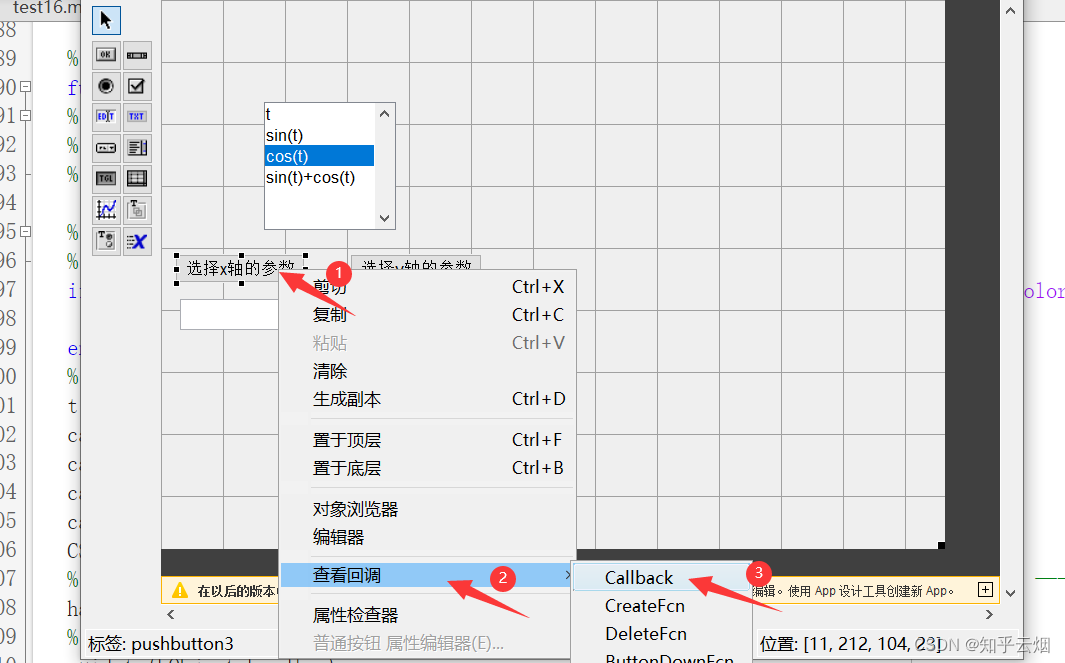
代码如下:
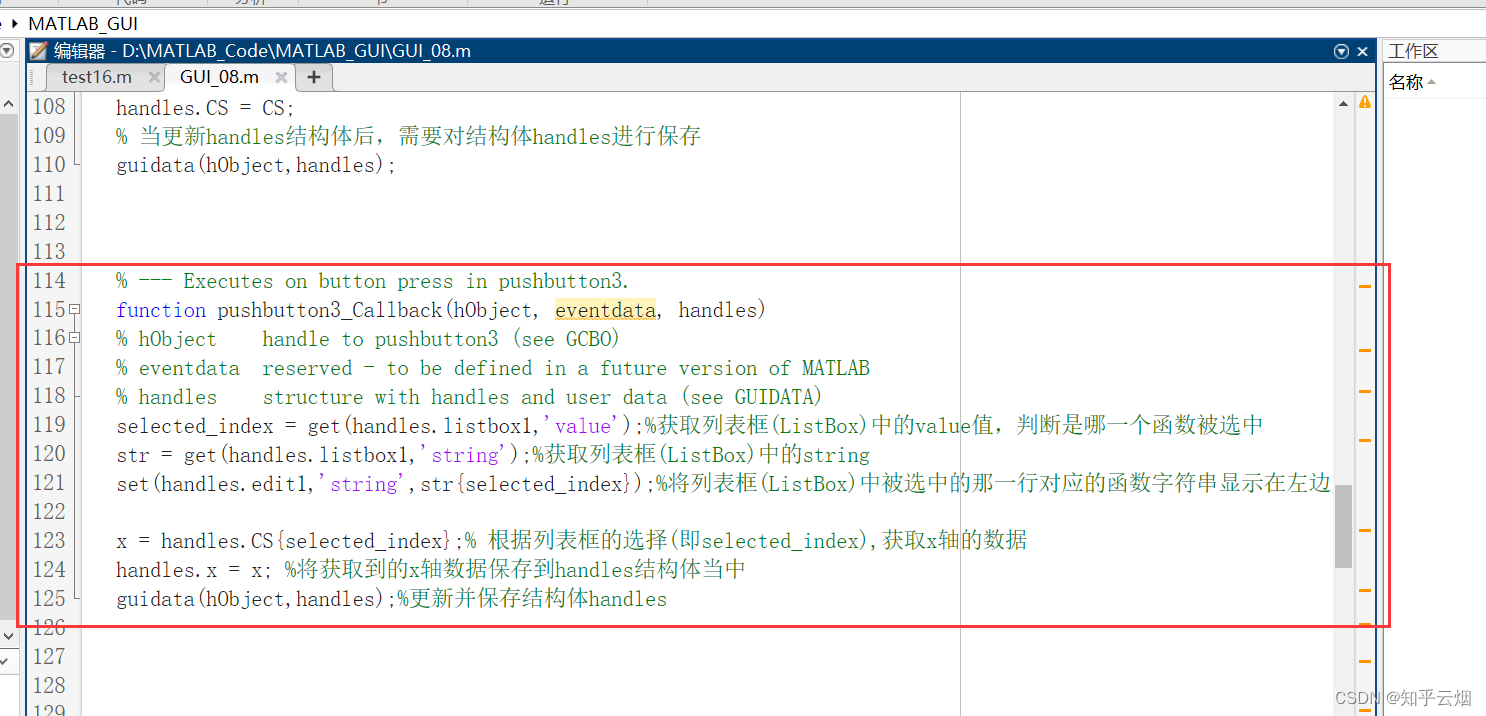
% --- Executes on button press in pushbutton3.
function pushbutton3_Callback(hObject, eventdata, handles)
% hObject    handle to pushbutton3 (see GCBO)
% eventdata  reserved - to be defined in a future version of MATLAB
% handles    structure with handles and user data (see GUIDATA)
selected_index = get(handles.listbox1,'value');%获取列表框(ListBox)中的value值,判断是哪一个函数被选中
str = get(handles.listbox1,'string');%获取列表框(ListBox)中的string
set(handles.edit1,'string',str{selected_index});%将列表框(ListBox)中被选中的那一行对应的函数字符串显示在左边那个可编辑文本框中

x = handles.CS{selected_index};% 根据列表框的选择(即selected_index),获取x轴的数据
handles.x = x; %将获取到的x轴数据保存到handles结构体当中
guidata(hObject,handles);%更新并保存结构体handles
4.进入按钮“选择y的参数”的回调函数中,获取y轴的数据。
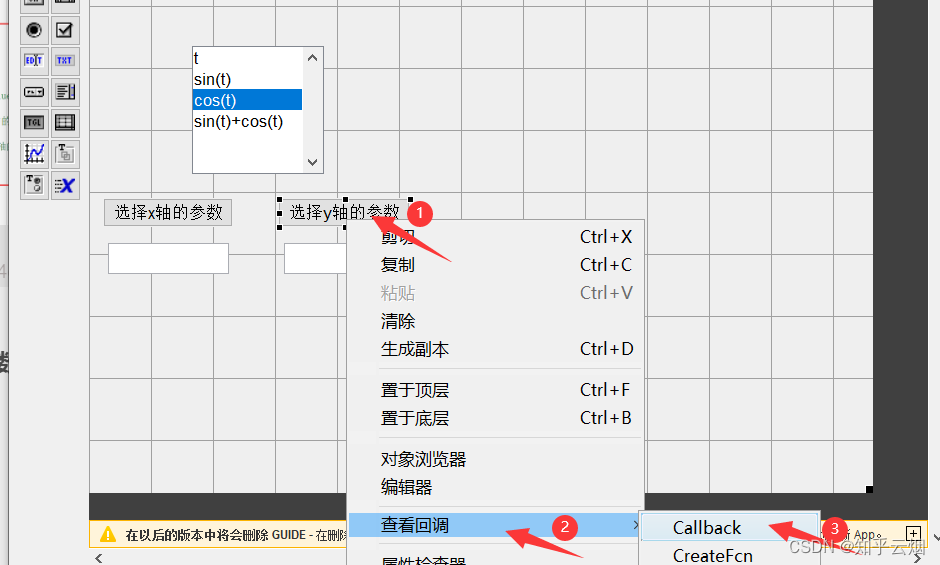
代码如下:
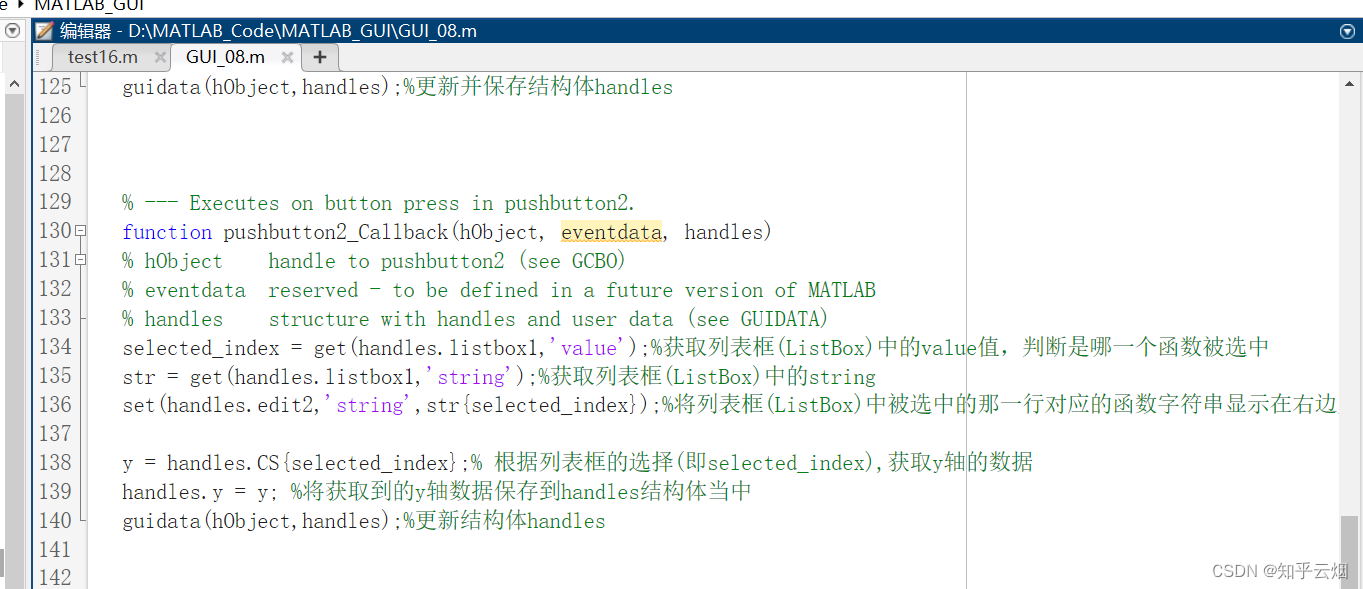
% --- Executes on button press in pushbutton2.
function pushbutton2_Callback(hObject, eventdata, handles)
% hObject    handle to pushbutton2 (see GCBO)
% eventdata  reserved - to be defined in a future version of MATLAB
% handles    structure with handles and user data (see GUIDATA)
selected_index = get(handles.listbox1,'value');%获取列表框(ListBox)中的value值,判断是哪一个函数被选中
str = get(handles.listbox1,'string');%获取列表框(ListBox)中的string
set(handles.edit2,'string',str{selected_index});%将列表框(ListBox)中被选中的那一行对应的函数字符串显示在右边那个可编辑文本框中

y = handles.CS{selected_index};% 根据列表框的选择(即selected_index),获取y轴的数据
handles.y = y; %将获取到的y轴数据保存到handles结构体当中
guidata(hObject,handles);%更新结构体handles
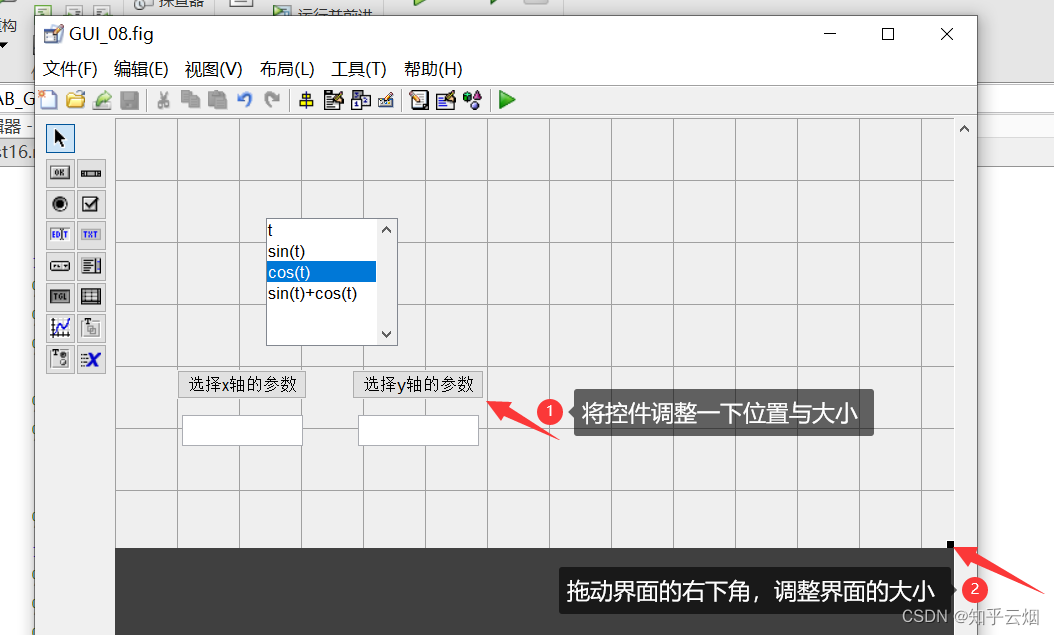
然后调整一下控件的位置和界面的大小。
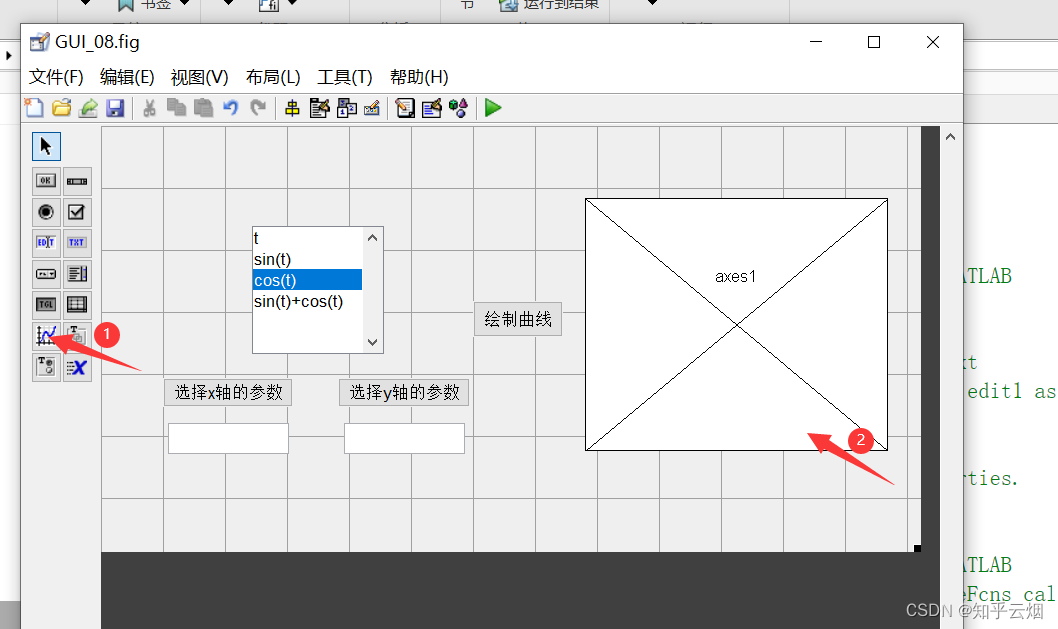
5.创建一个按钮和一个坐标系,作用:当参数选好后,可点击该按钮,将需要的函数图像绘制出来。
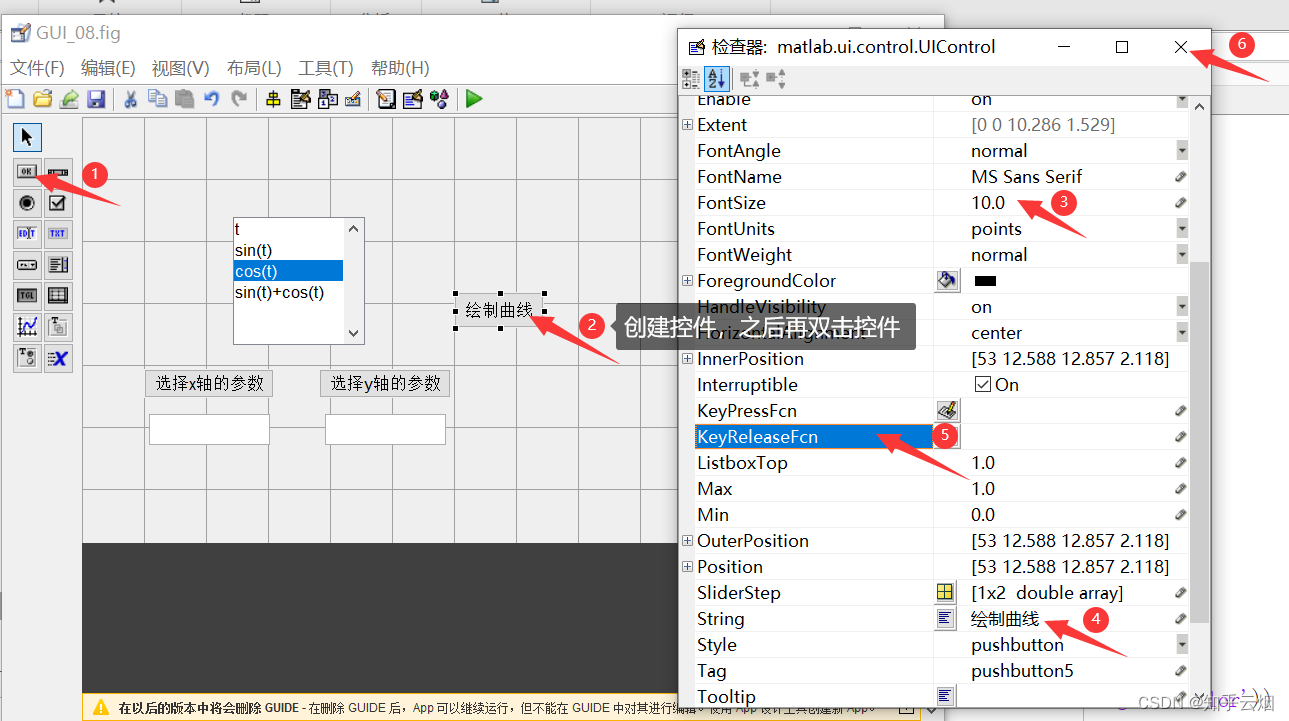
进入按钮的回调函数中,并编写回调函数。
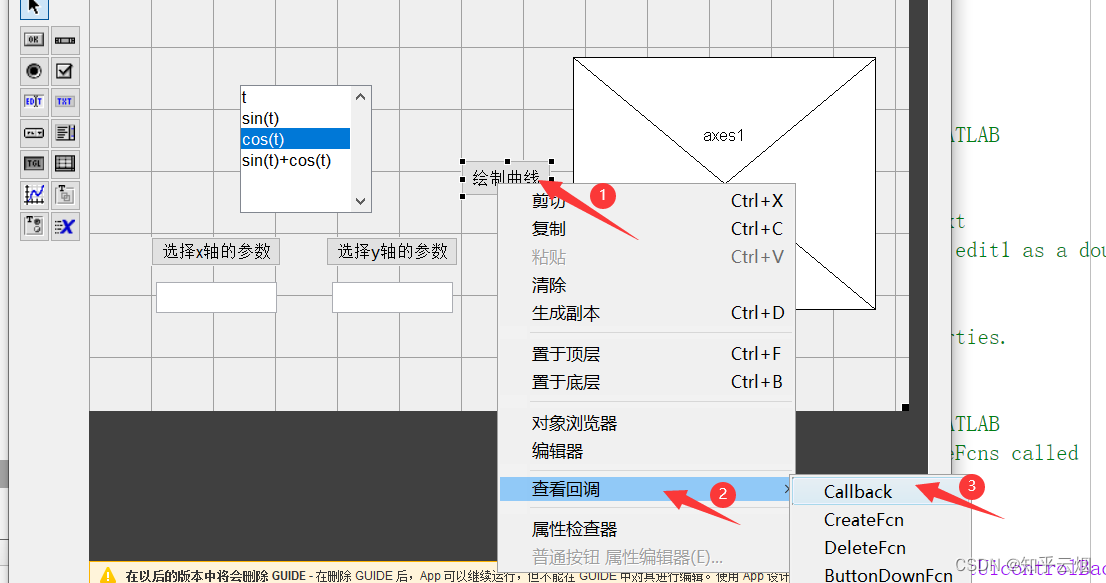
代码如下:
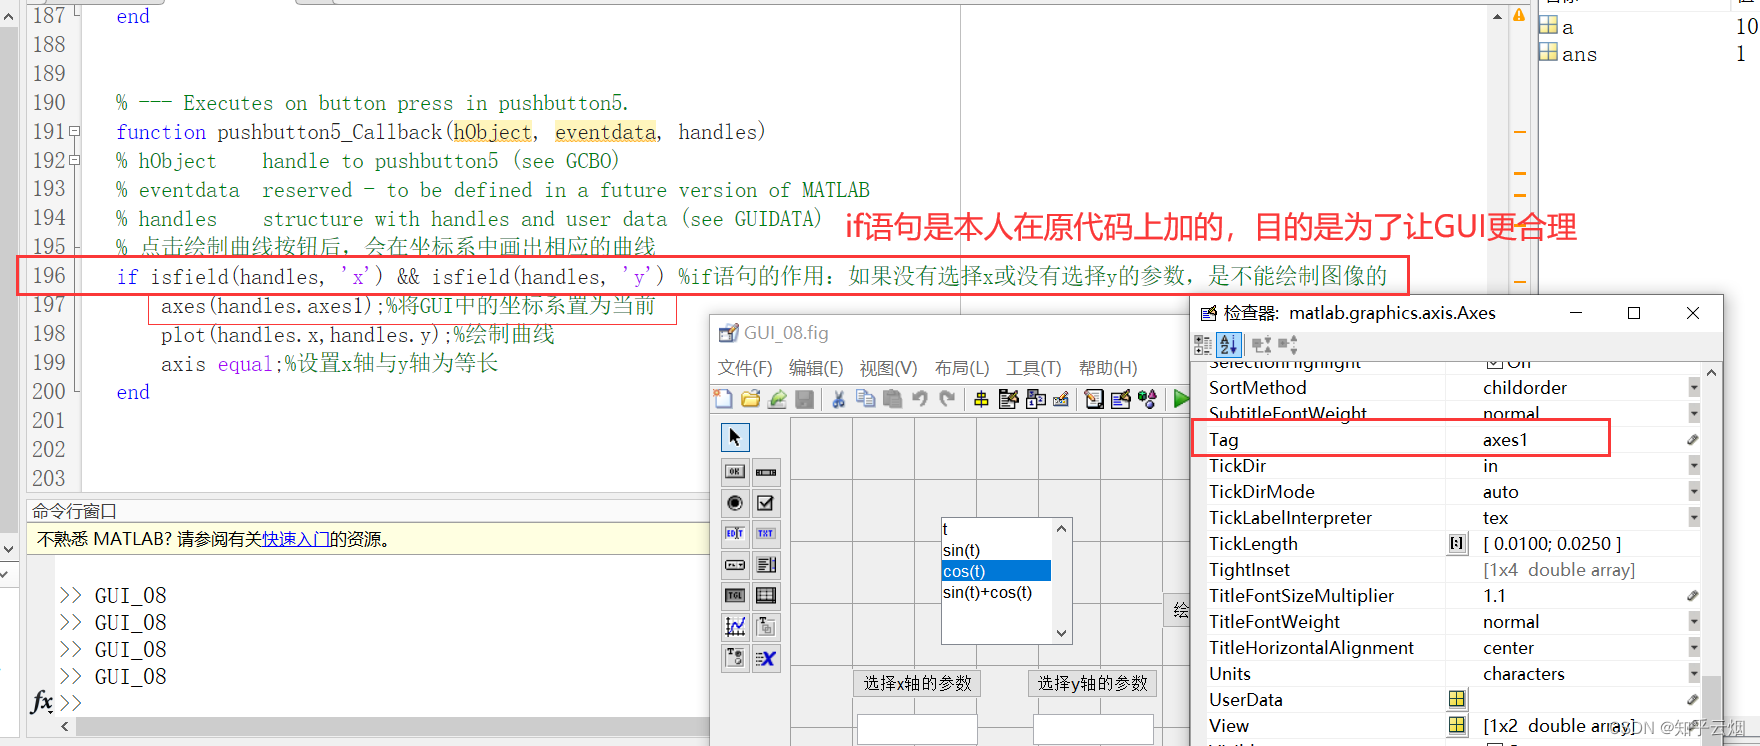
作用:点击绘制曲线按钮后,会在坐标系中画出相应的曲线。
% --- Executes on button press in pushbutton5.
function pushbutton5_Callback(hObject, eventdata, handles)
% hObject handle to pushbutton5 (see GCBO)
% eventdata reserved - to be defined in a future version of MATLAB
% handles structure with handles and user data (see GUIDATA)
% 点击绘制曲线按钮后,会在坐标系中画出相应的曲线
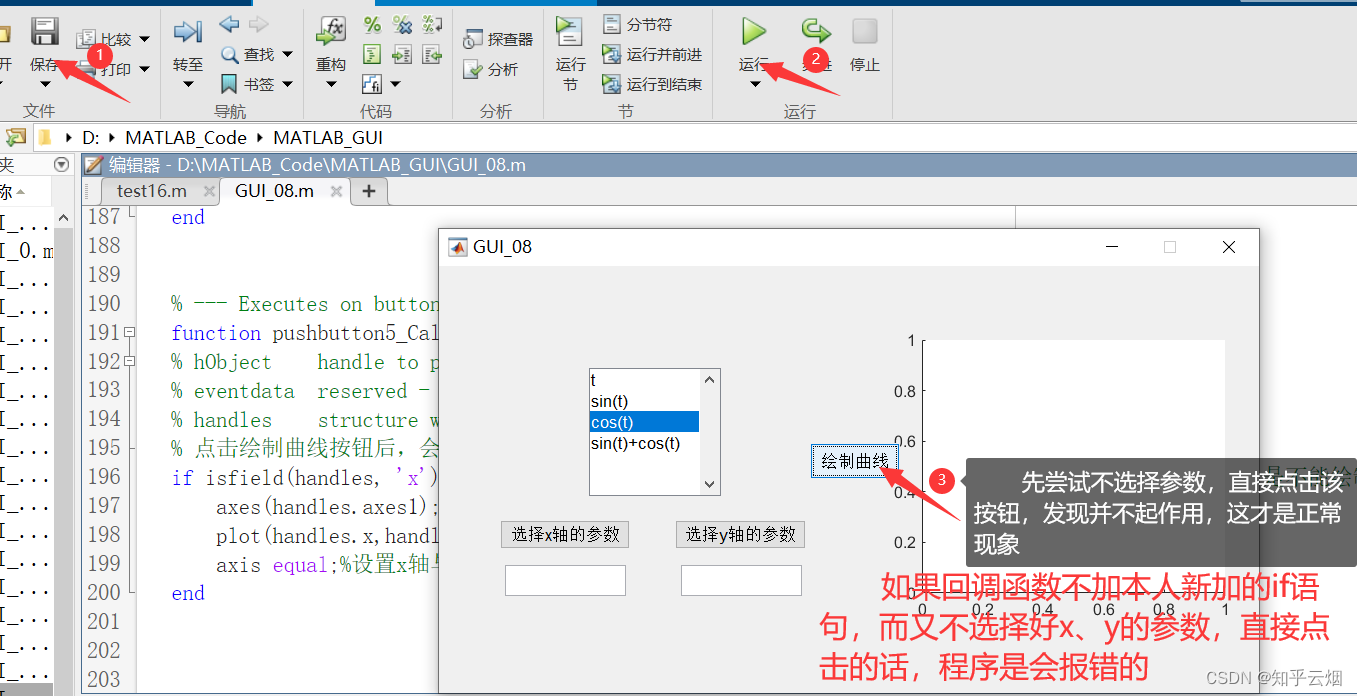
if isfield(handles, 'x') && isfield(handles, 'y') %if语句的作用:如果没有选择x或没有选择y的参数,是不能绘制图像的
axes(handles.axes1);%将GUI中的坐标系置为当前
plot(handles.x,handles.y);%绘制曲线
axis equal;%设置x轴与y轴为等长
end
6.保存并运行程序,查看效果。


 535
535


 被折叠的 条评论
为什么被折叠?
被折叠的 条评论
为什么被折叠?
 到【灌水乐园】发言


