


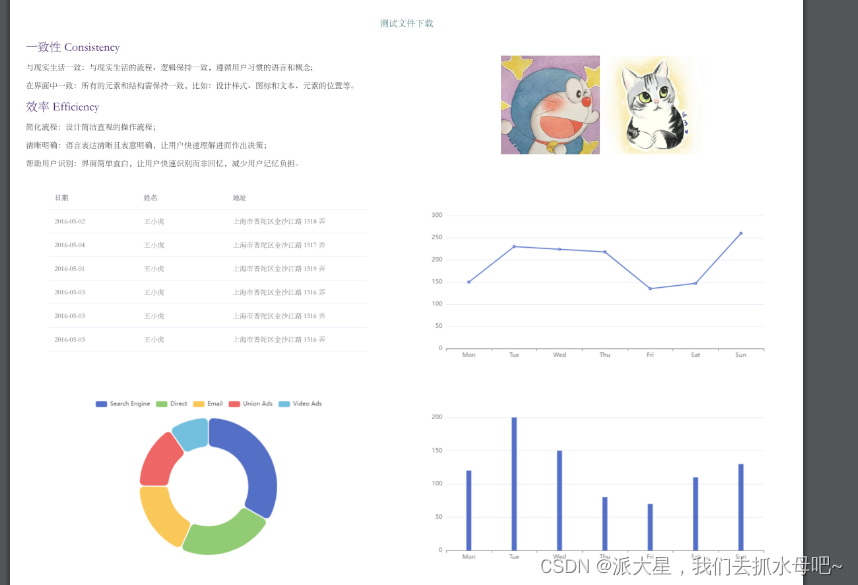
项目需要不使用接口的情况下,导出页面生成pdf文件(带样式)
文件效果:
下载需要的插件依赖
	// 下载文件所需要的依赖
	npm install html2canvas jspdf
	// 在文中引入
	import html2Canvas from 'html2canvas';
	import JsPDF from 'jspdf';
在js文件中添加(重要代码)
import html2Canvas from 'html2canvas';
import JsPDF from 'jspdf';
// const logoImg = require('@/assets/export-logo.png');
// const logoBase64 = new Image();
// logoBase64.src = logoImg;

/**
 * [获取页面导出的pdf文件]
 * @param   {[Object]}  options  [导出pdf配置项,包括一个title属性设置文件名,以及query属性设置获取元素的条件]
 */
export const htmlToPdf = (options) => {
  return new Promise((resolve) => {
    const title = options.title || '标题'; // 导出文件名,默认为“标题”
    const children = document.querySelectorAll('.' + options.className || '.pdf-cell');
    let canvas = [];
    let i = 0;

    function toCanvas () {
      if (children.length >= 1) {
        html2Canvas(children[i], { scale: 3 }).then((res) => {
          // 计算每个dom的高度,方便后面计算分页
          res.imgWidth = 595.28;
          res.imgHeight = (592.28 / res.width) * res.height;
          canvas.push(res);
          i++;
          if (canvas.length === children.length) {
            paging();
            toPdf();
          } else {
            toCanvas();
          }
        });
      } else {
        throw new Error('导出节点列表为空');
      }
    }

    /**
     * [根据dom的高度初步进行分页,会将canvas组装为一个二维数组]
     */
    function paging () {
      const imgArr = [[]];
      let pageH = 0; // 页面的高度
      let allH = 0; // 当前组所有dom的高度和
      let j = 0;
      for (let k = 0; k < canvas.length; k++) {
        // 涉及到k--的操作,使用for循环方便
        pageH += canvas[k].imgHeight;
        console.log(pageH, canvas[k].imgHeight);
        if (pageH > 841.89 && canvas[k].imgHeight < 841.89) {
          // 当某个页面装不下下一个dom时,则分页
          imgArr[j][0].allH = allH - canvas[k].imgHeight;
          allH = pageH = 0;
          k--;
          j++;
          imgArr.push([]);
        } else {
          if (canvas[k].imgHeight > 841.89) {
            // 特殊情况:某个dom高度大于了页面高度,特殊处理
            canvas[k].topH = 841.89 - (pageH - canvas[k].imgHeight); // 该dom顶部距离页面上方的距离
            pageH = (2 * canvas[k].imgHeight - pageH) % 841.89;
            canvas[k].pageH = pageH; // 该dom底部距离页面上方的距离
          }
          imgArr[j].push(canvas[k]);
          allH += canvas[k].imgHeight;
        }
        if (k === canvas.length - 1) imgArr[j][0].allH = allH;
      }
      canvas = imgArr;
    }
    /**
     * [生成PDF文件]
     */
    function toPdf () {
      const PDF = new JsPDF('', 'pt', 'a4');

      canvas.forEach((page, index) => {
        let allH = page[0].allH;
        // let position = 40; // pdf页面偏移
        let position = 0; // pdf页面偏移
        if (index !== 0 && allH <= 841.89) {
          PDF.addPage();
        }
        page.forEach((img) => {
          // PDF.addImage(logoBase64, 'PNG', 10, 10, 575.28, 81 / (1920 / 575.28));
          if (img.imgHeight < 841.89) {
            // 当某个dom高度小于页面宽度,直接添加图片
            PDF.addImage(img.toDataURL('image/jpeg', 1.0), 'JPEG', 0, position, img.imgWidth, img.imgHeight);
            position += img.imgHeight;
            allH -= img.imgHeight;
          } else {
            // 当某个dom高度大于页面宽度,则需另行处理
            while (allH > 0) {
              PDF.addImage(img.toDataURL('image/jpeg', 1.0), 'JPEG', 0, position, img.imgWidth, img.imgHeight);
              allH -= img.topH || 841.89;
              position -= img.topH || 841.89;
              img.topH = 0;
              if (allH > 0) {
                PDF.addPage();
              }
            }
            position = img.pageH;
          }
        });
      });
      // 是否将生成的pdf发送给后端接口
      if(!options.fileUpload){
        PDF.save(title + '.pdf');
        resolve(true);
      }else{
        let pdfData = PDF.output('datauristring') // 获取base64Pdf
        let file = dataURLtoFile(pdfData, title || '标题' + '.pdf') // 将base64文件转化为流,上传oss
        resolve(file);
      }
    }
    function dataURLtoFile (dataurl, filename) {
      let arr = dataurl.split(',')
      let mime = arr[0].match(/:(.*?);/)[1]
      let bstr = atob(arr[1])
      let n = bstr.length
      let u8arr = new Uint8Array(n)
      while (n--) {
        u8arr[n] = bstr.charCodeAt(n)
      }
      return new File([u8arr], filename, { type: mime })
    }
    toCanvas();
  });
};
在需要的文件中引入
// 我的是放在utils文件夹中
import { htmlToPdf } from '@/utils/downPdf'

// 点击之后下载pdf文件
 async downLoad () {
       const loading = this.$loading({
        lock: true, // 文件下载时禁用页面上所有的交互操作
        text: '正在下载请稍等',
        spinner: 'el-icon-loading', // 文件下载时的的加载图标
        background: 'rgba(0, 0, 0, 0.7)',
      });
       // className表示的是只有具有指定类型的元素才会被转化成pdf文件
	  // title: '文件下载': 这个参数指定了生成的 PDF 文件的标题
      // 如果元素过多时,pdf将以 pdfData-centent 为间隔,进行分页分割
      const data = await htmlToPdf({ className: 'pdfData-centent', title: '报表', fileUpload: false });
      if (data) this.$message.success('下载成功')
      loading.close();
    },
详细代码
<template>
  <div class="container">
    <!-- 设置分页的类名 -->
    <div class="page">
      <div class="title" @click="downLoad">测试文件下载</div>
      <a href="/api/uploads/20230731/4dbbe8b13342145d34e99ce00.webp.jpg" download="">下载</a>
      <div class="content">
        <div class="content-text">
          <div class="tip">一致性 Consistency</div>
          <p> 与现实生活一致:与现实生活的流程、逻辑保持一致,遵循用户习惯的语言和概念;</p>
          <p>在界面中一致:所有的元素和结构需保持一致,比如:设计样式、图标和文本、元素的位置等。</p>
          <div class="tip">效率 Efficiency</div>
          <p>简化流程:设计简洁直观的操作流程;</p>
          <p>清晰明确:语言表达清晰且表意明确,让用户快速理解进而作出决策;</p>
          <p>帮助用户识别:界面简单直白,让用户快速识别而非回忆,减少用户记忆负担。</p>
        </div>
        <div class="imgFile">
          <img src="./img/1.png" class="img1" alt="">
          <img src="./img/2.png" class="img2" alt="">
        </div>
        <div class="table">
          <el-table :data="tableData" style="width: 80%;margin-left:10%">
            <el-table-column prop="date" label="日期" width="180">
            </el-table-column>
            <el-table-column prop="name" label="姓名" width="180">
            </el-table-column>
            <el-table-column prop="address" label="地址">
            </el-table-column>
          </el-table>
        </div>
        <div class="echarts">
          <div id="echart" style="width:100%;height:100%">
          </div>
        </div>
        <div class="echarts">
          <div id="myEcharts" style="width:100%;height:100%"></div>
        </div>
        <div class="echarts">
          <div id="echartsBar" style="width:100%;height:100%"></div>
        </div>
      </div>

    </div>

  </div>

</template>
<script>
import * as echarts from "echarts";
import { htmlToPdf } from '@/utils/downPdf'
export default {

  name: '',

  props: {},

  components: {},

  data () {
    return {
      tableData: [{
        date: '2016-05-02',
        name: '王小虎',
        address: '上海市普陀区金沙江路 1518 弄'
      }, {
        date: '2016-05-04',
        name: '王小虎',
        address: '上海市普陀区金沙江路 1517 弄'
      }, {
        date: '2016-05-01',
        name: '王小虎',
        address: '上海市普陀区金沙江路 1519 弄'
      }, {
        date: '2016-05-03',
        name: '王小虎',
        address: '上海市普陀区金沙江路 1516 弄'
      }, {
        date: '2016-05-03',
        name: '王小虎',
        address: '上海市普陀区金沙江路 1516 弄'
      }, {
        date: '2016-05-03',
        name: '王小虎',
        address: '上海市普陀区金沙江路 1516 弄'
      }]
    }
  },

  computed: {},

  watch: {},
  created () { },

  methods: {
    init () {
      const echart = echarts.init(document.getElementById('echart'))
      echart.setOption({
        xAxis: {
          type: 'category',
          data: ['Mon', 'Tue', 'Wed', 'Thu', 'Fri', 'Sat', 'Sun']
        },
        yAxis: {
          type: 'value'
        },
        series: [
          {
            data: [150, 230, 224, 218, 135, 147, 260],
            type: 'line'
          }
        ]
      })

    },
    getInit () {
      const myEcharts = echarts.init(document.getElementById("myEcharts"))
      myEcharts.setOption({
        tooltip: {
          trigger: 'item'
        },
        legend: {
          top: '5%',
          left: 'center'
        },
        series: [
          {
            name: 'Access From',
            type: 'pie',
            radius: ['40%', '70%'],
            avoidLabelOverlap: false,
            itemStyle: {
              borderRadius: 10,
              borderColor: '#fff',
              borderWidth: 2
            },
            label: {
              show: false,
              position: 'center'
            },
            emphasis: {
              label: {
                show: true,
                fontSize: 40,
                fontWeight: 'bold'
              }
            },
            labelLine: {
              show: false
            },
            data: [
              { value: 1048, name: 'Search Engine' },
              { value: 735, name: 'Direct' },
              { value: 580, name: 'Email' },
              { value: 484, name: 'Union Ads' },
              { value: 300, name: 'Video Ads' }
            ]
          }
        ]
      })
      const echartsBar = echarts.init(document.getElementById("echartsBar"))
      echartsBar.setOption({
        xAxis: {
          type: 'category',
          data: ['Mon', 'Tue', 'Wed', 'Thu', 'Fri', 'Sat', 'Sun']
        },
        yAxis: {
          type: 'value'
        },
        series: [
          {
            data: [120, 200, 150, 80, 70, 110, 130],
            type: 'bar',
            barWidth: "10"
          }
        ]
      })
    },
    async downLoad () {
      const loading = this.$loading({
        lock: true,
        text: '正在下载请稍等',
        spinner: 'el-icon-loading',
        background: 'rgba(0, 0, 0, 0.7)',
      });
      // 如果元素过多时,pdf将以 pdfData-centent 为间隔,进行分页分割
      const data = await htmlToPdf({ className: 'pdfData-centent', title: '报表', fileUpload: false });
      if (data) this.$message.success('下载成功')
      loading.close();
    },
  },

  mounted () {
    this.init();
    this.getInit()
  },
}
</script>

<style scoped lang="less">
.container {
  padding: 20px;
  .title {
    padding-top: 50px;
    text-align: center;
    color: rgb(20, 80, 80);
    font-size: 18px;
    cursor: pointer;
  }
  .content {
    display: flex;
    width: 100%;
    flex-wrap: wrap;
    div {
      margin-top: 10px;
    }
    .content-text {
      text-indent: 2em;
      width: 50%;

      .tip {
        font-size: 24px;
        color: rgb(50, 19, 92);
      }
    }
    .imgFile {
      width: 50%;
      display: flex;
      justify-content: center;
      align-items: center;
      .img1 {
        width: 200px;
        height: 200px;
      }
      .img2 {
        width: 220px;
        height: 200px;
      }
    }
    .table {
      width: 50%;
    }
    .echarts {
      width: 50%;
      height: 400px;
    }
  }
}
</style>


 1372
1372


 被折叠的 条评论
为什么被折叠?
被折叠的 条评论
为什么被折叠?
 到【灌水乐园】发言


