


安装模块
pip install matplotlib代码示例:
import time
import json
import matplotlib.pyplot as plt
from matplotlib.animation import FuncAnimation
plt.rcParams['font.sans-serif'] = ['SimHei'] # 设置字体
today = time.strftime('%Y-%m-%d') # 获取当天日期
today_ts = time.mktime(time.strptime(today, "%Y-%m-%d")) # 获取当天0点时间戳
# 从文件中获得数据
with open(fr'files/{today}.json', 'r', encoding='utf-8') as fp:
content = fp.read()
datas = json.loads(content)
"""
数据示例:["09:15:02,0.891,170,0,4", "09:15:05,0.890,776,0,4", "09:15:08,0.891,1240,0,4", ......]
"""
# 获取当天时间在9:30之后的时间数据
x = [i.split(',')[0] for i in datas if time.mktime(time.strptime(f'{today} {i.split(",")[0]}', "%Y-%m-%d %H:%M:%S")) >= (today_ts + 9.5 * 3600)]
# 获取当天时间在9:30之后的价格数据
y = [float(i.split(',')[1]) for i in datas if time.mktime(time.strptime(f'{today} {i.split(",")[0]}', "%Y-%m-%d %H:%M:%S")) >= (today_ts + 9.5 * 3600)]
fig, ax = plt.subplots()
ax.set_xlim('09:30:00', '15:00:00') # 设置横坐标区间
graph = ax.plot(x, y)[0] # 渲染数据
plt.title(f'{today}走势') # 设置标题
ax.set_xlabel('时间') # 设置横坐标label
ax.set_ylabel('价格') # 设置纵坐标label
plt.xticks(x[::int(len(x)/5)]) # 设置横坐标刻度
# 设置纵坐标刻度
yticks = [i / 1000 for i in range(int(min(y) * 1000), int(max(y) * 1000) + 1)]
plt.yticks(yticks)
# 显示最新时刻的数据
text = ax.text(x[int(len(x)/2)], yticks[int(len(yticks)/2)], y[-1], fontdict={"fontsize": 15, "color": "k"})
# 创建update函数,用于刷新折线图数据
def update(frame):
global graph
global text
today = time.strftime('%Y-%m-%d')
with open(fr'515790/{today}.json', 'r', encoding='utf-8') as fp:
content = fp.read()
datas = json.loads(content)
x = [i.split(',')[0] for i in datas if time.mktime(time.strptime(f'{today} {i.split(",")[0]}', "%Y-%m-%d %H:%M:%S")) >= (today_ts + 9.5 * 3600)]
y = [float(i.split(',')[1]) for i in datas if time.mktime(time.strptime(f'{today} {i.split(",")[0]}', "%Y-%m-%d %H:%M:%S")) >= (today_ts + 9.5 * 3600)]
graph.set_xdata(x)
graph.set_ydata(y)
text.remove() # 删除文本
yticks = [i / 1000 for i in range(int(min(y) * 1000), int(max(y) * 1000) + 1)]
text = ax.text(x[int(len(x)/2)], yticks[int(len(yticks)/2)], y[-1], fontdict={"fontsize": 15, "color": "k"})
plt.xticks(x[::int(len(x)/5)])
plt.yticks(yticks)
ax.grid(True) # 显示网格线
anim = FuncAnimation(fig, update, frames=None, interval=5000) # 每5s刷新一次
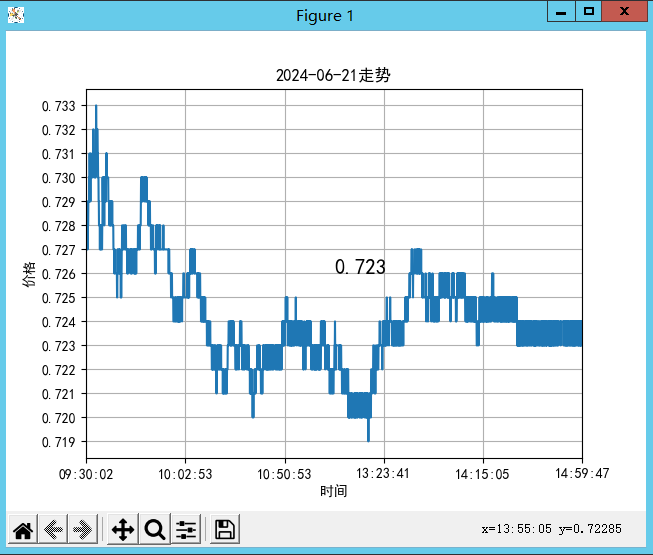
plt.show() 展示图片
效果图


 455
455

 被折叠的 条评论
为什么被折叠?
被折叠的 条评论
为什么被折叠?
 到【灌水乐园】发言


