


主机信息
主机名   部署服务     类型     系统
server  prometheus  监控端    centos7.9
client  nginxphp    被监控端  centos7.9
大致步骤如下:
1、被监控端开启nginx和php的收集参数插件
2、被监控的安装export为监控端提供数据采集端口
3、监控端添加被监控端的信息并验证是否有数据
具体步骤
需要在监控端部署Prometheus和grafana,过程比较简单,此处省略
需要在被监控端部署nginx和php,均为二进制安装。
nginx在编译安装时需要添加模块status_module
#检查nginx是否安装所需模块,#返回with-http_stub_status_module表示已经安装过了
nginx -V 2>&1 | grep -o with-http_stub_status_module

#nginx编译参考,注意,如果按照本文档的编译参数编译,那么nginx配置文件为/usr/local/nginx/nginx.conf
./configure --prefix=/usr/local/nginx --conf-path=/usr/local/nginx/nginx.conf --user=nginx --group=nginx --with-http_stub_status_module

#php编译参数
./configure --prefix=/usr/local/php7 --with-config-file-path=/usr/local/php8/etc --enable-fpm --with-fpm-user=nginx --with-fpm-group=nginx --enable-mysqlnd --with-mysqli --with-pdo-mysql --enable-opcache --with-pcre-jit --enable-gd --with-jpeg --with-freetype --with-gettext --with-curl --with-openssl --enable-sockets --enable-mbstring --enable-xml --with-zip --with-zlib --with-snmp --with-mhash --enable-ftp --enable-bcmath --enable-soap --enable-shmop --enable-sysvsem --enable-pcntl --with-gmp
一、在确认nginx有status_module模块后,编辑nginx配置文件(编辑前请备份原配置文件)
#在server段中添加
             ..........
        location /stub_status {
          stub_status on; #开启stub_status模块
          access_log off; #关闭access日志
          #添加访问限制
          allow 192.168.180.0/24; #
          allow 127.0.0.1;
          deny all;
        }
           .............

#添加后检查nginx配置文件是否有误,并重启
[root@client ~]# nginx -t
#返回ok和successful表示没问题
nginx: the configuration file /usr/local/nginx/nginx.conf syntax is ok
nginx: configuration file /usr/local/nginx/nginx.conf test is successful
#重启nginx
[root@client ~]# /usr/local/nginx/sbin/nginx -s reload
二、验证是否有nginx状态数据
#访问ip/stub_status
[root@client ~]# curl 127.0.0.1/stub_status
Active connections: 2
server accepts handled requests
 175 175 10659
Reading: 0 Writing: 1 Waiting: 1
#有返回值就说明正确
#参数说明
Active connections -- 活动连接数
accepts -- 接收请求数
handled -- 成功处理请求数
requests -- 总请求数
reding -- 正在进⾏读操作的请求数
writing -- 正在进⾏写操作的请求数
waiting -- 正在等待的请求数
三、编辑php配置文件(编辑前请备份)
#开启status状态,在php配置文件最后添加两行
[root@client ~]# vim /usr/local/php7/etc/php-fpm.conf
......
pm.status_path = /status
ping.path = /ping
四、在nginx配置文件中添加php访问
 #编辑nginx配置文件
 [root@client ~]# vim /usr/local/nginx/nginx.conf
              ..........
          location ~ ^/status$ {
            fastcgi_param SCRIPT_FILENAME $document_root$fastcgi_script_name;
            include fastcgi_params;
            fastcgi_pass 127.0.0.1:9000;
          }
              ..........
#重启php和nginx
[root@client ~]# service php-fpm restart && /usr/local/nginx/sbin/nginx -s reload
Gracefully shutting down php-fpm . done
Starting php-fpm  done
#验证是否能够收集到php数据信息
[root@client ~]# curl 127.0.0.1/status
pool:                 www
process manager:      dynamic
start time:           05/Jul/2023:22:32:41 -0400
start since:          135
accepted conn:        1
listen queue:         0
max listen queue:     0
listen queue len:     128
idle processes:       1
active processes:     1
total processes:      2
max active processes: 1
max children reached: 0
slow requests:        0
五、安装nginx_export和php_export
nginx_export下载链接:
https://pan.baidu.com/s/1ZNhivKIyPP4vKaVCrKX4MQ?pwd=0928
提取码:0928
php_export下载链接:
https://pan.baidu.com/s/1quKa3ncwo5mxTqxfVQa1Zw?pwd=0928
提取码:0928
解压nginx_export,并运行
[root@client ~]# tar -xf nginx-prometheus-exporter_0.11.0_linux_amd64.tar.gz -C /usr/local/nginx_export
[root@client ~]# cd /usr/local/nginx_export
[root@client nginx_export]# vim nginx_expory_start.sh
#启动脚本
nohup ./nginx-prometheus-exporter -nginx.scrape-uri=http://192.168.180.111/stub_status  &
[root@client nginx_export]# chmod +x nginx_expory_start.sh
[root@client nginx_export]# ./nginx_expory_start.sh
[root@client nginx_export]# ss -anltup | grep 9113 #默认监听9113端口
tcp    LISTEN     0      128    [::]:9113               [::]:*                   users:(("nginx-prometheu",pid=1227,fd=7))
[root@client nginx_export]#
解压php_export,并运行
#解压php_export,并运行
[root@client ~]# tar -xf php-fpm-exporter.tar.gz -C /usr/local/
[root@client ~]# cd /usr/local/php-fpm-exporter/
[root@client php-fpm-exporter]# vim php-export-start.sh
nohup ./php-fpm-exporter --addr 0.0.0.0:9190 --endpoint http://127.0.0.1/status &
[root@client php-fpm-exporter]# ./hp-export-start.sh
[root@client php-fpm-exporter]# ss -anltup | grep 9190
tcp    LISTEN     0      128    [::]:9190               [::]:*                   users:(("php-fpm-exporte",pid=10271,fd=3))

#通过systemctl管理
#nginx
[root@client ~]# cd /usr/lib/systemd/system/
[root@client system]# vim nginx.service
[Unit]
Description=nginx server daemon
After=network.target sshd-keygen.service

[Service]
Type=forking
ExecStart=/usr/local/nginx/sbin/nginx
ExecStop=/usr/local/nginx/sbin/nginx -s stop
ExecReload=/usr/local/nginx/sbin/nginx -s reload
Restart=on-failure

[Install]
WantedBy=multi-user.target

#php
[root@client system]# vim php.service
[Unit]
Description=php-fpm server daemon
After=network.target sshd-keygen.service

[Service]
Type=forking
ExecStart=service php-fpm start
ExecStop=service php-fpm stop
ExecReload=service php-fpm restart
Restart=on-failure

[Install]
WantedBy=multi-user.target

#nginx-exporter
[root@client system]# vim nginx-exporter.service
[Unit]
Description=nginx-exporter server daemon
After=network.target sshd-keygen.service

[Service]
Type=simple
Restart=always
ExecStart=/usr/local/nginx-export/nginx-prometheus-exporter -nginx.scrape-uri=http://192.168.180.111/stub_status

[Install]
WantedBy=multi-user.target

#php-exporter
[root@client system]# vim php-fpm-exporter.service
[Unit]
Description=OpenSSH server daemon
After=network.target sshd-keygen.service

[Service]
Type=simple
Restart=always
ExecStart=/usr/local/php-fpm-exporter/php-fpm-exporter --addr 0.0.0.0:9190 --endpoint http://127.0.0.1/status

[Install]
WantedBy=multi-user.target

#设置开机自启
[root@client ~]# systemctl enable --now nginx
[root@client ~]# systemctl enable --now php-fpm
[root@client ~]# systemctl enable --now nginx-exporter
[root@client ~]# systemctl enable --now php-fpm-exporter
六、在监控端的Prometheus中添加被监控主机信息
#编辑Prometheus配置文件
[root@server ~]# vim /usr/local/prometheus/prometheus.yml
#在scrape_configs段下添加
    ..........
  - job_name: "nginx"
    static_configs:
      - targets: ["192.168.***.***:9113"]

  - job_name: "php-fpm"
    static_configs:
      - targets: ["192.168.***.***:9190"]
#添加后重启Prometheus
[root@server ~]# systemctl restart prometheus.service
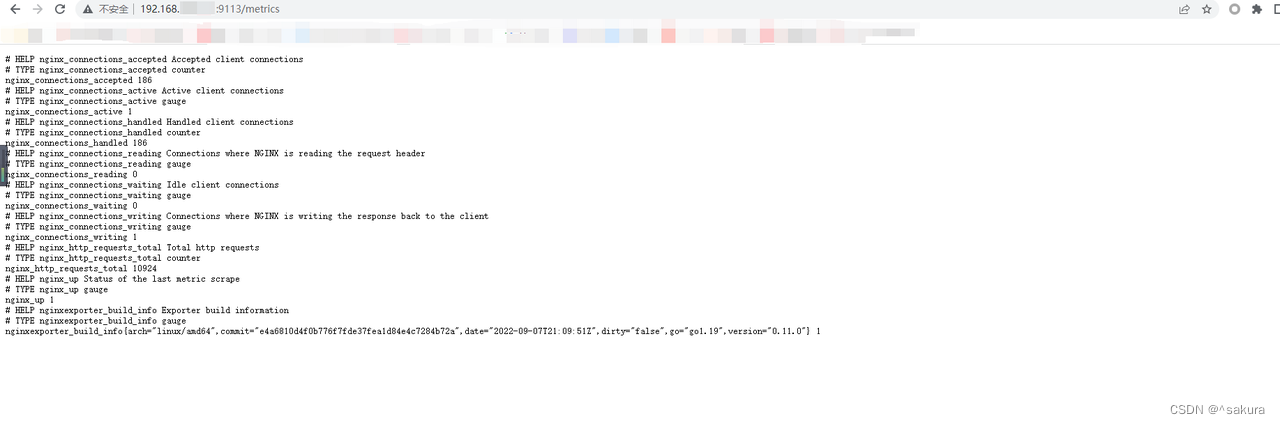
七、访问Prometheus的web界面验证是否能监控到主机
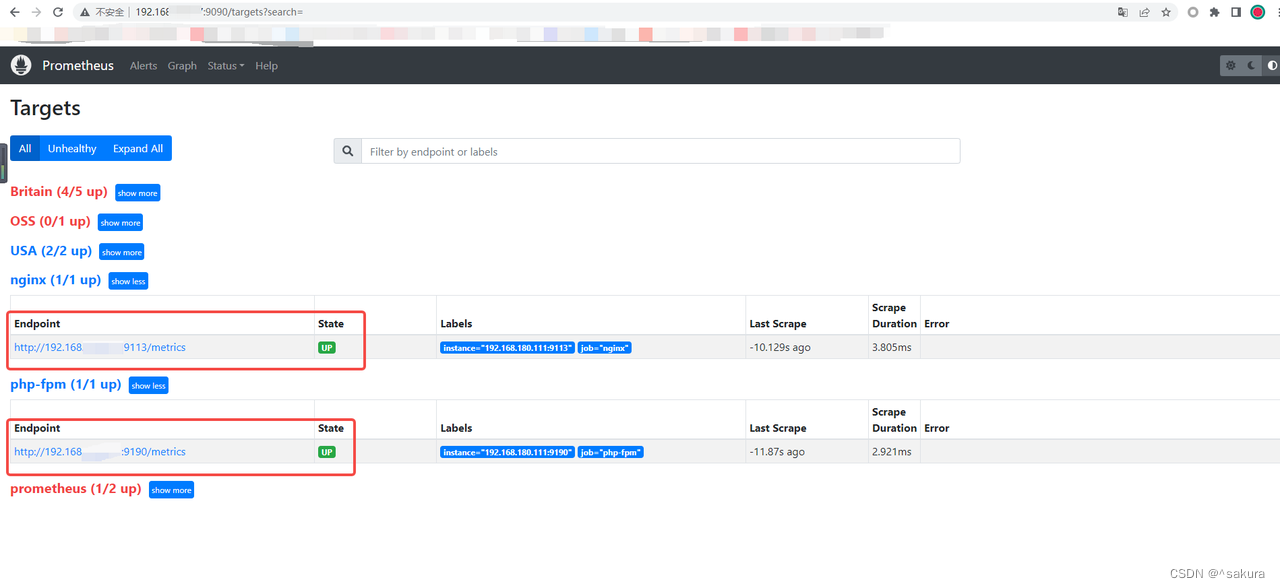
点击metrics,能监控采集到数据说明没问题
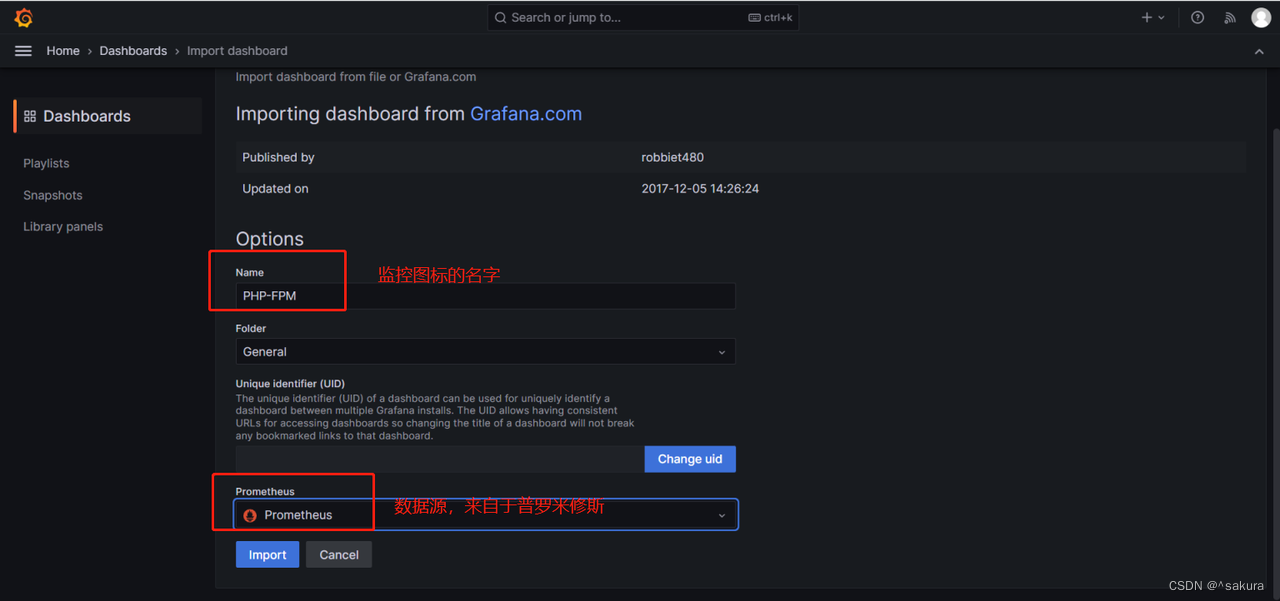
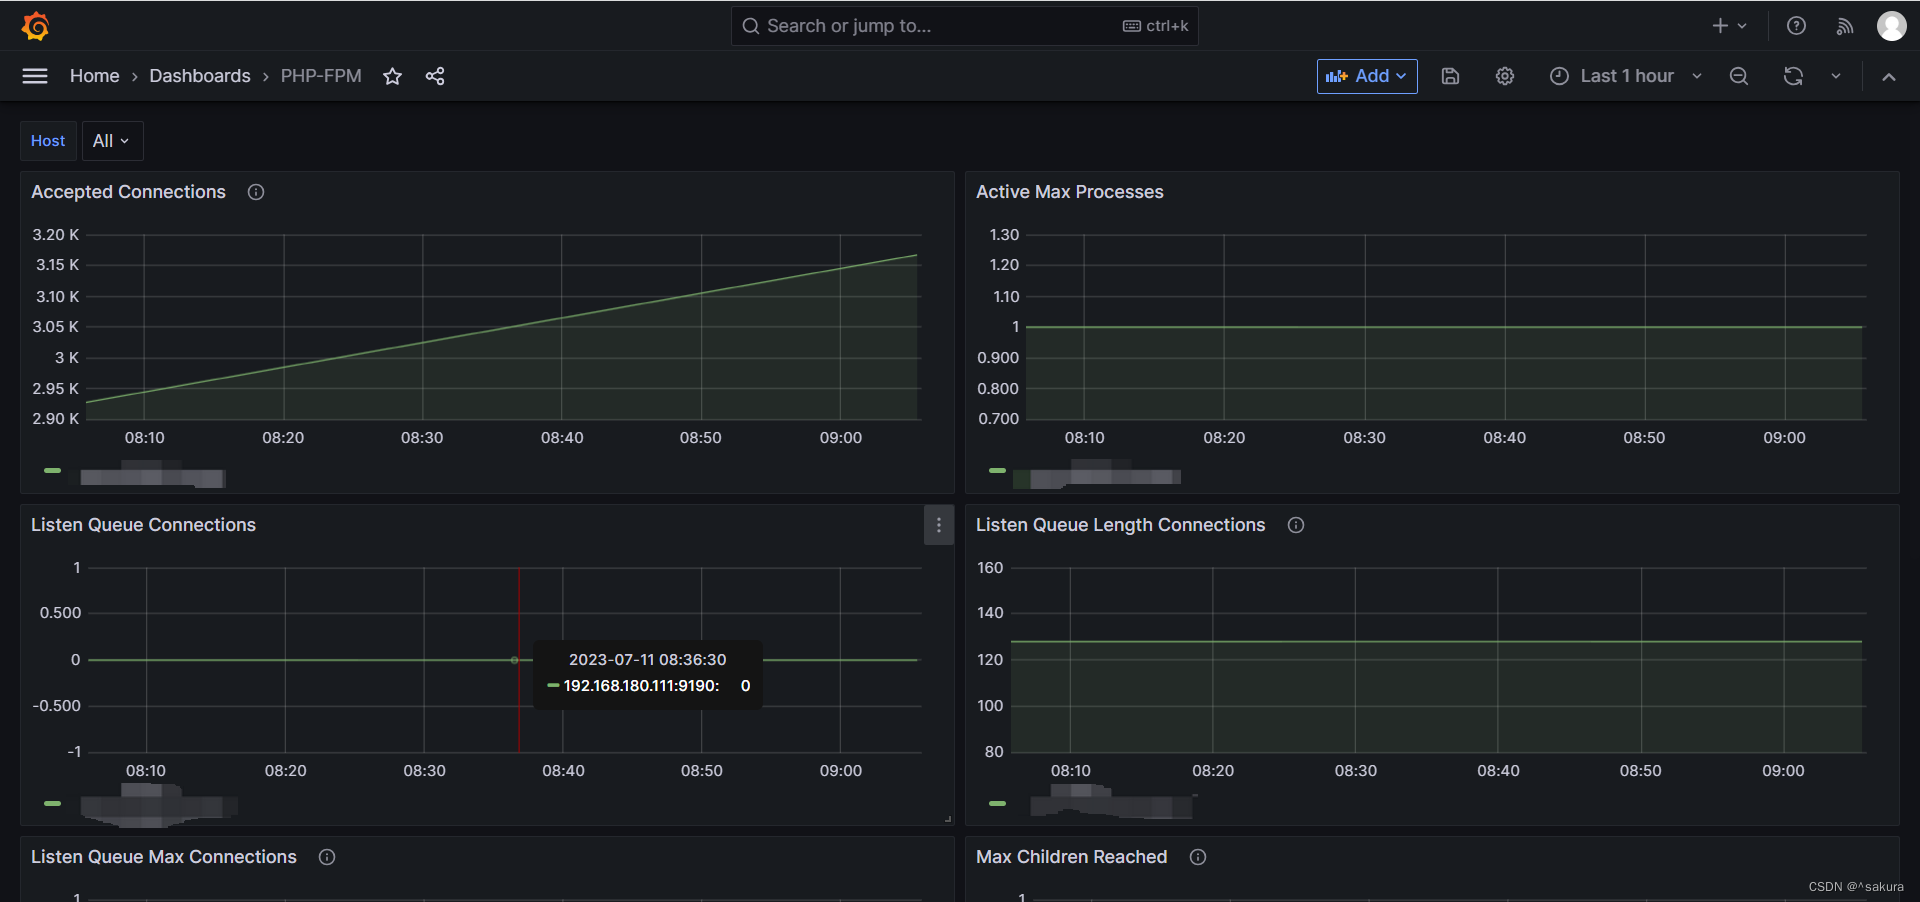
八、添加至grafana
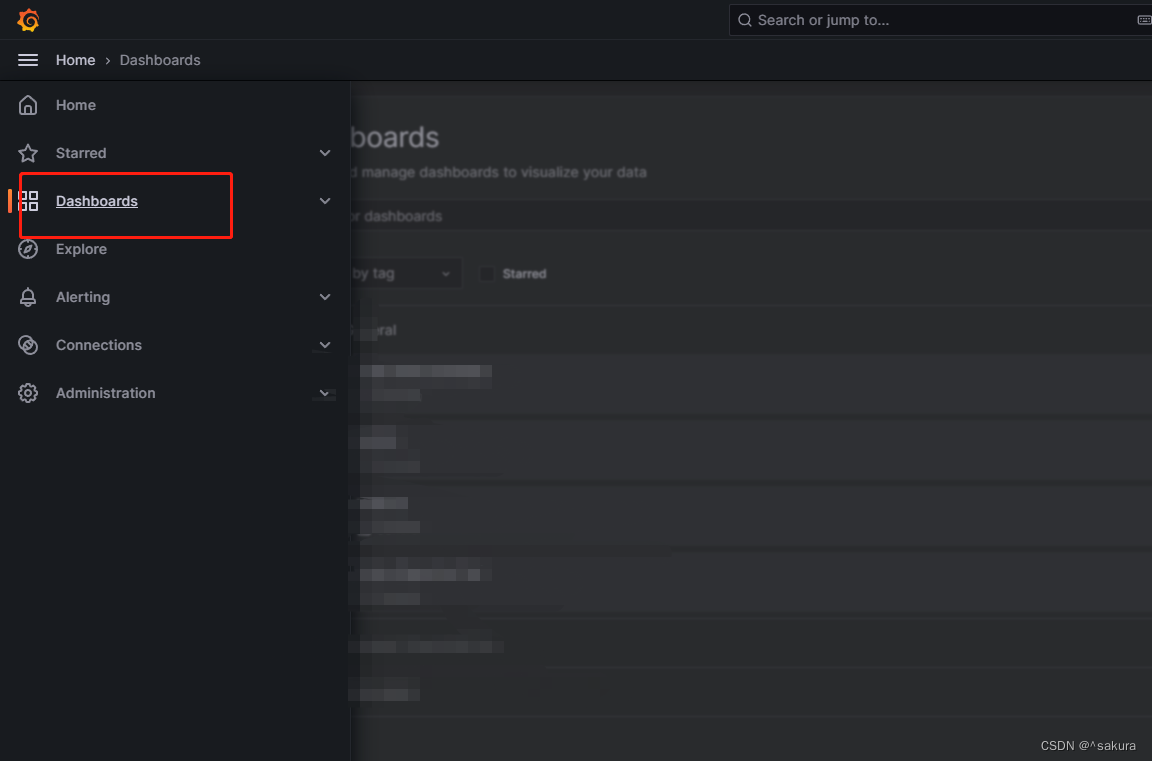
添加数据
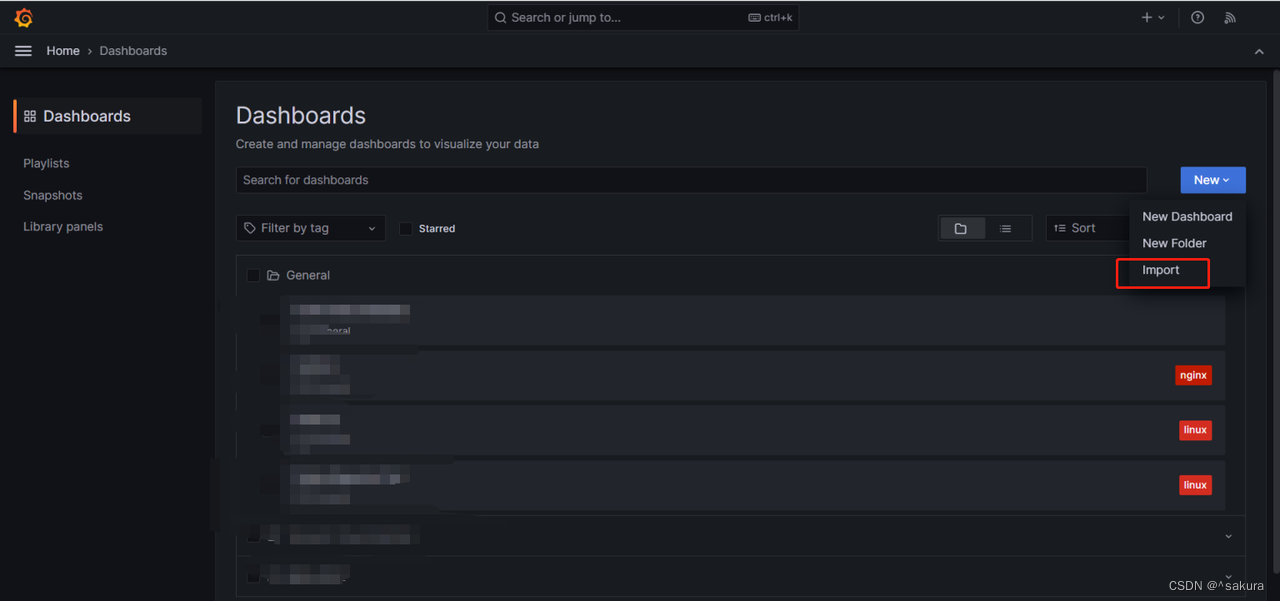
选3901模板

设置图标名字,选择监控的数据源,点击“import”导入


 4842
4842


 被折叠的 条评论
为什么被折叠?
被折叠的 条评论
为什么被折叠?
 到【灌水乐园】发言


