


前言
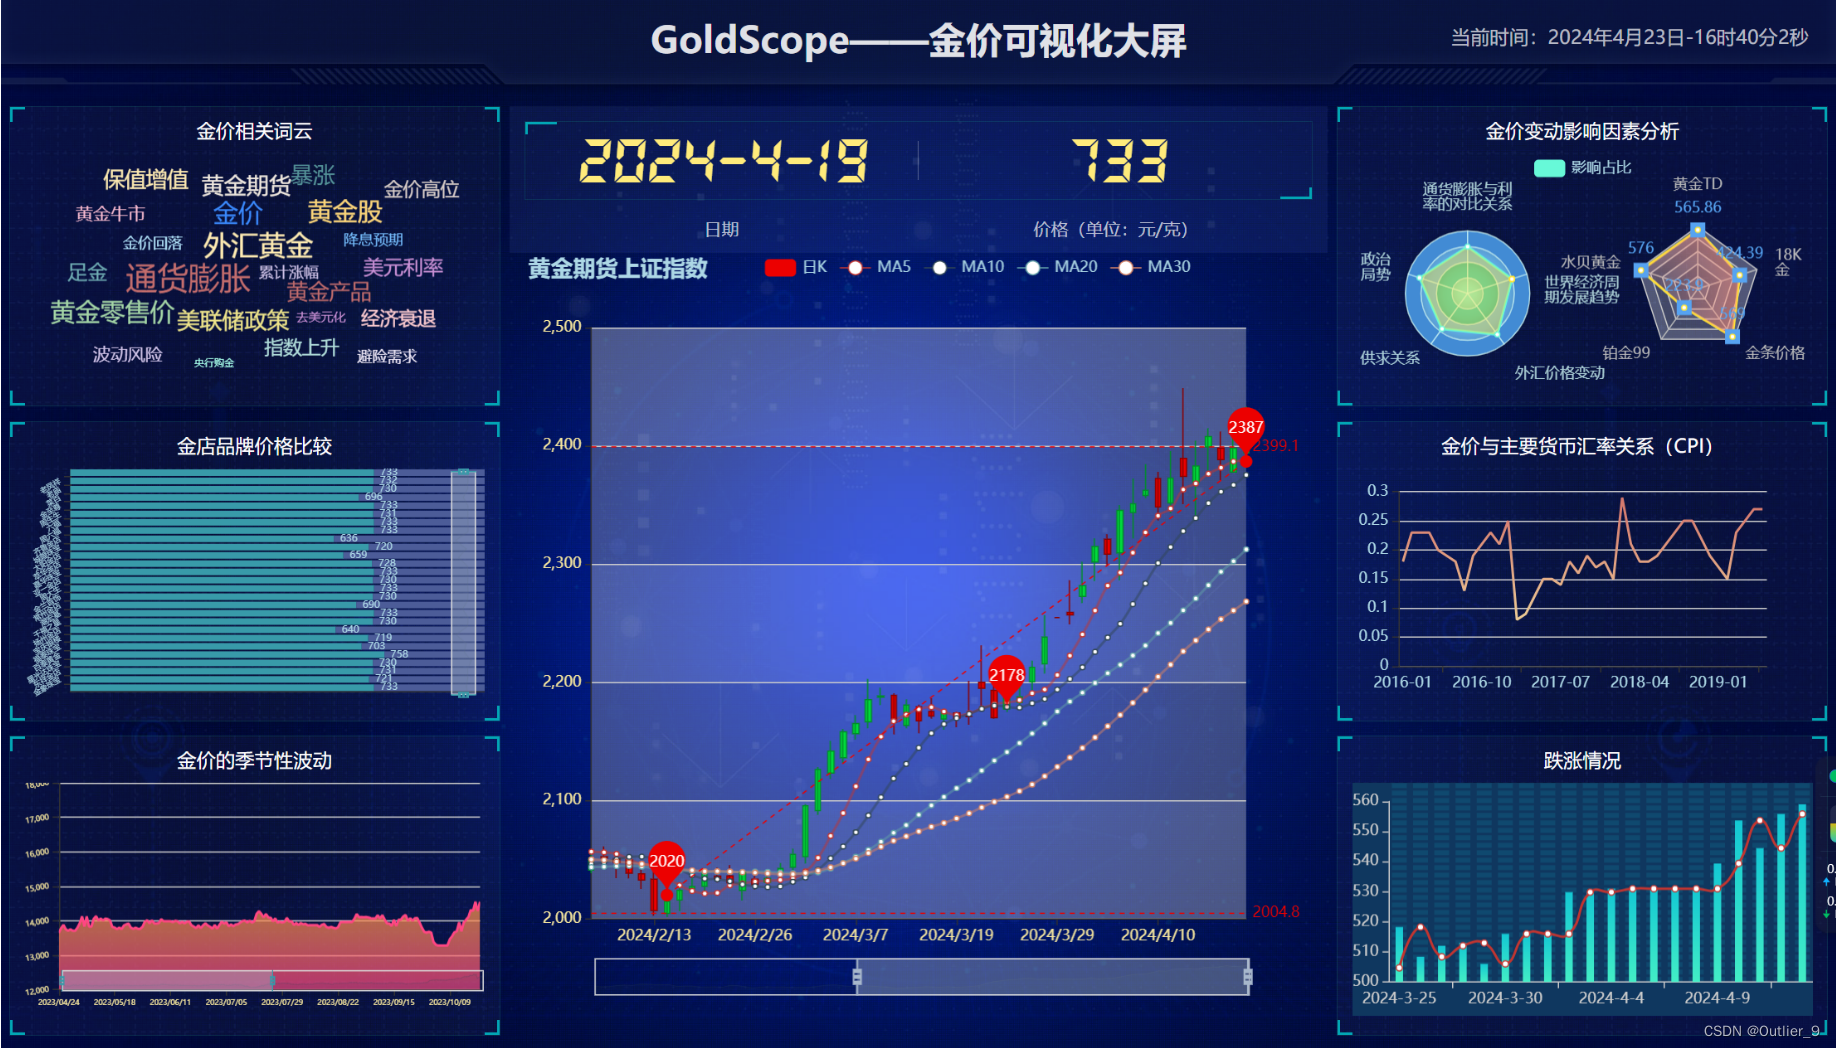
最近由于某种原因参加了一个比赛,四天时间肝出来一个可视化大屏项目(无后端),代码已开源
技术使用:html,css,js,echarts,本项目需要前端基础
项目已使用github进行部署(github可部署静态网站,我并没有做实时更新的功能)
可直接点击链接访问:GoldScope——金价可视化大屏
项目代码
1.词云图(用散点图实现)

// 词云图(用散点图实现)——进价相关词云——左1
(function () {
  // 1.实例化对象
  var myChart = echarts.init(document.querySelector(".bar .chart"));
  // 2.指定配置项和数据

  option = {
    grid: {
      left: '10%',
      top: 5,
      right: '10%',
      bottom: 5,
    },
    itemStyle: {
      color: 'rgba(255,255,255,0)',
    },
    tooltip: {
      show: true,
      trigger: 'item',
    },
    series: [
      {
        type: 'graph',
        layout: 'force', //引导布局
        label: {
          show: true,
          color: 'auto',
        },
        data: [{ name: '金价', size: 20, color: '#3B8BFF', x: 30, y: 22 },
        { name: '足金', size: 16, color: '#70aeb4', x: -120, y: 80 },
        { name: '累计涨幅', size: 12, color: '#D1C4E9', x: 80, y: 80 },
        { name: '暴涨', size: 18, color: '#559399', x: 104, y: -16 },
        { name: '外汇黄金', size: 22, color: '#FFECB3', x: 50, y: 54 },
        { name: '黄金产品', size: 17, color: '#C36D6D', x: 120, y: 100 },
        { name: '降息预期', size: 12, color: '#77BFFF', x: 164, y: 48 },
        { name: '美元利率', size: 16, color: '#CE93D8', x: 194, y: 75 },
        { name: '黄金股', size: 20, color: '#FCD67A', x: 136, y: 20 },
        { name: '去美元化', size: 10, color: '#CE93D8', x: 112, y: 124 }].concat( // 使用 concat 来合并新旧数据点
        // 新的数据点
        {name: '通货膨胀',size: 25,color: '#C36D6D',x: -20, y: 87,label: {color: '#FF5733',fontSize: 15,},fixed: true},
        {name: '金价高位',size: 15,color: '#D7CCC8',x: 212, y: -2,label: {color: '#FF5733',fontSize: 15,},fixed: true},
        {name: '央行购金',size: 8,color: '#A7FFEB',x: 6, y: 169,label: {color: '#FF5733',fontSize: 15,},fixed: true},
        {name: '避险需求',size: 12,color: '#EDE7F6',x: 178, y: 163,label: {color: '#FF5733',fontSize: 15,},fixed: true},
        {name: '经济衰退',size: 15,color: '#FFCDD2',x: 189, y: 126,label: {color: '#FF5733',fontSize: 15,},fixed: true},
        {name: '美联储政策',size: 18,color: '#F0E68C',x: 25, y: 128,label: {color: '#FF5733',fontSize: 15,},fixed: true},
        {name: '黄金牛市',size: 14,color: '#F8BBD0',x: -97, y: 22,label: {color: '#FF5733',fontSize: 15,},fixed: true},
        {name: '保值增值',size: 17,color: '#FFECB3',x: -62, y: -12,label: {color: '#FF5733',fontSize: 15,},fixed: true},
        {name: '黄金零售价',size: 20,color: '#A5D6A7',x: -95, y: 120,label: {color: '#FF5733',fontSize: 15,},fixed: true},
        {name: '金价回落',size: 12,color: '#B3E5FC',x: -55, y: 51,label: {color: '#FF5733',fontSize: 15,},fixed: true},
        {name: '黄金期货',size: 18,color: '#F1EAE0',x: 38, y: -5,label: {color: '#FF5733',fontSize: 15,},fixed: true},
        {name: '波动风险',size: 14,color: '#D1C4E9',x: -80, y: 162,label: {color: '#FF5733',fontSize: 15,},fixed: true},
        {name: '指数上升',size: 15,color: '#B2DFDB',x: 93, y: 155,label: {color: '#FF5733',fontSize: 15,},fixed: true}
        // 如果有更多新数据点,继续添加
      ).map((item) => ({
          name: item.name,
          //   draggable: false,
          itemStyle: {
            color: 'rgba(255,255,255,0)',
          },
          value: item.val,
          x: item.x,
          y: item.y,
          fixed: true,
          label: {
            color: item.color,
            fontSize: item.size,
          },
        })),
      },
    ],
  };

  // 3.把配置项给实例对象
  myChart.setOption(option);

  // 4.让图表随屏幕自适应
  window.addEventListener('resize', function () {
    myChart.resize();
  })
})();
2.金价变动影响因素分析(雷达图)
官网原图链接:Examples - Apache ECharts

// 雷达图——金价变动影响因素分析——右1
(function () {
  // 1.实例化对象
  var myChart = echarts.init(document.querySelector(".bar2 .chart"));

  // 2.指定配置项和数据
  option = {
    color: ['#67F9D8', '#FFE434', '#56A3F1', '#FF917C'],
    // title: {
    //   text: '影响因素分析'
    // },
    legend: {
      textStyle: {
        color: 'lightblue' // 这里将图例文本颜色设置为红色
      }
    },
    radar: [
      {
        indicator: [
          { text: '通货膨胀与利\n率的对比关系' },
          { text: '政治\n局势' },
          { text: '供求关系' },
          { text: '\n\n外汇价格变动' },
          { text: '\n\n\n世界经济周\n期发展趋势' }
        ],
        center: ['25%', '60%'],
        radius: 50,
        startAngle: 90,
        splitNumber: 4,
        shape: 'circle',
        axisName: {
          formatter: '{value}',
          color: '#428BD4'
        },
        splitArea: {
          areaStyle: {
            color: ['#77EADF', '#26C3BE', '#64AFE9', '#428BD4'],
            shadowColor: 'rgba(0, 0, 0, 0.2)',
            shadowBlur: 10
          }
        },
        axisLine: {
          lineStyle: {
            color: 'rgba(211, 253, 250, 0.8)'
          }
        },
        splitLine: {
          lineStyle: {
            color: 'rgba(211, 253, 250, 0.8)'
          }
        }
      },
      {
        indicator: [
          { text: '黄金TD\n', max: 600 },
          { text: '水贝黄金', max: 600 },
          { text: '铂金99', max: 600 },
          { text: '金条价格', max: 600 },
          { text: '18K\n金', max: 600 },
          //{ text: '国内银价', max: 72 }
        ],
        center: ['75%', '58%'],
        radius: 50,
        axisName: {
          color: 'rgba(86, 163,241)',
          borderRadius: 3,
          padding: [3, 5]
        }
      }
    ],
    series: [
      {
        type: 'radar',
        emphasis: {
          lineStyle: {
            width: 4
          }
        },
        data: [
          {
            value: [60, 45, 90, 45, 60],
            name: '影响占比',
            // label: {
            //   show: true
            // },
            areaStyle: {
              color: 'rgba(255, 228, 52, 0.6)'
            }
          },
          {
            //value: [60, 5, 0.3, -100, 1500],
            //name: 'Data B',
            // areaStyle: {
            //   color: 'rgba(255, 228, 52, 0.6)'
            // }
          }
        ]
      },
      {
        type: 'radar',
        radarIndex: 1,
        data: [
          {
            value: [565.86, 576, 223.9, 569, 424.39],
            //name: 'Data C',
            symbol: 'rect',
            symbolSize: 12,
            lineStyle: {
              type: 'dashed'
            },
            label: {
              show: true,
              formatter: function (params) {
                return params.value;
              }
            }
          },
          {
            value: [565.86, 576, 223.9, 569, 424.39],
            //name: 'Data D',
            areaStyle: {
              color: new echarts.graphic.RadialGradient(0.1, 0.6, 1, [
                {
                  color: 'rgba(255, 145, 124, 0.1)',
                  offset: 0
                },
                {
                  color: 'rgba(255, 145, 124, 0.9)',
                  offset: 1
                }
              ])
            }
          }
        ]
      }
    ]
  };
  // 3.把配置项给实例对象
  myChart.setOption(option);

  // 4.让图表随屏幕自适应
  window.addEventListener('resize', function () {
    myChart.resize();
  })
})();
3.金店价格比较(柱状图)
官网原图链接:Examples - Apache ECharts

// 柱状图——金店价格比较——左2
(function () {
  var myChart = echarts.init(document.querySelector(".line .chart"));
  const builderJson = {
    all: 1000,
    charts: {
      吉盟首饰: 733,
      金象珠宝: 721,
      东祥金店: 731,
      星光达珠宝: 730,
      百泰黄金: 758,
      福泰珠宝: 703,
      宝庆银楼: 719,
      扬州金店: 640,
      千禧之星: 730,
      潮宏基: 733,
      常州金店: 690,
      金兰首饰: 730,
      周大生: 733,
      亚一金店: 730,
      嘉华珠宝: 733,
      萃华金店: 728,
      太阳金店: 659,
      城隍珠宝: 720,
      齐鲁金店: 636,
      周六福: 733,
      六福: 733,
      周生生: 731,
      金至尊: 733,
      菜百: 696,
      老庙: 730,
      老凤祥: 732,
      周大福: 733
    },
    ie: 9743
  };
  const downloadJson = {
    'echarts.min.js': 17365,
    'echarts.simple.min.js': 4079,
    'echarts.common.min.js': 6929,
    'echarts.js': 14890
  };
  const themeJson = {
    'dark.js': 1594,
    'infographic.js': 925,
    'shine.js': 1608,
    'roma.js': 721,
    'macarons.js': 2179,
    'vintage.js': 1982
  };
  const waterMarkText = 'ECHARTS';
  const canvas = document.createElement('canvas');
  const ctx = canvas.getContext('2d');
  canvas.width = canvas.height = 100;
  ctx.textAlign = 'center';
  ctx.textBaseline = 'middle';
  ctx.globalAlpha = 0.08;
  ctx.font = '20px Microsoft Yahei';
  ctx.translate(50, 50);
  ctx.rotate(-Math.PI / 4);
  ctx.fillText(waterMarkText, 0, 0);
  option = {
    dataZoom: [
      {
        type: 'inside',
        orient: 'vertical',
        yAxisIndex: 0,
        start: 0,
        end: 200,
        show: true,
        filterMode: 'none',

      },
      {
        type: 'slider', // 指定为 slider 类型
        orient: 'vertical', // 设置为垂直方向的滑动条
        yAxisIndex: 0, // 应用在 yAxis 上
        start: 0, // 滑动条的起始位置
        end: 1000, // 滑动条的结束位置
        show: true, // 显示滑动条
        minValueSpan: 0, // 最小值和最大值之间的最小距离
        width: 20,
        handleStyle: {
          color: '#389AA9'  // 滑动条手柄颜色
        },
        textStyle: {
          color: 'white', // 标签文本的颜色
          fontSize: 12, // 标签文本的字体大小
        }
      }
    ],

    backgroundColor: {
      type: 'pattern',
      image: canvas,
      repeat: 'repeat'
    },
    tooltip: {},
    grid: [
      {
        top: 0,
        width: '100%',
        bottom: '4%',
        left: 0,
        containLabel: true
      }
    ],
    xAxis: [
      {
        type: 'value',
        max: builderJson.all,
        splitLine: {
          show: false
        },
        axisLabel: {
          show: false // 隐藏刻度标签
        },
        axisTick: {
          show: false // 隐藏刻度
        }
      }
    ],
    yAxis: [
      {
        type: 'category',
        data: Object.keys(builderJson.charts),
        axisLabel: {
          interval: 0, color: 'lightblue', fontSize: 6,
          rotate: 30
        },
        splitLine: {
          show: false
        }
      }
    ],
    series: [
      {
        type: 'bar',
        stack: 'chart',
        itemStyle: {
          color: '#389AA9'
        },
        z: 3,
        label: {
          position: 'right',
          show: true,
          color: 'lightblue',
          fontSize: 8
        },
        data: Object.keys(builderJson.charts).map(function (key) {
          return builderJson.charts[key];
        })
      },
      {
        type: 'bar',
        stack: 'chart',
        silent: true,
        itemStyle: {
          color: '#4C5C98'
        },
        data: Object.keys(builderJson.charts).map(function (key) {
          return builderJson.all - builderJson.charts[key];
        })
      },

    ]
  };

  myChart.setOption(option);

  // 4.让图表随屏幕自适应
  window.addEventListener('resize', function () {
    myChart.resize();
  })
})();
4.金价与主要货币汇率关系(渐变折线图)
官网原图链接:Examples - Apache ECharts
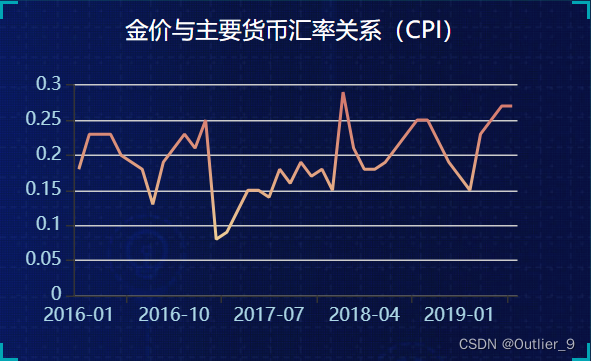
// 渐变折线图——金价与主要货币汇率关系——右2
(function () {
  var myChart = echarts.init(document.querySelector('.line2 .chart'));

  // prettier-ignore
  const data = [["2016-01", 0.18], ["2016-02", 0.23], ["2016-03", 0.23], ["2016-04", 0.23], ["2016-05", 0.20], ["2016-06", 0.19], ["2016-07", 0.18], ["2016-08", 0.13], ["2016-09", 0.19], ["2016-10", 0.21], ["2016-11", 0.23], ["2016-12", 0.21], ["2017-01", 0.25], ["2017-02", 0.08], ["2017-03", 0.09], ["2017-04", 0.12], ["2017-05", 0.15], ["2017-06", 0.15], ["2017-07", 0.14], ["2017-08", 0.18], ["2017-09", 0.16], ["2017-10", 0.19], ["2017-11", 0.17], ["2017-12", 0.18], ["2018-01", 0.15], ["2018-02", 0.29], ["2018-03", 0.21], ["2018-04", 0.18], ["2018-05", 0.18], ["2018-06", 0.19], ["2018-07", 0.21], ["2018-08", 0.23], ["2018-09", 0.25], ["2018-10", 0.25], ["2018-11", 0.22], ["2018-12", 0.19], ["2019-01", 0.17], ["2019-02", 0.15], ["2019-03", 0.23], ["2019-04", 0.25], ["2019-05", 0.27], ["2019-06", 0.27]];
  const dateList = data.map(function (item) {
    return item[0];
  });
  const valueList = data.map(function (item) {
    return item[1];
  });
  option = {
    // Make gradient line here
    visualMap: [
      {
        show: false,
        type: 'continuous',
        seriesIndex: 0,
        min: 0,
        max: 0.5
      }
    ],

    tooltip: {
      trigger: 'axis'
    },
    xAxis: [
      {
        axisLabel: {
          color: "lightblue"
        },
        data: dateList
      }
    ],
    yAxis: [
      {
        axisLabel: {
          color: "lightblue"
        }
      }
    ],
    grid: [
      {
        top:'10%',
        bottom: '15%'
      }
    ],
    series: [
      {
        type: 'line',
        showSymbol: false,
        data: valueList
      }
    ]
  };

  myChart.setOption(option);

  window.addEventListener('resize', function () {
    myChart.resize();
  })
})();
5.金价的季节性波动(大数据量面积图)
官网原图链接:Examples - Apache ECharts
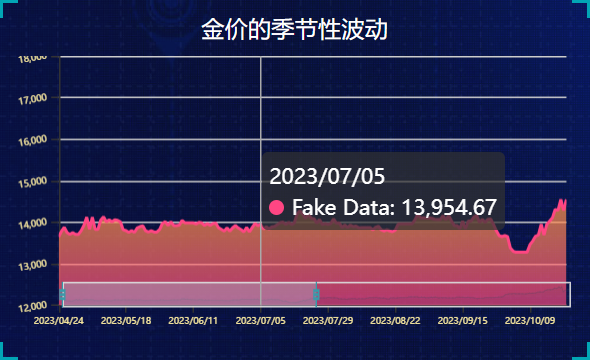
// 大数据量面积图——金价的季节性波动——左3
(function () {
  var myChart = echarts.init(document.querySelector(".pie .chart"));
  let date = [];
  let startDate = new Date(2023, 3, 24); // 设置起始日期为2023年4月24日
  let endDate = new Date(2024, 3, 19); // 设置结束日期为2024年4月19日(注意月份是从0开始计数的)

  // 循环从起始日期到结束日期,生成日期数组
  while (startDate <= endDate) {
    // 使用 Date 对象的 toLocaleDateString 方法来格式化日期
    date.push(startDate.toLocaleDateString('default', { year: 'numeric', month: '2-digit', day: '2-digit' }));
    // 将日期推进一天
    startDate.setDate(startDate.getDate() + 1);
  }

  console.log(date);
  let data = [13642.85, 13778.84, 13876.78, 13747.05, 13702.99, 13747.05, 13702.99, 13702.99, 13791.81, 13922.44, 14121.72, 13825.36, 14121.72, 13825.36, 13825.36, 14050.00, 14124.58, 14008.84, 14055.07, 14008.84, 14055.07, 14041.94, 14005.38, 13815.67, 13795.61, 13752.58, 13795.61, 13752.58, 13858.70, 13892.51, 13910.26, 13791.66, 13760.16, 13791.66, 13760.16, 13760.16, 13823.35, 13971.40, 14009.20, 13916.30, 14009.20, 13916.30, 13918.02, 13928.77, 14040.19, 13984.64, 13980.86, 13984.64, 13980.86, 13955.23, 13993.70, 13980.06, 13920.06, 13966.75, 13920.06, 13966.75, 13975.89, 13863.53, 13825.20, 13785.00, 13861.46, 13785.00, 13861.46, 13918.53, 13860.79, 13820.25, 13764.50, 13871.08, 13764.50, 13871.08, 13969.94, 13910.26, 13954.67, 13838.04, 13885.73, 13838.04, 13885.73, 13896.65, 13943.39, 13990.51, 13999.67, 13942.19, 13999.67, 13942.19, 13982.73, 14191.96, 14273.29, 14193.14, 14092.99, 14193.14, 14092.99, 14081.23, 13978.07, 14060.42, 13940.57, 13968.00, 13940.57, 13968.00, 14075.76, 13974.47, 13984.83, 13872.03, 13928.34, 13872.03, 13928.34, 13892.59, 13905.53, 13863.03, 13866.21, 13867.90, 13866.21, 13867.90, 13814.75, 13875.45, 13898.37, 13814.34, 13788.60, 13814.34, 13788.60, 13769.64, 13808.37, 13950.53, 13956.12, 13960.16, 13956.12, 13960.16, 13960.16, 14051.75, 14188.68, 14098.77, 14101.20, 14098.77, 14101.20, 14091.39, 14067.27, 14063.64, 14059.97, 14157.96, 14059.97, 14157.96, 14031.73, 13918.48, 13916.39, 13844.17, 14024.21, 13844.17, 14024.21, 14025.20, 14119.74, 14159.83, 13994.44, 14066.76, 13994.44, 14066.76, 14076.04, 13942.82, 13792.95, 13673.17, 13650.91, 13673.17, 13650.91, 13377.60, 13300.24, 13274.70, 13278.35, 13278.35, 13278.35, 13278.35, 13458.49, 13544.40, 13661.62, 13688.63, 13948.04, 13688.63, 13948.04, 14022.86, 14100.54, 14306.73, 14282.40, 14546.47, 14282.40, 14546.47, 14432.30, 14356.83, 14512.20, 14450.88, 14509.28, 14450.88, 14509.28, 14605.05, 14610.32, 14535.71, 14508.65, 14536.35, 14508.65, 14536.35, 14427.05, 14274.68, 14253.88, 14259.44, 14153.27, 14259.44, 14153.27, 14076.92, 14280.54, 14190.49, 14341.27, 14286.54, 14341.27, 14286.54, 14109.67, 14328.53, 14312.05, 14244.09, 14304.28, 14244.09, 14304.28, 14404.00, 14456.05, 14598.64, 14523.95, 14583.50, 14523.95, 14583.50, 14636.36, 14459.87, 14508.21, 14489.70, 14398.48, 14489.70, 14398.48, 14256.80, 14216.56, 14216.11, 14548.18, 14469.37, 14548.18, 14469.37, 14431.98, 14531.35, 14531.18, 14573.25, 14573.25, 14573.25, 14573.25, 14573.25, 14573.25, 14778.00, 14775.35, 14775.35, 14775.35, 14775.35, 14775.35, 14769.13, 14602.04, 14603.99, 14696.73, 14603.99, 14696.73, 14485.54, 14587.99, 14537.63, 14544.95, 14735.93, 14544.95, 14735.93, 14700.86, 14649.61, 14477.16, 14487.59, 14592.98, 14487.59, 14592.98, 14540.56, 14508.60, 14492.65, 14519.19, 14487.22, 14519.19, 14487.22, 14521.55, 14664.81, 14719.54, 14690.23, 14632.66, 14690.23, 14632.66, 14526.57, 14601.66, 14688.90, 14599.79, 14556.25, 14599.79, 14556.25, 14496.54, 14359.14, 14280.02, 14416.33, 14372.09, 14416.33, 14372.09, 14519.13, 14592.68, 14573.35, 14560.66, 14589.33, 14560.66, 14589.33, 14591.18, 14648.09, 14629.58, 14722.82, 14752.00, 14722.82, 14752.00, 15103.65, 15360.42, 15423.16, 15488.90, 15601.59, 15488.90, 15601.59, 15658.90, 15520.80, 15582.34, 15545.44, 15569.27, 15545.44, 15569.27, 15535.23, 15513.99, 15531.27, 15626.51, 15699.37, 15626.51, 15699.37, 15696.40, 15732.05, 15847.08, 16002.44, 16002.44, 16002.44, 16002.44, 16002.44, 16379.13, 16492.55, 16589.11, 16625.64, 16589.11, 16625.64, 16777.50, 17040.02, 16877.86, 16976.41, 17380.62, 16976.41, 17380.62, 16002.44, 16379.13, 16492.55, 16589.11, 16625.64,16625.64]

  option = {
    tooltip: {
      trigger: 'axis',
      position: function (pos, params, el, elRect, size) {
        // pos 为当前鼠标的坐标
        // params 为 tooltip 的参数,如当前的数据点
        // el 为当前鼠标悬浮的 DOM 元素
        // elRect 为 el 的布局位置
        // size 为 ECharts 图表的尺寸
        // 以下代码将 tooltip 显示在鼠标的上方
        var tooltipTop = pos[1] - 60; // 距离鼠标指针 30 像素的上方
        return [pos[0], tooltipTop];
      }
    },
    grid: [
      {
        top: 0,
        width: '99%',
        bottom: '4%',
        left: 0,
        containLabel: true
      }
    ],
    xAxis: {
      type: 'category',
      boundaryGap: false,
      data: date,
      axisLabel: {
        color: "#F8E89F",
        fontSize: 6
      },
    },
    yAxis: {
      type: 'value',
      min: 12000, // 设置 y 轴的最小值为 10000
      max: 18000, // 设置 y 轴的最大值为 15000
      boundaryGap: [0, '100%'],
      axisLabel: {
        interval: 0, color: '#F8E89F',
        fontSize: 6,
        rotate: 10
      },
    },
    dataZoom: [

      {
        type: 'slider', // 指定为 slider 类型
        xAxisIndex: 0, // 应用在 xAxis 上
        start: 0, // 滑动条的起始位置
        end: 50, // 滑动条的结束位置
        show: true, // 显示滑动条
        minValueSpan: 0, // 最小值和最大值之间的最小距离
        height: 17,
        handleStyle: {
          color: '#389AA9'  // 滑动条手柄颜色
        },
        textStyle: {
          color: 'white', // 标签文本的颜色
          fontSize: 12, // 标签文本的字体大小
        }
      }
    ],
    series: [
      {
        name: 'Fake Data',
        type: 'line',
        symbol: 'none',
        sampling: 'lttb',
        itemStyle: {
          color: 'rgb(255, 70, 131)'
        },
        areaStyle: {
          color: new echarts.graphic.LinearGradient(0, 0, 0, 1, [
            {
              offset: 0,
              color: 'rgb(255, 158, 68)'
            },
            {
              offset: 1,
              color: 'rgb(255, 70, 131)'
            }
          ])
        },
        data: data
      }
    ]
  };

  myChart.setOption(option);
  window.addEventListener('resize', function () {
    myChart.resize();
  })
})();
6.跌涨情况(虚线柱状图)
官网原图链接:Examples - Apache ECharts
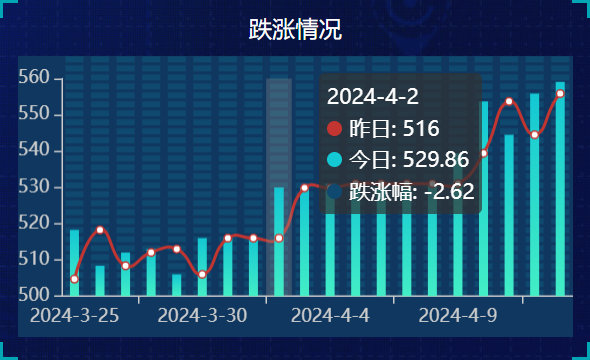
// 虚线柱状图——跌涨情况——右3
(function () {
var myChart = echarts.init(document.querySelector('.pie2 .chart'));
// Generate data
let category = [];
let dottedBase = +new Date() - 30 * 24 * 3600 * 1000;
let lineData = [504.72, 518.26, 508.38, 512.05, 512.98, 506.01, 516.00, 516.00, 516.00, 529.86, 529.86, 531.00, 531.00, 531.00, 531.00, 531.00, 539.40, 553.70, 544.50, 555.85, 559.09, 559.09, 559.09, 566.36, 560.36, 564.26, 564.50, 563.17, 563.17, 563.17];
let barData = [518.26, 508.38, 512.05, 512.98, 506.01, 516.00, 516.00, 516.00, 529.86, 529.86, 531.00, 531.00, 531.00, 531.00, 531.00, 539.40, 553.70, 544.50, 555.85, 559.09, 559.09, 559.09, 566.36, 560.36, 564.26, 564.50, 563.17, 563.17, 563.17, 568.14];
for (let i = 0; i < 20; i++) {
let date = new Date((dottedBase += 3600 * 24 * 1000));
category.push(
[date.getFullYear(), date.getMonth() + 1, date.getDate()].join('-')
);
let b = Math.random() * 200;
let d = Math.random() * 200;
barData.push(b);
lineData.push(d + b);
}
// option
option = {
backgroundColor: '#0f375f',
tooltip: {
trigger: 'axis',
axisPointer: {
type: 'shadow'
}
},
legend: {
data: ['line', 'bar'],
textStyle: {
color: '#ccc'
}
},
grid: [
{
top: 15,
width: '100%',
bottom: '4%',
left: 0,
containLabel: true
}
],
xAxis: {
data: category,
axisLine: {
lineStyle: {
color: '#ccc'
}
}
},
yAxis: {
splitLine: { show: false },
min: 500,
max: 560,
axisLine: {
lineStyle: {
color: '#ccc'
}
}
},
series: [
{
name: '昨日',
type: 'line',
smooth: true,
showAllSymbol: true,
symbol: 'emptyCircle',
symbolSize: 5,
data: lineData
},
{
name: '今日',
type: 'bar',
barWidth: 6,
itemStyle: {
borderRadius: 5,
color: new echarts.graphic.LinearGradient(0, 0, 0, 1, [
{ offset: 0, color: '#14c8d4' },
{ offset: 1, color: '#43eec6' }
])
},
data: barData
},
{
name: '跌涨幅',
type: 'pictorialBar',
symbol: 'rect',
itemStyle: {
color: '#0f496f'
},
symbolRepeat: true,
symbolSize: [12, 4],
symbolMargin: 1,
z: -12,
data: lineData.map((lineValue, index) => {
// 计算差值
let difference = lineValue - barData[index];
// 计算差值百分比,并保留两位小数
let percentageDifference = ((lineValue - barData[index]) / barData[index] * 100).toFixed(2) + '%';
// 自定义提示框显示的格式
return {
value: parseFloat(percentageDifference), // 将格式化的字符串转换为浮点数
tooltip: {
formatter: params => {
// 由于我们已经在data中定义了完整的百分比字符串,这里可以直接使用params.value
return `${params.name}<br />涨幅: ${params.value}`;
}
}
};
})
}
]
};
myChart.setOption(option);
window.addEventListener('resize', function () {
myChart.resize();
})
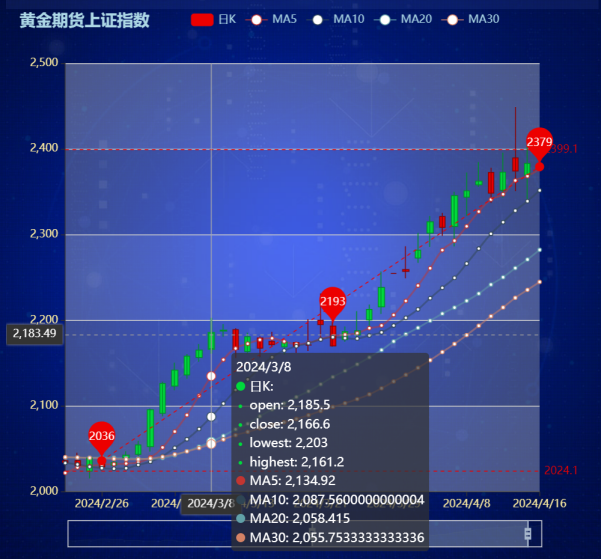
})();7.上证指数
官网原图链接:Examples - Apache ECharts
// 上证指数——上证指数——中间
(function () {
  var myChart = echarts.init(document.querySelector(".map .chart"));

  const upColor = '#ec0000';
  const upBorderColor = '#8A0000';
  const downColor = '#00da3c';
  const downBorderColor = '#008F28';
  // Each item: open,close,lowest,highest
  const data0 = splitData([
    ["2023/12/19", 2042.60, 2031.00, 2050.00, 2025.40],
    ["2023/12/20", 2038.10, 2043.50, 2045.90, 2031.60],
    ["2023/12/21", 2041.80, 2034.70, 2048.00, 2034.00],
    ["2023/12/22", 2059.60, 2051.50, 2072.30, 2049.40],
    ["2023/12/25", 2066.65, 2065.30, 2067.60, 2065.30],
    ["2023/12/26", 2060.40, 2056.30, 2069.60, 2056.30],
    ["2023/12/27", 2083.40, 2068.00, 2085.30, 2063.30],
    ["2023/12/28", 2083.50, 2089.50, 2098.20, 2074.60],
    ["2023/12/29", 2071.80, 2076.10, 2084.10, 2067.60],
    ["2024/1/1", 2072.90, 2071.75, 2075.70, 2071.75],
    ["2024/1/2", 2073.40, 2072.70, 2088.10, 2064.30],
    ["2024/1/3", 2042.80, 2067.90, 2074.30, 2038.30],
    ["2024/1/4", 2050.00, 2049.30, 2058.10, 2043.30],
    ["2024/1/5", 2049.80, 2051.40, 2071.10, 2030.80],
    ["2024/1/8", 2033.50, 2052.60, 2053.30, 2022.70],
    ["2024/1/9", 2033.00, 2034.50, 2048.60, 2031.90],
    ["2024/1/10", 2037.50, 2046.20, 2052.00, 2036.40],
    ["2024/1/11", 2028.90, 2039.40, 2060.10, 2027.40],
    ["2024/1/12", 2061.10, 2045.00, 2075.80, 2044.20],
    ["2024/1/15", 2057.85, 2051.30, 2062.50, 2049.50],
    ["2024/1/16", 2039.70, 2060.00, 2069.70, 2037.50],
    ["2024/1/17", 2015.90, 2040.80, 2041.00, 2014.60],
    ["2024/1/18", 2031.10, 2021.30, 2034.20, 2017.50],
    ["2024/1/19", 2038.50, 2033.70, 2050.10, 2031.80],
    ["2024/1/22", 2031.50, 2040.40, 2043.00, 2027.40],
    ["2024/1/23", 2035.20, 2032.80, 2045.40, 2031.50],
    ["2024/1/24", 2025.40, 2039.40, 2046.20, 2021.90],
    ["2024/1/25", 2027.10, 2025.40, 2034.00, 2017.00],
    ["2024/1/26", 2026.60, 2028.90, 2035.70, 2025.40],
    ["2024/1/29", 2034.90, 2035.80, 2046.50, 2028.20],
    ["2024/1/30", 2050.90, 2051.50, 2068.00, 2047.10],
    ["2024/1/31", 2067.40, 2055.30, 2074.60, 2048.80],
    ["2024/2/1", 2071.10, 2057.90, 2083.20, 2046.40],
    ["2024/2/2", 2053.70, 2072.00, 2074.70, 2044.20],
    ["2024/2/5", 2042.90, 2057.90, 2059.10, 2030.80],
    ["2024/2/6", 2051.40, 2041.40, 2055.30, 2038.80],
    ["2024/2/7", 2051.70, 2052.60, 2061.30, 2046.40],
    ["2024/2/8", 2047.90, 2051.00, 2053.80, 2034.60],
    ["2024/2/9", 2038.70, 2049.70, 2051.90, 2034.30],
    ["2024/2/12", 2033.00, 2038.20, 2041.80, 2025.40],
    ["2024/2/13", 2007.20, 2033.70, 2047.30, 2002.80],
    ["2024/2/15", 2014.90, 2004.80, 2020.20, 2001.80],
    ["2024/2/16", 2024.10, 2016.10, 2027.20, 2006.60],
    ["2024/2/19", 2027.50, 2025.70, 2034.30, 2024.65],
    ["2024/2/20", 2039.80, 2027.70, 2042.70, 2023.90],
    ["2024/2/21", 2034.30, 2036.20, 2043.50, 2030.90],
    ["2024/2/22", 2030.70, 2036.50, 2045.50, 2029.30],
    ["2024/2/23", 2039.40, 2024.10, 2041.50, 2015.60],
    ["2024/2/26", 2029.10, 2033.70, 2036.30, 2025.00],
    ["2024/2/27", 2034.40, 2031.00, 2038.00, 2028.70],
    ["2024/2/28", 2042.70, 2039.70, 2047.40, 2033.40],
    ["2024/2/29", 2054.70, 2043.80, 2059.40, 2036.00],
    ["2024/3/1", 2095.70, 2052.80, 2097.10, 2047.00],
    ["2024/3/4", 2126.30, 2091.60, 2128.40, 2088.10],
    ["2024/3/5", 2141.90, 2123.30, 2150.50, 2118.50],
    ["2024/3/6", 2158.20, 2136.40, 2160.70, 2131.90],
    ["2024/3/7", 2165.20, 2156.70, 2172.20, 2151.70],
    ["2024/3/8", 2185.50, 2166.60, 2203.00, 2161.20],
    ["2024/3/11", 2188.60, 2187.60, 2195.50, 2180.90],
    ["2024/3/12", 2166.10, 2189.10, 2190.80, 2156.20],
    ["2024/3/13", 2180.80, 2163.60, 2185.60, 2161.30],
    ["2024/3/14", 2167.50, 2179.50, 2181.30, 2157.00],
    ["2024/3/15", 2171.60, 2175.50, 2186.70, 2169.40],
    ["2024/3/18", 2174.50, 2169.10, 2176.00, 2160.00],
    ["2024/3/19", 2169.80, 2174.20, 2175.00, 2162.10],
    ["2024/3/20", 2171.00, 2171.30, 2201.40, 2164.20],
    ["2024/3/21", 2195.00, 2200.10, 2231.30, 2178.90],
    ["2024/3/22", 2170.20, 2193.30, 2198.00, 2169.30],
    ["2024/3/25", 2186.80, 2177.50, 2192.70, 2175.00],
    ["2024/3/26", 2187.80, 2183.00, 2210.70, 2179.30],
    ["2024/3/27", 2212.70, 2200.50, 2218.30, 2193.70],
    ["2024/3/28", 2238.40, 2215.70, 2256.90, 2207.50],
    ["2024/3/29", 2254.80, 2254.80, 2254.80, 2254.80],
    ["2024/4/1", 2257.10, 2259.20, 2286.40, 2249.10],
    ["2024/4/2", 2281.80, 2272.70, 2301.90, 2267.10],
    ["2024/4/3", 2315.00, 2301.70, 2321.80, 2285.70],
    ["2024/4/4", 2308.50, 2321.00, 2325.30, 2298.70],
    ["2024/4/5", 2345.40, 2309.50, 2350.00, 2286.20],
    ["2024/4/8", 2351.00, 2343.60, 2372.50, 2321.70],
    ["2024/4/9", 2362.40, 2358.10, 2384.50, 2355.70],
    ["2024/4/10", 2348.40, 2372.40, 2378.10, 2337.10],
    ["2024/4/11", 2372.70, 2351.70, 2395.60, 2343.10],
    ["2024/4/12", 2374.10, 2389.40, 2448.80, 2350.60],
    ["2024/4/15", 2383.00, 2369.40, 2404.30, 2340.20],
    ["2024/4/16", 2407.80, 2399.10, 2414.80, 2379.20],
    ["2024/4/17", 2388.40, 2398.00, 2412.00, 2370.70],
    ["2024/4/18", 2398.00, 2377.90, 2408.00, 2377.20],
    ["2024/4/19", 2413.80, 2394.00, 2433.30, 2386.80]
  ]);
  function splitData(rawData) {
    const categoryData = [];
    const values = [];
    for (var i = 0; i < rawData.length; i++) {
      categoryData.push(rawData[i].splice(0, 1)[0]);
      values.push(rawData[i]);
    }
    return {
      categoryData: categoryData,
      values: values
    };
  }
  function calculateMA(dayCount) {
    var result = [];
    for (var i = 0, len = data0.values.length; i < len; i++) {
      if (i < dayCount) {
        result.push('-');
        continue;
      }
      var sum = 0;
      for (var j = 0; j < dayCount; j++) {
        sum += +data0.values[i - j][1];
      }
      result.push(sum / dayCount);
    }
    return result;
  }
  option = {
    title: {
      text: '黄金期货上证指数',
      left: 10,
      textStyle: {
        color: 'lightblue' // 这里将图例文本颜色设置为红色
      }
    },
    tooltip: {
      trigger: 'axis',
      axisPointer: {
        type: 'cross'
      }
    },
    legend: {
      data: ['日K', 'MA5', 'MA10', 'MA20', 'MA30'],
      textStyle: {
        color: 'lightblue' // 这里将图例文本颜色设置为红色
      },
      left: 200,
    },
    grid: {
      left: '10%',
      right: '10%',
      bottom: '15%'
    },
    xAxis: {
      type: 'category',
      data: data0.categoryData,
      boundaryGap: false,
      axisLine: { onZero: false },
      axisLabel: {
        color: '#F8E89F',
        fontSize: 12
      },
      splitLine: { show: false },
      min: 'dataMin',
      max: 'dataMax'
    },
    yAxis: {
      axisLabel: {
        color: '#F8E89F',
        fontSize: 12
      },
      scale: true,
      splitArea: {
        show: true
      }
    },
    dataZoom: [
      {
        type: 'inside',
        start: 50,
        end: 100
      },
      {
        show: true,
        type: 'slider',
        top: '90%',
        start: 50,
        end: 100
      }
    ],
    series: [
      {
        name: '日K',
        type: 'candlestick',
        data: data0.values,
        itemStyle: {
          color: upColor,
          color0: downColor,
          borderColor: upBorderColor,
          borderColor0: downBorderColor
        },
        markPoint: {
          label: {
            formatter: function (param) {
              return param != null ? Math.round(param.value) + '' : '';
            }
          },
          data: [
            {
              name: 'Mark',
              coord: ['2013/5/31', 2300],
              value: 2300,
              itemStyle: {
                color: 'rgb(41,60,85)'
              }
            },
            {
              name: 'highest value',
              type: 'max',
              valueDim: 'highest'
            },
            {
              name: 'lowest value',
              type: 'min',
              valueDim: 'lowest'
            },
            {
              name: 'average value on close',
              type: 'average',
              valueDim: 'close'
            }
          ],
          tooltip: {
            formatter: function (param) {
              return param.name + '<br>' + (param.data.coord || '');
            }
          }
        },
        markLine: {
          symbol: ['none', 'none'],
          data: [
            [
              {
                name: 'from lowest to highest',
                type: 'min',
                valueDim: 'lowest',
                symbol: 'circle',
                symbolSize: 10,
                label: {
                  show: false
                },
                emphasis: {
                  label: {
                    show: false
                  }
                }
              },
              {
                type: 'max',
                valueDim: 'highest',
                symbol: 'circle',
                symbolSize: 10,
                label: {
                  show: false
                },
                emphasis: {
                  label: {
                    show: false
                  }
                }
              }
            ],
            {
              name: 'min line on close',
              type: 'min',
              valueDim: 'close'
            },
            {
              name: 'max line on close',
              type: 'max',
              valueDim: 'close'
            }
          ]
        }
      },
      {
        name: 'MA5',
        type: 'line',
        data: calculateMA(5),
        smooth: true,
        lineStyle: {
          opacity: 0.5
        }
      },
      {
        name: 'MA10',
        type: 'line',
        data: calculateMA(10),
        smooth: true,
        lineStyle: {
          opacity: 0.5
        }
      },
      {
        name: 'MA20',
        type: 'line',
        data: calculateMA(20),
        smooth: true,
        lineStyle: {
          opacity: 0.5
        }
      },
      {
        name: 'MA30',
        type: 'line',
        data: calculateMA(30),
        smooth: true,
        lineStyle: {
          opacity: 0.5
        }
      }
    ]
  };
  myChart.setOption(option);
  window.addEventListener('resize', function () {
    myChart.resize();
  })
})();
写在最后
当初选择的时候想了很多种可以做的方向和思路,在这里也提供给大家,感兴趣的也可以自己试试,有任何问题可加本人vx联系交流
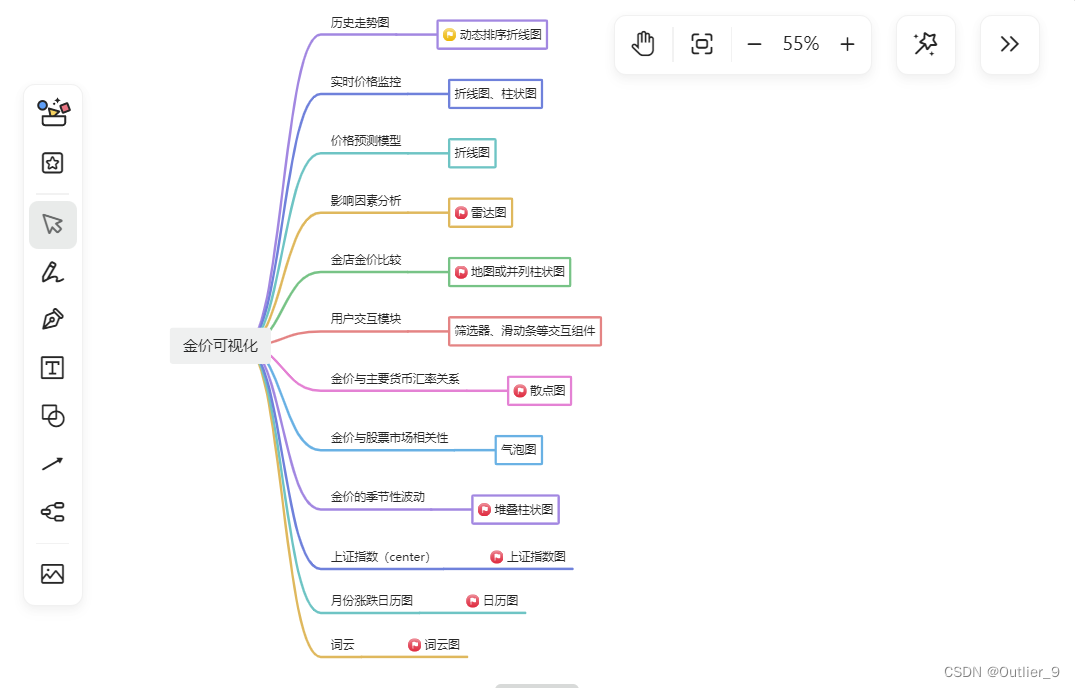
历史走势图:
- 展示金价的历史走势,可以是日、周、月、年等不同时间尺度的变化趋势图,帮助用户了解金价的长期走势。
- 折线图:展示金价随时间的变化趋势,清晰地显示出历史价格的波动情况。
实时价格监控:
- 实时更新金价,显示最新的价格,并配以动态图表或实时数据,让用户了解金价的最新动向。
- 实时折线图或动态柱状图:以实时更新的方式显示金价随时间的变化,让用户能够及时了解最新的价格情况。
价格预测模型:
- 基于历史数据和其他因素,展示金价的预测走势图,帮助用户做出未来金价可能走势的预测。
- 折线图:展示基于预测模型得出的金价未来走势,可以通过不同线条或颜色表示不同的预测结果。
影响因素分析:
- 展示金价受到影响的各种因素,比如经济指标、地缘政治事件、货币政策等,以图表形式呈现它们对金价的影响程度和趋势。
- 堆叠面积图或雷达图:以图表形式展示不同因素对金价的影响程度,让用户一目了然地了解各个因素的相对重要性。
金店价格比较:
- 将不同金店的金价进行对比,以地图或条形图等形式展示金价的变化情况,帮助用户了解金店金价的差异。
- 地图或并列柱状图:地图可以直观地展示不同金店的金价情况,而并列柱状图则可以更直观地比较不同金店的金价水平。
用户交互模块:
- 提供用户交互功能,比如筛选时间范围、比较不同数据指标、添加自定义标记等,让用户根据自己的需求定制可视化内容。
- 筛选器、滑动条等交互组件:提供用户选择时间范围、比较不同指标、添加标记等功能的交互组件,让用户能够根据自己的需求自定义可视化内容。
金价与主要货币汇率关系:
- 展示金价与主要货币(如美元、欧元)的汇率关系。
- 散点图:X轴为货币汇率,Y轴为金价。
金价与股票市场相关性:
- 分析金价与股票市场(如道琼斯指数、纳斯达克指数)的相关性。
- 气泡图:大小代表相关性的强度。
金价的季节性波动:
- 展示金价在一年中不同季节的波动趋势。
- 堆叠柱状图:每个季节的金价波动用不同颜色表示


 被折叠的 条评论
为什么被折叠?
被折叠的 条评论
为什么被折叠?
 到【灌水乐园】发言


