


项目名称:天气预报的数据爬取存储和可视化处理项目
项目环境:pycharm,python3.9,
jupyter notebook 6.4.6等
项目叙述:
本项目是通过爬虫技术从中国气象网爬取天气数据,数据存储,并且进行
数据可视化。
项目步骤:
一,数据爬取:使用requests库抓取网站上的天气数据,运用BeautifulSoup(或者lmxml)提取所需要的数据,其中包括日期、气温、风向、风级、pm25等信息
1.创建网页获取模块(.py文件)
import requests
import  time
# import logging

def download(url):
    headers = {
        "user-agent": "Mozilla/5.0 (Windows NT 10.0; Win64; x64) AppleWebKit/537.36 (KHTML, like Gecko) Chrome/122.0.0.0 Safari/537.36 Edg/122.0.0.0"
    }
    try:
        response = requests.get(url, headers=headers)
        #通常用于检查请求的响应是否出现了错误
        response.raise_for_status()
        response.encoding = response.apparent_encoding
        time.sleep(0.1)
        print(url,"访问成功")
        #返回数据的文本形式
        return response.text
    except:
        print(url,"访问错误")
        return ""

def downloadcontent(url):
    for i in range(1):
        headers = {
            "user-agent": "Mozilla/5.0 (Windows NT 10.0; Win64; x64) AppleWebKit/537.36 (KHTML, like Gecko) Chrome/119.0.0.0 Safari/537.36 Edg/119.0.0.0"
        }
        try:
            # try内部写有可能会出错的代码
            # 获取网页数据
            # 返回一个response对象
            response = requests.get(url, headers=headers)
            response.raise_for_status()
            # 设置编码
            response.encoding = response.apparent_encoding
            time.sleep(0.1)
            print(url, "访问成功")
            # 返回二进制形式
            return response.content
        except:
            # 如果出错了会执行这个
            print(url, "访问错误")
            return ""
2.核心代码
from download import download
from bs4 import BeautifulSoup
#定义获取城市天气情况模块
def get_city_data(url1:str) -> list:
# 1.获取当前url的数据
url1_text = download(url1)
# 2.数据格式化
bs = BeautifulSoup(url1_text, "html.parser")
# 3.获取需要的数据
data = bs.find('div', {"id":"7d"}).find("ul").find_all("li")
# print(data)
# 将数据放到大列表中,每天的数据放到一个小列表中
weeks_data = []
# 获取城市信息
city = bs.find("div",{"class":"crumbs fl"}).find_all("a")[-1].string
# print(city)
for day in data:
# 获取每天的日期、温度、天气、风级
temp = [city]
# 获取日期
date = day.find("h1").string
# print(date[0:date.index("日")])
# print(date.split("日")[0])
date = date[0:date.index("日")]
temp.append(date)
# 获取所有其他天气数据
info = day.find_all("p")
# 天气信息
temp.append(info[0].string)
# 获取最高温度和最低温度
lower = info[1].find("i").string.split("℃")[0]
heigh = info[1].find("span").string
temp.append(lower)
temp.append(heigh)
# 获取风向
wind = info[2].find_all("span")
temp.append(wind[0]["title"]+"转"+wind[1]["title"])
# print(wind[0].title+"转"+wind[1].title)
# 获取风级
temp.append(info[2].find("i").string)
weeks_data.append(temp)
return weeks_data
url_prefix = "http://www.weather.com.cn"
# 1. 获取所有城市的url
index = "http://www.weather.com.cn/textFC/hb.shtml"
## 获取入口网页的数据
all_area_text = download(index)
## 从入口网页中获取所有域名的url
bs = BeautifulSoup(all_area_text, "html.parser")
all_area = bs.find("ul", {"class":"lq_contentboxTab2"}).find_all("a")
#all_area包括华北,华东,东北,华东,华南,西北,西南,港澳台
import csv
#weeks_data = get_city_data("http://www.weather.com.cn/weather/101250101.shtml")
# csv模块=>会自动加换行符
f = open("weacher7.csv","w",newline="")
f_csv = csv.writer(f)
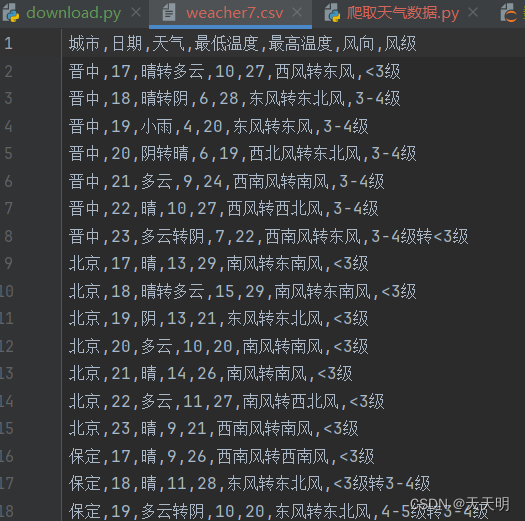
header = ["城市","日期","天气","最低温度","最高温度","风向","风级"]
f_csv.writerow(header)
## 在区域的网页获取所有城市信息
for area in all_area:
# print(url_prefix+area["href"])
area_text = download(url_prefix+area["href"])
bs = BeautifulSoup(area_text, "html.parser")
# 获取省信息
all_region = list(set(bs.find_all("td", {"width":74,"class":"rowsPan"})))
for region in all_region:
region_text = download(url_prefix + region.find("a")["href"])
all_city = list(set(bs.find_all("td", {"width":83,"height":23})))
# 2. 将所有城市都调用get_city_data获取数据
for city in all_city:
# print(city)
city_data = get_city_data(city.find("a")["href"])
# 3. 将获取到的数据写入到文件
#print(str(city_data[0]))
f_csv.writerows(city_data)
f.close()###核心代码思路:
download函数被调用来获取指定 URL 的页面内容。- 使用 BeautifulSoup 库对页面内容进行解析。
- 从页面中定位需要的数据。先获取地域,再遍历地域获取省份,子循环遍历省份得到城市信息。
- 对一个城市的每一天的数据进行遍历,并提取日期、温度、天气、风向和风级等信息。
- 将每天的数据存储在一个小列表中,并将所有天的数据存储在一个大列表中。
- 返回包含所有天气数据的大列表。
3.结果
二,数据存储:将已经得到的csv文件上传到腾讯云和数据库上
1.上传到腾讯云
核心代码:(用到qcloud_cos模块)
from qcloud_cos import CosConfig
from qcloud_cos import CosS3Client
from qcloud_cos.cos_exception import CosClientError, CosServiceError
import sys
import os
import logging

# 正常情况日志级别使用 INFO,需要定位时可以修改为 DEBUG,此时 SDK 会打印和服务端的通信信息
logging.basicConfig(level=logging.INFO, stream=sys.stdout)

def upload(key,path,bucket='tiantianming-1325650559'):
    # 1. 设置用户属性, 包括 secret_id, secret_key, region 等。Appid 已在 CosConfig 中移除,请在参数 Bucket 中带上 Appid。Bucket 由 BucketName-Appid 组成
    secret_id = '用户的 SecretId'  # 用户的 SecretId,建议使用子账号密钥,授权遵循最小权限指引,降低使用风险。子账号密钥获取可参见 https://cloud.tencent.com/document/product/598/37140
    secret_key = '用户的 SecretKey'  # 用户的 SecretKey,建议使用子账号密钥,授权遵循最小权限指引,降低使用风险。子账号密钥获取可参见 https://cloud.tencent.com/document/product/598/37140
    region = 'ap-guangzhou'  # 替换为用户的 region,已创建桶归属的 region 可以在控制台查看,https://console.cloud.tencent.com/cos5/bucket
    # COS 支持的所有 region 列表参见 https://cloud.tencent.com/document/product/436/6224
    token = None  # 如果使用永久密钥不需要填入 token,如果使用临时密钥需要填入,临时密钥生成和使用指引参见 https://cloud.tencent.com/document/product/436/14048
    scheme = 'https'  # 指定使用 http/https 协议来访问 COS,默认为 https,可不填

    config = CosConfig(Region=region, SecretId=secret_id, SecretKey=secret_key, Token=token, Scheme=scheme)
    client = CosS3Client(config)

    # 使用高级接口上传一次,不重试,此时没有使用断点续传的功能

    # 使用高级接口断点续传,失败重试时不会上传已成功的分块(这里重试10次)
    for i in range(0, 10):
        try:
            response = client.upload_file(
                Bucket= bucket,
                Key= key,
                LocalFilePath= path)
            break
        except CosClientError or CosServiceError as e:
            print(e)

    url = f"{scheme}://{bucket}.cos.{region}.myqcloud.com/{key}"
    return url


#上传到腾讯云
upload("./weacher7.csv","./weacher7.csv")
2.上传到数据库
核心代码:(用到csv和pymysql模块)
import csv
import pymysql

conn = pymysql.connect(
    host="192.168.29.128",
    port=3306,
    user="root",
    password="123456",
    database="weather"
)
cursor = conn.cursor()
cursor.execute("DROP TABLE IF EXISTS tianqi ")
sql = """create table tianqi (
            city varchar(20),
            data char(20),
            weather char(20),
            maxx varchar(20),
            minx varchar(20),
            fengx varchar(20),
            fengj varchar(20))"""
cursor.execute(sql)

# 打开 CSV 文件,并创建一个 CSV 读取器对象
csv_file_path = './weacher7.csv'
with open(csv_file_path, 'r', newline='') as file:
    csv_reader = csv.reader(file)
    next(csv_reader)  # 跳过 CSV 文件的标题行(如果有)

    # 逐行读取 CSV 文件内容,并插入到数据库表中
    for row in csv_reader:
        # 构造插入 SQL 语句
        print(row,type(row))
        insert_query = "INSERT INTO  tianqi VALUES (%s,%s,%s,%s,%s,%s,%s)"

        # 执行插入操作
        cursor.execute(insert_query, row)

# 提交事务并关闭连接
conn.commit()
conn.close()
注意事项:数据库和pycharm都设置为 UTF-8
三,数据清洗与整理:使用jupyter notebook,用pandas模块对数据进行清洗和整理
核心代码:
import pandas as pd
df = pd.read_csv("./weacher7.csv")
df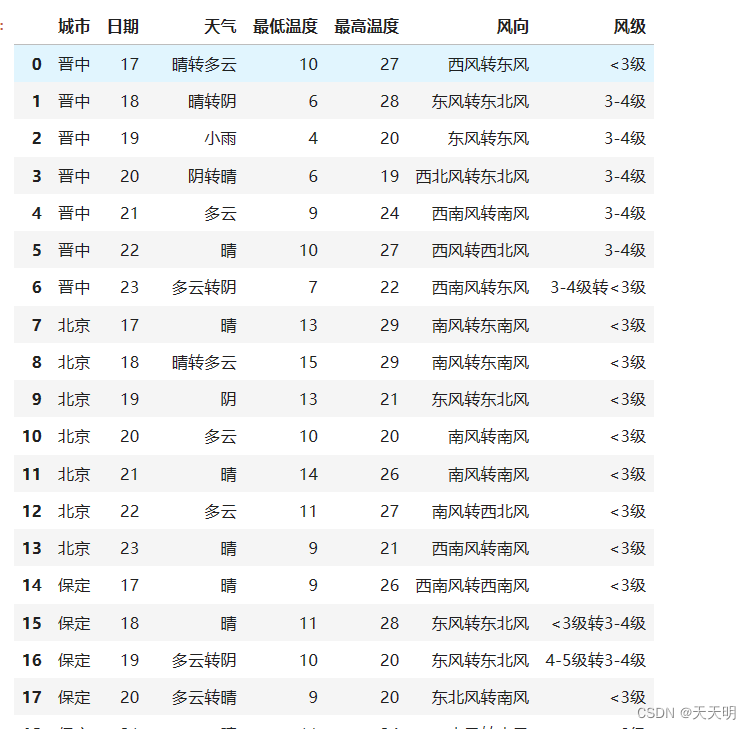
清洗数据:削去全为空的列和行
df.dropna(axis="columns", how="all", inplace=True)
df.dropna(axis="index", how="all", inplace=True)
df
增加“温度类型“一列并且把城市名作为索引便于后面查询:
def get_wendu_type(x):
    if x["最高温度"] >28:
        return "高温"
    if x["最低温度"] < 10:
        return "低温"
    return "常温"
df["温度类型"] = df.apply(get_wendu_type, axis=1)
df = df.set_index('城市')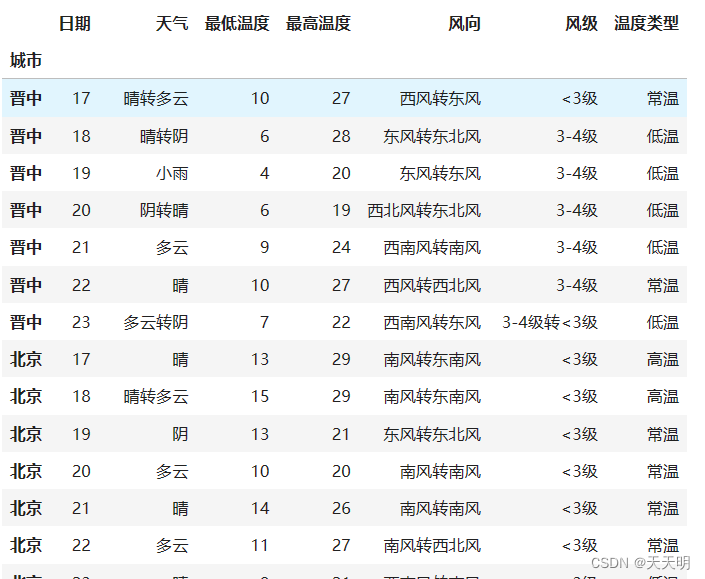
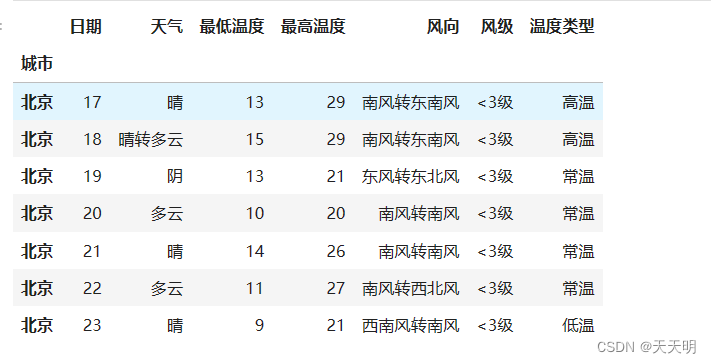
四,数据可视化:选择一个你想要查询的城市:(用Pyecharts库)
例如:”北京”
df2=df.loc['北京',:]
df2
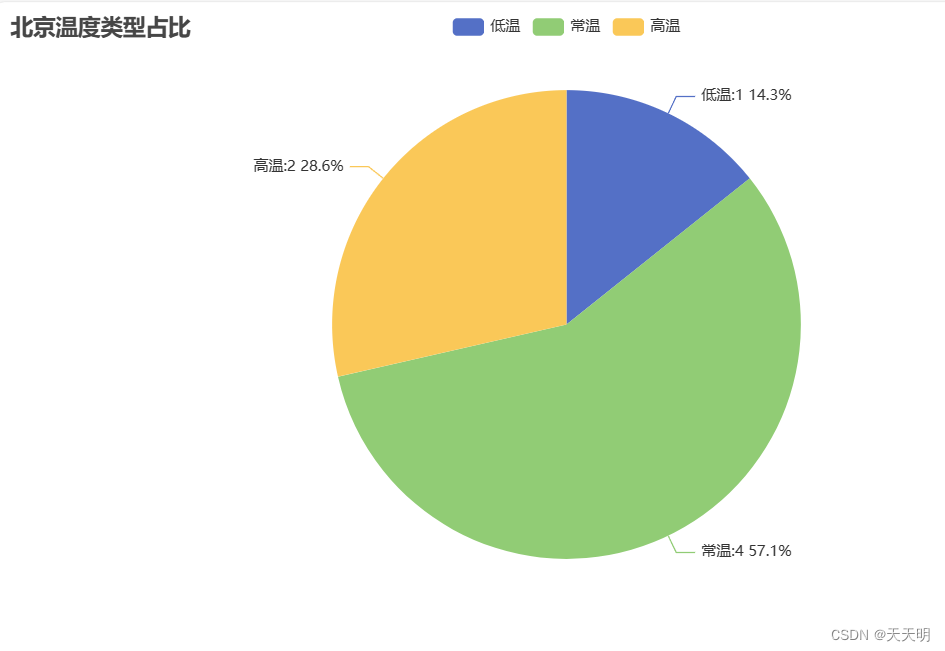
1.统计温度类型占比=> 高温、低温、常温比例 => 饼图
from pyecharts.charts import Pie
from pyecharts import options as opts


y_data = df2.groupby("温度类型")["日期"].count()
datas = [(item, int(y_data[item])) for item in y_data.index]

print(y_data)
# 创建图
c = (
    Pie()
    .add("温度类型占比", datas, percent_precision=1)
    .set_global_opts(title_opts=opts.TitleOpts(title="北京温度类型占比"))
    .set_series_opts(
        label_opts=opts.LabelOpts(formatter="{b}:{c} {d}%"),
        tooltip_opts=opts.TooltipOpts(formatter="{b}:{d}%")
    )
)

c.render()
缓存到相应的文件路径,打开render.html
2.温度类型做成柱状图 -> 排序
# 温度类型做成柱状图 -> 排序
from pyecharts import options as opts
from pyecharts.charts import Bar
from pyecharts.faker import Faker

y_data = df2.groupby("温度类型")["日期"].count().sort_values()
# y_data = df.groupby("aqiInfo")["ymd"].count()
data = [int(y_data[item]) for item in  y_data.index]


c = (
    Bar()
    .add_xaxis(list(y_data.index))
    .add_yaxis("北京", data)
    .set_global_opts(title_opts=opts.TitleOpts(title="北京天气", subtitle="温度类型统计"))
)
c.render()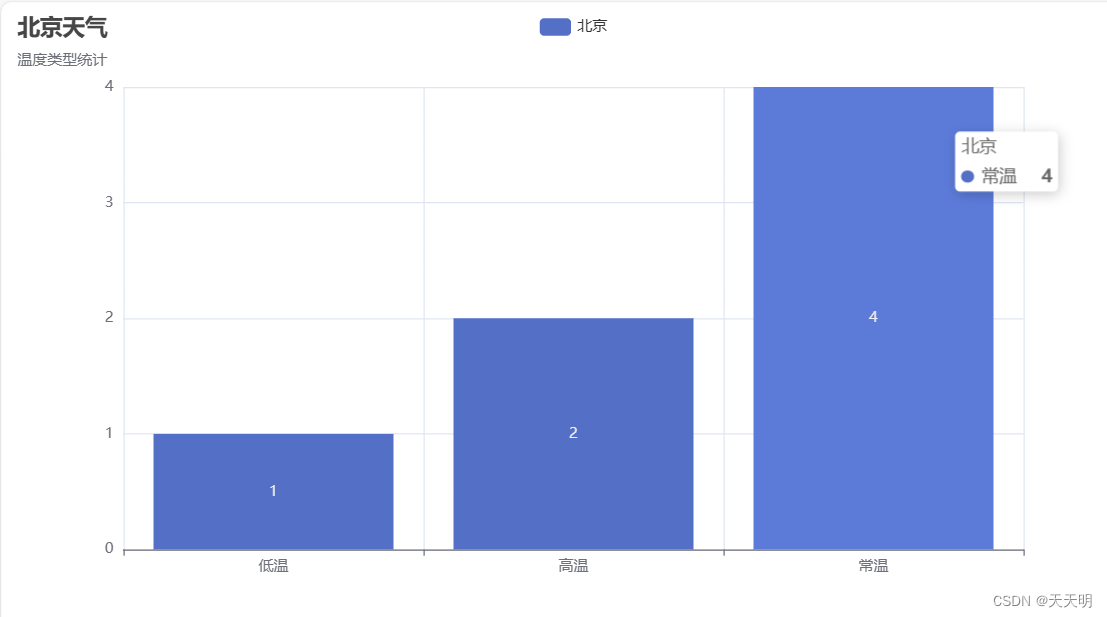
3.使用 matplotlib 绘制天气曲线图
# pip install matplotlibdata = df.groupby("日期").agg({"最高温度":"max", "最低温度":"min"})
data.plot()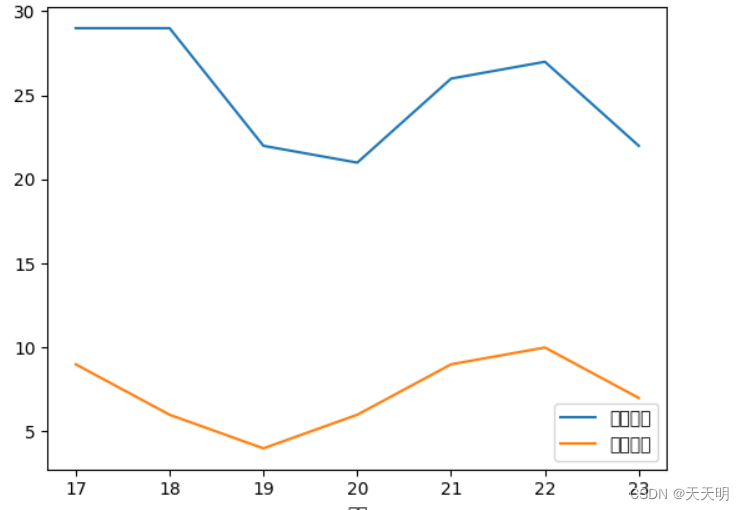
还可以进行其他分类和可视化,这里就不再叙述了。


 2237
2237

 被折叠的 条评论
为什么被折叠?
被折叠的 条评论
为什么被折叠?
 到【灌水乐园】发言


