


 文章描述了一个项目中如何封装并使用ECharts组件,通过后端返回的数据动态创建线性图,包括时间轴、数据系列和颜色配置。组件能根据用户交互实时更新图表,且处理了图表实例的生命周期管理问题。
项目里封装了一个echarts组件,后端返回数据
{
    "code": 0,
    "msg": "请求成功",
    "data": [
        {
            "legend": "机组效率",
            "abscissa": [
                "2023-10-07",
                "2023-10-08",
                "2023-10-09",
                "2023-10-10",
                "2023-10-11",
                "2023-10-12",
                "2023-10-13"
            ],
            "ordinate": [
                "37.16",
                "43.73",
                "48.15",
                "33.45",
                "44.52",
                "43.57",
                "55.44"
            ]
        },
        {
            "legend": "节流率",
            "abscissa": [
                "2023-10-07",
                "2023-10-08",
                "2023-10-09",
                "2023-10-10",
                "2023-10-11",
                "2023-10-12",
                "2023-10-13"
            ],
            "ordinate": [
                "1.99",
                "1.99",
                "1.99",
                "1.99",
                "1.99",
                "1.99",
                "1.92"
            ]
        }
    ]
}
前端组件,
import React, { Component } from 'react';
import * as echarts from 'echarts';

interface TrendChartProps {
    trendData: any[];
}
const ColorList = ['#70EEED','#0F68FF', '#1FF3FF', '#FFA600', '#F0FFFF', '#FFDAB9', '#FFE4C4', '#FFF8DC', '#FF4500',
    '#FFD700', '#FFFACD', '#FFF5EE', '#FFDAB9', '#FF3030', '#FF8C69', '#FFB347', '#EE82EE', '#FFA500'];
class DeviceFlowTrend extends Component<TrendChartProps, {}> {
    chartRef = React.createRef<HTMLDivElement>();
    chart: echarts.ECharts | null = null;

    componentDidMount() {
        this.initChart();
        window.addEventListener('resize', this.handleResize);
    }
    componentDidUpdate(prevProps: any) {
        if (JSON.stringify(prevProps) !== JSON.stringify(this.props)) {
            this.initChart();
        }
    }
    componentWillUnmount() {
        this.chart?.dispose();
        window.removeEventListener('resize', this.handleResize);
    }

    initChart() {
        const element = this.chartRef.current;
        this.chart?.dispose();
        if (!element) return;
        this.chart = echarts.init(element);
        this.updateChart();
    }

    updateChart() {
        if (this.chart==null) return;
        const { trendData } = this.props;
        const option: echarts.EChartOption = {
            tooltip: {
                trigger: 'axis',
                showDelay:10,
                axisPointer: { // 坐标轴指示器,坐标轴触发有效
                    type: 'shadow', // 默认为直线,可选为:'line' | 'shadow'
                    shadowStyle: {
                        color: 'rgba(112,112,112,0)',
                    },
                },
                padding: [8, 10], //内边距
            },
            grid: {
                containLabel: true, // 保证图表不被坐标轴占用
                left: '0%',
                right: '0%',
                top: '10%',
                bottom: '5%',
            },
            legend: {
                right: 15,
                textStyle: {
                    color: 'rgba(255,255,255,0.5)'
                },
                icon: 'circle', // 将图例的标记形状更改为无背景空心圆圈
                 data: trendData.map((item: any) => item.legend)
            },
            xAxis: {
                type: 'category',
                name: '时间',
                data: trendData[0]?.abscissa,
                axisTick: {
                    alignWithLabel: false
                },
                axisLine: {
                    lineStyle: {
                        color: '#eee'
                    }
                },
                axisLabel: {
                    fontSize: 12,
                    color: 'rgba(255,255,255)'
                },

            },
            yAxis: {
                type: "value",
                // name: "x=[时间] y=[名称] ",
                // nameTextStyle: {
                //     color: "rgba(255,255,255,0.5)"
                // },
                splitLine: {
                    show: true
                },
                axisTick: {
                    show: true
                },
                axisLine: {
                    show: true,
                    lineStyle: {
                        color: '#eee'
                    }
                },
                axisLabel: {
                    fontSize: 12,
                    color: 'rgba(255,255,255)'
                },
            },

            series: trendData.map((item: any, index: number) => ({
                name: item.legend,
                data: item.ordinate,
                type: 'line',
                symbol: 'circle',
                markPoint: {
                    label: {
                        normal: {
                            textStyle: {
                                color: '#fff'
                            }
                        }
                    },

                },
                itemStyle: {
                    color: ColorList[index],// 指定柱子颜色
                    emphasis: {
                        // 更改标签形状大小
                        barBorderRadius: 15
                    }
                }
            }))
        };

        this.chart.setOption(option);

    }

    handleResize = () => {
        if (this.chart) {
            this.chart.resize();
        }
    };


    render() {
        return <div ref={this.chartRef} style={{ height: '95%', width: '95%', margin: 'auto' }} />
    }

}
由于项目中是点击树切换图表,所以图表 实例在每次重绘之后并不能销毁,所以在 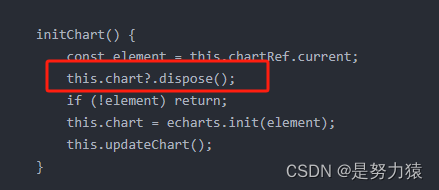
加上 this.chart?.dispose();就可以解决此问题


 902
902


 被折叠的 条评论
为什么被折叠?
被折叠的 条评论
为什么被折叠?
 到【灌水乐园】发言


