


1.所需图案样式
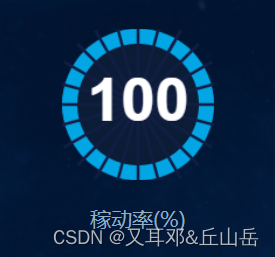
2.封装了一个组件可以直接用
*注:isBoard这个变量是用来控制图列的大小,项目中多次用到这个图列但大小不同
<template>
  <div class="content">
    <div ref="ringEchart" :class="{ mainBoard: props.isBoard, detailBoard: !props.isBoard }"></div>
  </div>
</template>

<script setup>
import { ref, onMounted, watch, defineProps } from "vue";
import * as echarts from "echarts";

// 定义接收的 props,fromParent 是接收父组件传递过来的属性
const props = defineProps({
  // 数值
  shiftOee: Number,
  isBoard: Boolean,
});
const ringEchart = ref(null);
function initChart() {
  const chart = echarts.init(ringEchart.value);
  const option = {
    title: {
      text: props.shiftOee,
      x: "center",
      y: "center",
      textStyle: {
        width: 21,
        height: 16,
        fontFamily: "Arial",
        fontWeight: "bold",
        // lineHeight: 133,
        color: "#fff",
        fontSize: props.isBoard ? 26 : 52,
      },
    },
    series: [
      {
        type: "pie",
        radius: ["100%", "70%"],
        silent: true,
        clockwise: true,
        startAngle: 90,
        z: 0,
        zlevel: 0,
        label: {
          position: "center",
        },
        data: [
          {
            value: props.shiftOee,
            // value
            name: "",
            itemStyle: {
              color: "#03A6E5",
            },
          },
          {
            value: props.shiftOee <= 100 ? 100 - props.shiftOee : 0,
            // 100 - value
            name: "",
            label: {
              show: false,
            },
            itemStyle: {
              color: "#2A4363",
            },
          },
        ],
      },
      {
        name: "分割线",
        type: "gauge",
        radius: props.isBoard ? "100%" : "128%", //配合splitLine里的length一起调
        clockwise: true,
        center: ["50%", "50%"],
        startAngle: "60",
        endAngle: "-299.9999",
        // startAngle: "0",
        // endAngle: "359.9",
        splitNumber: 24,
        // zlevel: 2,
        // detail: {
        //   offsetCenter: [10, 20],
        //   formatter: " ",
        // },
        axisLine: {
          lineStyle: {
            width: 0,
            opacity: 0,
          },
        },
        axisTick: {
          show: false,
        },
        markArea: {
          itemStyle: {
            color: "#0f0",
          },
        },
        splitLine: {
          show: true,
          length: 100, //配合radius一起调
          padding: [0, 0, 0],
          lineStyle: {
            color: "#121d43",
            width: 2.5,
          },
        },
        axisLabel: {
          show: false,
        },
      },
      {
        type: "pie",
        radius: "80%",
        center: ["50%", "50%"],
        silent: true,
        clockwise: true,
        startAngle: 90,
        z: 0,
        zlevel: 0,
        label: {
          position: "center",
        },
        data: [
          {
            value: 0,
            name: "",
            label: {
              show: false,
            },
            itemStyle: {
              color: "rgba(11,28,55)",
            },
          },
        ],
      },
    ],
  };
  chart.setOption(option);
}

watch(() => props.shiftOee, initChart);

onMounted(() => {
  //一定要在DOM渲染结束后,再去加载。因而延迟请求
  setTimeout(() => {
    initChart();
  }, 100);
});
</script>

<style scoped>
.mainBoard {
  width: 92px;
  height: 92px;
  margin-bottom: 8px;
  margin-top: 10px;
  margin-right: 10px;
}
.detailBoard {
  width: 130px;
  height: 130px;
  margin-bottom: 21px;
  /*fontSize:50px,*/
  /*margin-bottom: 8px;*/
}
</style>
3.运用
在所需页面引入组件
import statusEcharts from "./statusEcharts.vue";<statusEcharts ref="echartsViews_rate" :isBoard="true" :shiftOee="100"></statusEcharts>希望对你们有所帮助o(* ̄▽ ̄*)ブ


 1072
1072


 被折叠的 条评论
为什么被折叠?
被折叠的 条评论
为什么被折叠?
 到【灌水乐园】发言


