


 本文介绍了使用Python实现的一种股票交易策略,通过计算高低点(pivotpoints)并结合趋势线检测,对股票数据进行分析,以辅助交易决策。主要涉及pivot函数的定义和应用在trend_lines函数中的操作,展示了如何处理价格数据以识别可能的趋势变化点。
import pandas as pd
import numpy as np
import matplotlib.pyplot as plt
def pivothigh(highs,lows, left=20, right=20):
        pivot_high = np.zeros(len(highs))
        pivot_low =  np.zeros(len(highs))
        for i in range(len(highs)):
            if i >= (left + right):
                rolling_high = highs[i-right-left+1:i+1]
                rolling_low = lows[i-right-left+1:i+1]
                m_high = np.max(rolling_high)
                m_low = np.min(rolling_low)

                if highs[i-right] == m_high:
                    pivot_high[i] = m_high
                else:
                    pivot_high[i] = np.nan


                if lows[i-right] == m_low:
                    pivot_low[i] = m_low
                else:
                    pivot_low[i] = np.nan
        return pivot_high, pivot_low
def pivot(highs,lows,left,right):
    # highs =  self.kl_datas[symbol][interval]["df"]["High"]
    # lows =   self.kl_datas[symbol][interval]["df"]["Low"]
    swh, swl = pivothigh(highs=highs,lows=lows,left=left ,right=right )
    hprice = [0]
    lprice = [0]
    le = [[0, False, 0]]
    se = [[0, False, 0]]
    les = []
    ses = []
    for idx, (swh_, swl_) in enumerate(zip(swh, swl)):
        swh_cond = not np.isnan(swh_)
        hprice.append(swh_ if swh_cond else False)

        # hprice.append(swh_ if swh_cond else hprice[-1])
        le_ = False
        if swh_cond:
            le_ = True
        elif le[-1][1] and highs[idx] > hprice[-1] :
            le_ = False
        else:
            le_ = le[-1][1]
        swl_cond = not np.isnan(swl_)
        lprice.append(swl_ if swl_cond else False)

        # lprice.append(swl_ if swl_cond else lprice[-1])
        se_ = False
        if swl_cond:
            se_ = True
        elif se[-1][1] and lows[idx] < lprice[-1] :
            se_ = False
        else:
            se_ = se[-1][1]
        flag = 0
        if se_  == True and le_ == False:
            flag = 1
        elif se_  == False and le_ == True:
            flag = -1
        elif se_  == True and le_ == True:
            flag = se[-1][2]
        se.append([idx, se_, flag])
        le.append([idx, le_, flag])
        les.append(le_)
        ses.append(se_)
    return hprice, lprice

def trend_lines(highs, opens, closes, lows):
    tail = 4982
    highs = highs[:tail]
    opens = opens[:tail]
    closes = closes[:tail]
    lows = lows[:tail]
    # bar_index = 4000
    # 定义函数,用于添加元素到数组
    def add_to_array(apointer1, apointer2, val):
        apointer1.insert(0, val)
        apointer2.insert(0, bar_index)
        apointer1.pop()
        apointer2.pop()

    # 初始化变量
    prd = 6
    PPnum = 2  #枢轴点数量,现在可以=2了
    utcol = 'lime'  # 你可以根据需要修改颜色
    dtcol = 'red'   # 你可以根据需要修改颜色


    phs,pls = pivot(highs=highs,lows=lows, left=prd, right=prd)
    bln = []
    tln = []
    tval = [np.nan] * PPnum
    tpos = [np.nan] * PPnum
    bval = [np.nan] * PPnum
    bpos = [np.nan] * PPnum
    # print(len(closes))
    for i in range(50,len(closes)):

        ph = phs[i]
        pl = pls[i]
        bar_index = i
        if ph:
            add_to_array(tval, tpos, ph)
            # plt.scatter(i,ph, c="blue")
        if pl:
            add_to_array(bval, bpos, pl)
            # plt.scatter(i,pl, c="green")


        maxline = 3
        countlinelo_short = 0
        countlinelo_long = 0

        for p1 in range(PPnum -2 + 1  if PPnum - 2 <=2 else PPnum -2):
            uv1 = 0.0
            uv2 = 0.0
            up1 = 0
            up2 = 0
            # print("-+++++++++++++++++-")
            if countlinelo_long <= maxline:
            # if 1:

                for p2 in np.arange(PPnum - 1, p1 + 1+1 if PPnum -1 == p1 + 1 else p1 + 1, step=-1 if PPnum-1 > p1+1 else 1):
                    val1 = bval[p1]
                    val2 = bval[p2]
                    pos1 = bpos[p1]
                    pos2 = bpos[p2]
                    # print("----------------------------------")
                    if val1 > val2:
                        diff = (val1 - val2) / float(pos1 - pos2)  #直线的斜率
                        hline = val2 + diff   #
                        lloc = bar_index
                        lval = lows[i]
                        valid = True

                        for j in np.arange(pos2 + 1 - prd, bar_index, step= -1 if pos2 + 1-prd > bar_index else 1):
                            if closes[:i][-(bar_index-j+1)] < hline:
                                valid = False
                                break
                            lloc = j
                            lval = hline
                            hline = hline + diff

                        if valid:
                            uv1 = hline - diff
                            uv2 = val2
                            up1 = lloc
                            up2 = pos2
                            break

            dv1 = 0.0
            dv2 = 0.0
            dp1 = 0
            dp2 = 0
            if countlinelo_short <= maxline:
                for p2 in np.arange(PPnum - 1, p1 + 1+1 if PPnum -1 == p1 + 1 else p1 + 1,step=-1 if PPnum -1 > p1+1 else 1):
                    val1 = tval[p1]
                    val2 = tval[p2]
                    pos1 = tpos[p1]
                    pos2 = tpos[p2]
                    if val1 < val2:
                        diff = (val2 - val1) / float(pos1 - pos2)
                        hline = val2 - diff
                        lloc = bar_index
                        lval = highs[i]
                        valid = True
                        for k in np.arange(pos2 + 1 - prd, bar_index, step = -1 if pos2 + 1 - prd> bar_index else 1):
                            if closes[:i][-(bar_index-k+1)] > hline:
                                valid = False
                                break
                            lloc = k
                            lval = hline
                            hline = hline - diff
                        if valid:
                            dv1 = hline + diff
                            dv2 = val2
                            dp1 = lloc
                            dp2 = pos2
                            break
            if up1 != 0 and up2 != 0 and countlinelo_long < maxline:
                countlinelo_long += 1
                bln.append(
                    [up2-prd , uv2, up1, uv1, utcol]  #x1,y1,x2,y2
                )

            if dp1 != 0 and dp2 != 0 and countlinelo_short < maxline:
                countlinelo_short += 1
                tln.append(
                    [dp2-prd , dv2, dp1, dv1, dtcol]
                )
    # plt.plot(highs)
    # plt.plot(lows)
    # plt.plot(closes)
    plt.vlines(np.arange(0, len(closes)), ymin=lows,ymax=highs)
    bln_tem = {}  #去重保留最长的线段
    for bn in bln:
        if bn[0] not in bln_tem.keys():
            bln_tem[bn[0]] = bn
            continue
        t1 = bln_tem[bn[0]]
        t2 = bn
        if t1[3] < t2[3] :
            bln_tem[bn[0]] = t2
    tln_tem = {}
    for bn in tln:
        if bn[0] not in tln_tem.keys():
            tln_tem[bn[0]] = bn
            continue
        t1 = tln_tem[bn[0]]
        t2 = bn
        if t1[3] < t2[3] :
            tln_tem[bn[0]] = t2
    for bn in list(bln_tem.values()):
        plt.plot([int(bn[0]), int(bn[2])], [int(bn[1]), int(bn[3])],color="green")
    for bn in list(tln_tem.values()):
        plt.plot([int(bn[0]), int(bn[2])], [int(bn[1]), int(bn[3])],color="red")
    plt.show()
    return bln_tem.values(), tln_tem.values()

if __name__ == "__main__":
    import pickle
    # import os
    # import cv2
    pkl_name = "F:\python_project\股票数据分析\pkl_file\shape_sim_20231207.pkl"
    with open(pkl_name, "rb") as file:
        data = pickle.load(file)
    num = 0
    symbols = []
    kl_lines = {}
    print("len data", len(data))
    for k in data.keys():
        d = data[k]

        key = list(d.keys())[0]
        d = d[key]['y']
        df = pd.DataFrame.from_dict(d)
        opens = df.loc[:, "o"].values
        highs = df.loc[:, "h"].values
        lows = df.loc[:, "l"].values
        closes = df.loc[:, "c"].values
        trend_lines(highs=highs,lows=lows, opens=opens, closes=closes)
        break
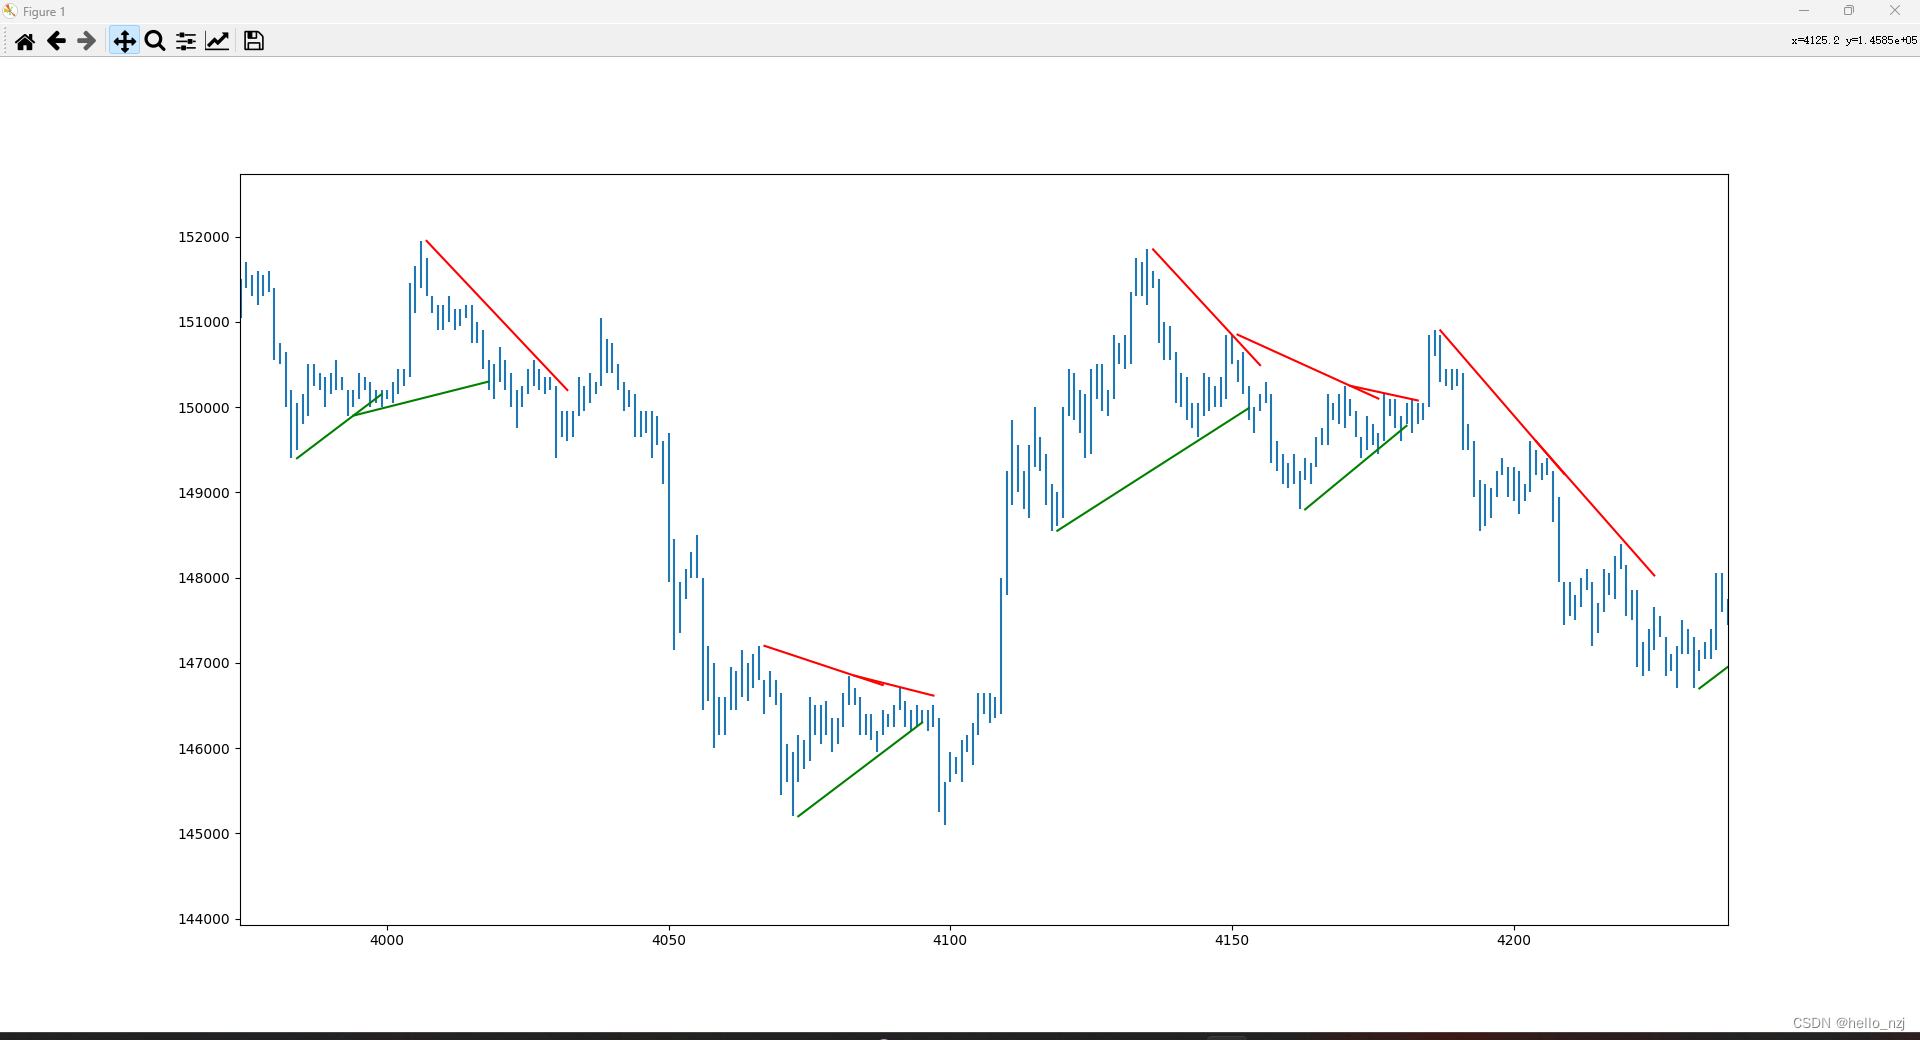
参考了tv上的trLonesomeTheBlue 的trendlines策略 ,原作者使用的语言是pine


 2609
2609


 被折叠的 条评论
为什么被折叠?
被折叠的 条评论
为什么被折叠?
 到【灌水乐园】发言


