


最近课程的老师让介绍一下自己用过的资料,我寻思着在最后加一张用资料画的图,然后就发现了这个问题(以前怎么没发现?疑惑.jpg)
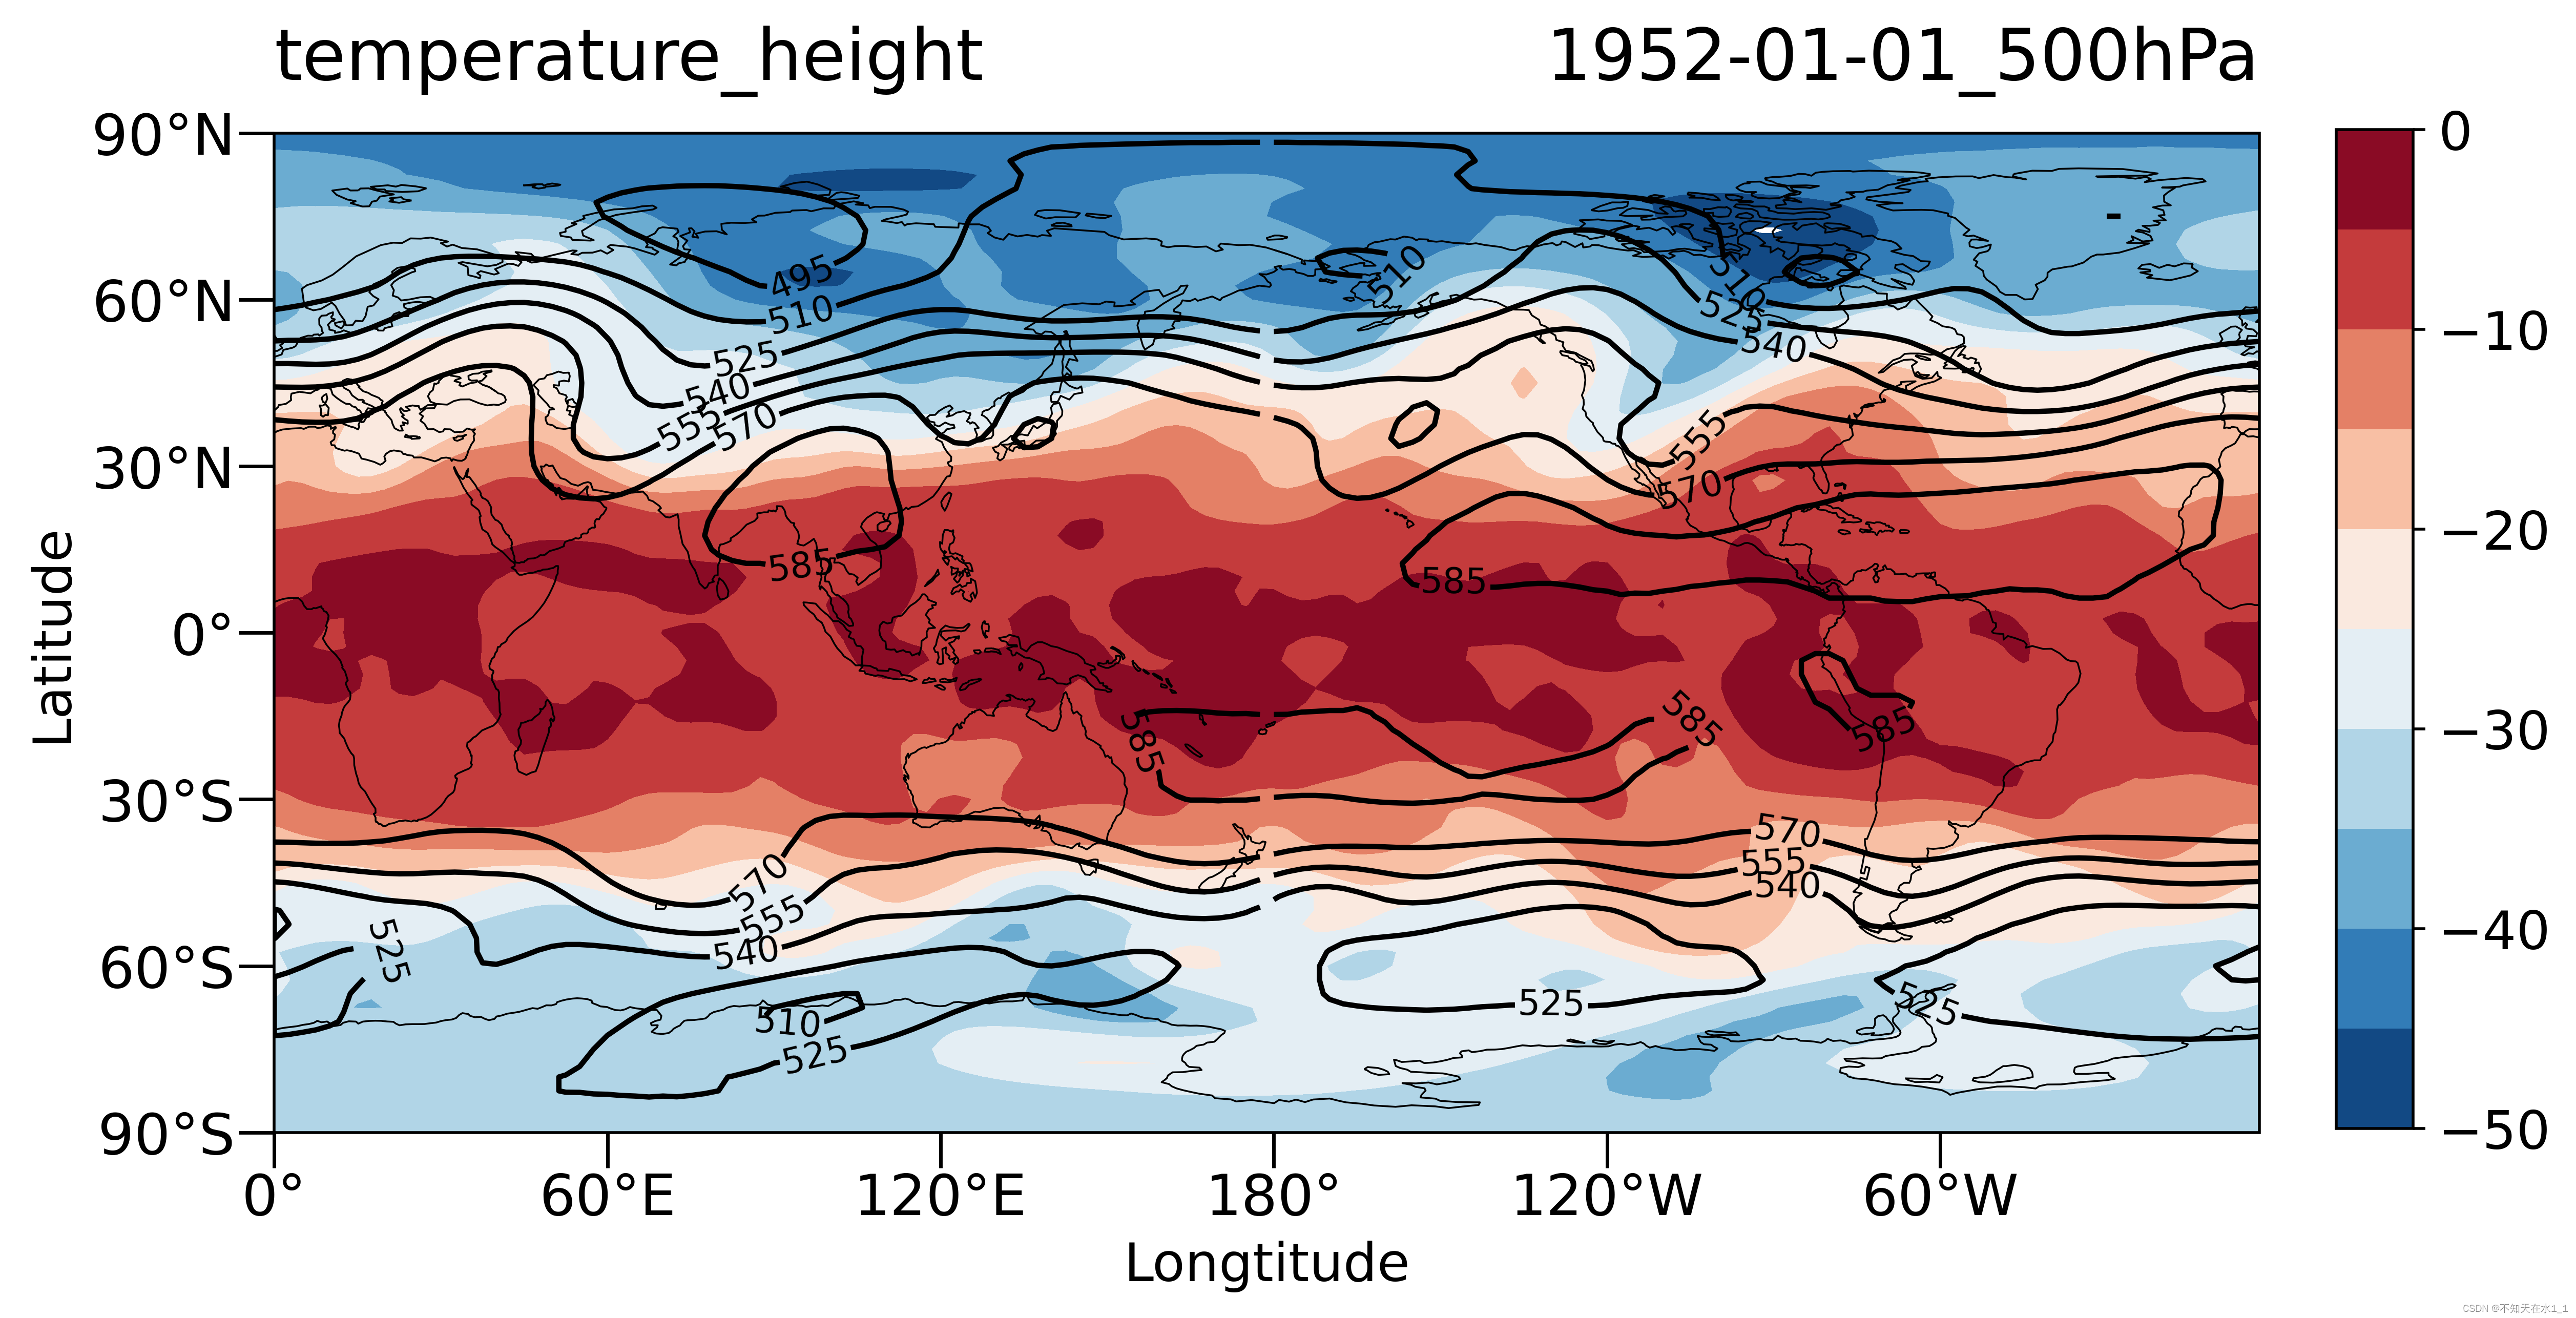
简单的画了一个高度场(500hPa)叠加温度场的图(NCEP的再分析资料)
代码如下:
import xarray as xr
import matplotlib.pyplot as plt#绘图
import cartopy.crs as ccrs#投影
import numpy as np
from cartopy.mpl.ticker import LongitudeFormatter,LatitudeFormatter#经纬度
f1 = xr.open_dataset('C:/Users/24448/Desktop/air.1952.nc')
f2 = xr.open_dataset('C:/Users/24448/Desktop/hgt.1952.nc')
fig = plt.figure(figsize=(10,6),dpi=500)
crs = ccrs.PlateCarree(180)
ax1 = fig.add_subplot(1,1,1,projection=crs)
lon = f1.lon
lat = f1.lat
air = f1.air.loc['1952-01-01',500,:,:]-273.15
hgt = f2.hgt.loc['1952-01-01',500,:,:]/10
cf = ax1.contourf(lon,lat,air,levels=np.arange(-50,1,5),
cmap=plt.cm.RdBu_r,transform=ccrs.PlateCarree())
cycle_hgt, cycle_lon = add_cyclic_point(hgt, coord=lon)
cs = ax1.contour(cycle_lon,lat,cycle_hgt,colors='k',linewidth=0.3)
ax1.clabel(cs,fontsize=10)
ax1.set_xticks(np.arange(0,358,60),crs=ccrs.PlateCarree())
ax1.set_yticks([-90,-60,-30,0,30,60,90],crs=ccrs.PlateCarree())
ax1.xaxis.set_major_formatter(LongitudeFormatter(zero_direction_label =False))
ax1.yaxis.set_major_formatter(LatitudeFormatter())
ax1.tick_params(which='major',direction='out',length=10,width=0.99,pad=1,labelsize=16,
bottom=True, left=True, right=False,top=False)
ax1.set_title('temperature_height',loc='left',pad=15,fontsize=20)#标题
ax1.set_title('1952-01-01_500hPa',loc='right',pad=15,fontsize=20)
ax1.set_xlabel('Longtitude',fontsize=15)#x轴标签
ax1.set_ylabel('Latitude',fontsize=15)#y轴标签
ax1.coastlines(facecolor='None', edgecolor='0.1', linewidth=0.5)
ax=fig.add_axes([0.93,0.18,0.03,0.65]) # 0.25控制距离左边的距离,0.01控制距离下面的距离,最后两位控制color的长度和厚度
cb=fig.colorbar(cf,cax=ax,shrink=0.9,pad=0.04,aspect=15,orientation='vertical')
cb.ax.tick_params(labelsize=15)
plt.show()
#fig.savefig('c:/Users/24448/Desktop/haiqi.png',format='png')
可以发现,填色图一切正常,但是等值线图180°处有一条空缺,找到了一些解决办法,有点半懂不懂,最后在摸鱼大佬的B站视频上找到了解决办法,摸鱼大佬牛逼!!(呐喊.jpg)
解决方法是导入cartopy中的一个函数,然后在画等值线之前使用这个函数,如下:
from cartopy.util import add_cyclic_point
完整代码如下:
import xarray as xr
import matplotlib.pyplot as plt#绘图
import cartopy.crs as ccrs#投影
import numpy as np
from cartopy.util import add_cyclic_point#去除投影中间白线
from cartopy.mpl.ticker import LongitudeFormatter,LatitudeFormatter#经纬度
f1 = xr.open_dataset('C:/Users/24448/Desktop/air.1952.nc')
f2 = xr.open_dataset('C:/Users/24448/Desktop/hgt.1952.nc')
fig = plt.figure(figsize=(10,6),dpi=500)
crs = ccrs.PlateCarree(180)
ax1 = fig.add_subplot(1,1,1,projection=crs)
lon = f1.lon
lat = f1.lat
air = f1.air.loc['1952-01-01',500,:,:]-273.15
hgt = f2.hgt.loc['1952-01-01',500,:,:]/10
cf = ax1.contourf(lon,lat,air,levels=np.arange(-50,1,5),
cmap=plt.cm.RdBu_r,transform=ccrs.PlateCarree())
cycle_hgt, cycle_lon = add_cyclic_point(hgt, coord=lon)
cs = ax1.contour(cycle_lon,lat,cycle_hgt,colors='k',linewidth=0.3)
ax1.clabel(cs,fontsize=10)
ax1.set_xticks(np.arange(0,358,60),crs=ccrs.PlateCarree())
ax1.set_yticks([-90,-60,-30,0,30,60,90],crs=ccrs.PlateCarree())
ax1.xaxis.set_major_formatter(LongitudeFormatter(zero_direction_label =False))
ax1.yaxis.set_major_formatter(LatitudeFormatter())
ax1.tick_params(which='major',direction='out',length=10,width=0.99,pad=1,labelsize=16,
bottom=True, left=True, right=False,top=False)
ax1.set_title('temperature_height',loc='left',pad=15,fontsize=20)#标题
ax1.set_title('1952-01-01_500hPa',loc='right',pad=15,fontsize=20)
ax1.set_xlabel('Longtitude',fontsize=15)#x轴标签
ax1.set_ylabel('Latitude',fontsize=15)#y轴标签
ax1.coastlines(facecolor='None', edgecolor='0.1', linewidth=0.5)
ax=fig.add_axes([0.93,0.18,0.03,0.65]) # 0.25控制距离左边的距离,0.01控制距离下面的距离,最后两位控制color的长度和厚度
cb=fig.colorbar(cf,cax=ax,shrink=0.9,pad=0.04,aspect=15,orientation='vertical')
cb.ax.tick_params(labelsize=15)
plt.show()
#fig.savefig('c:/Users/24448/Desktop/haiqi.png',format='png')
结果如图: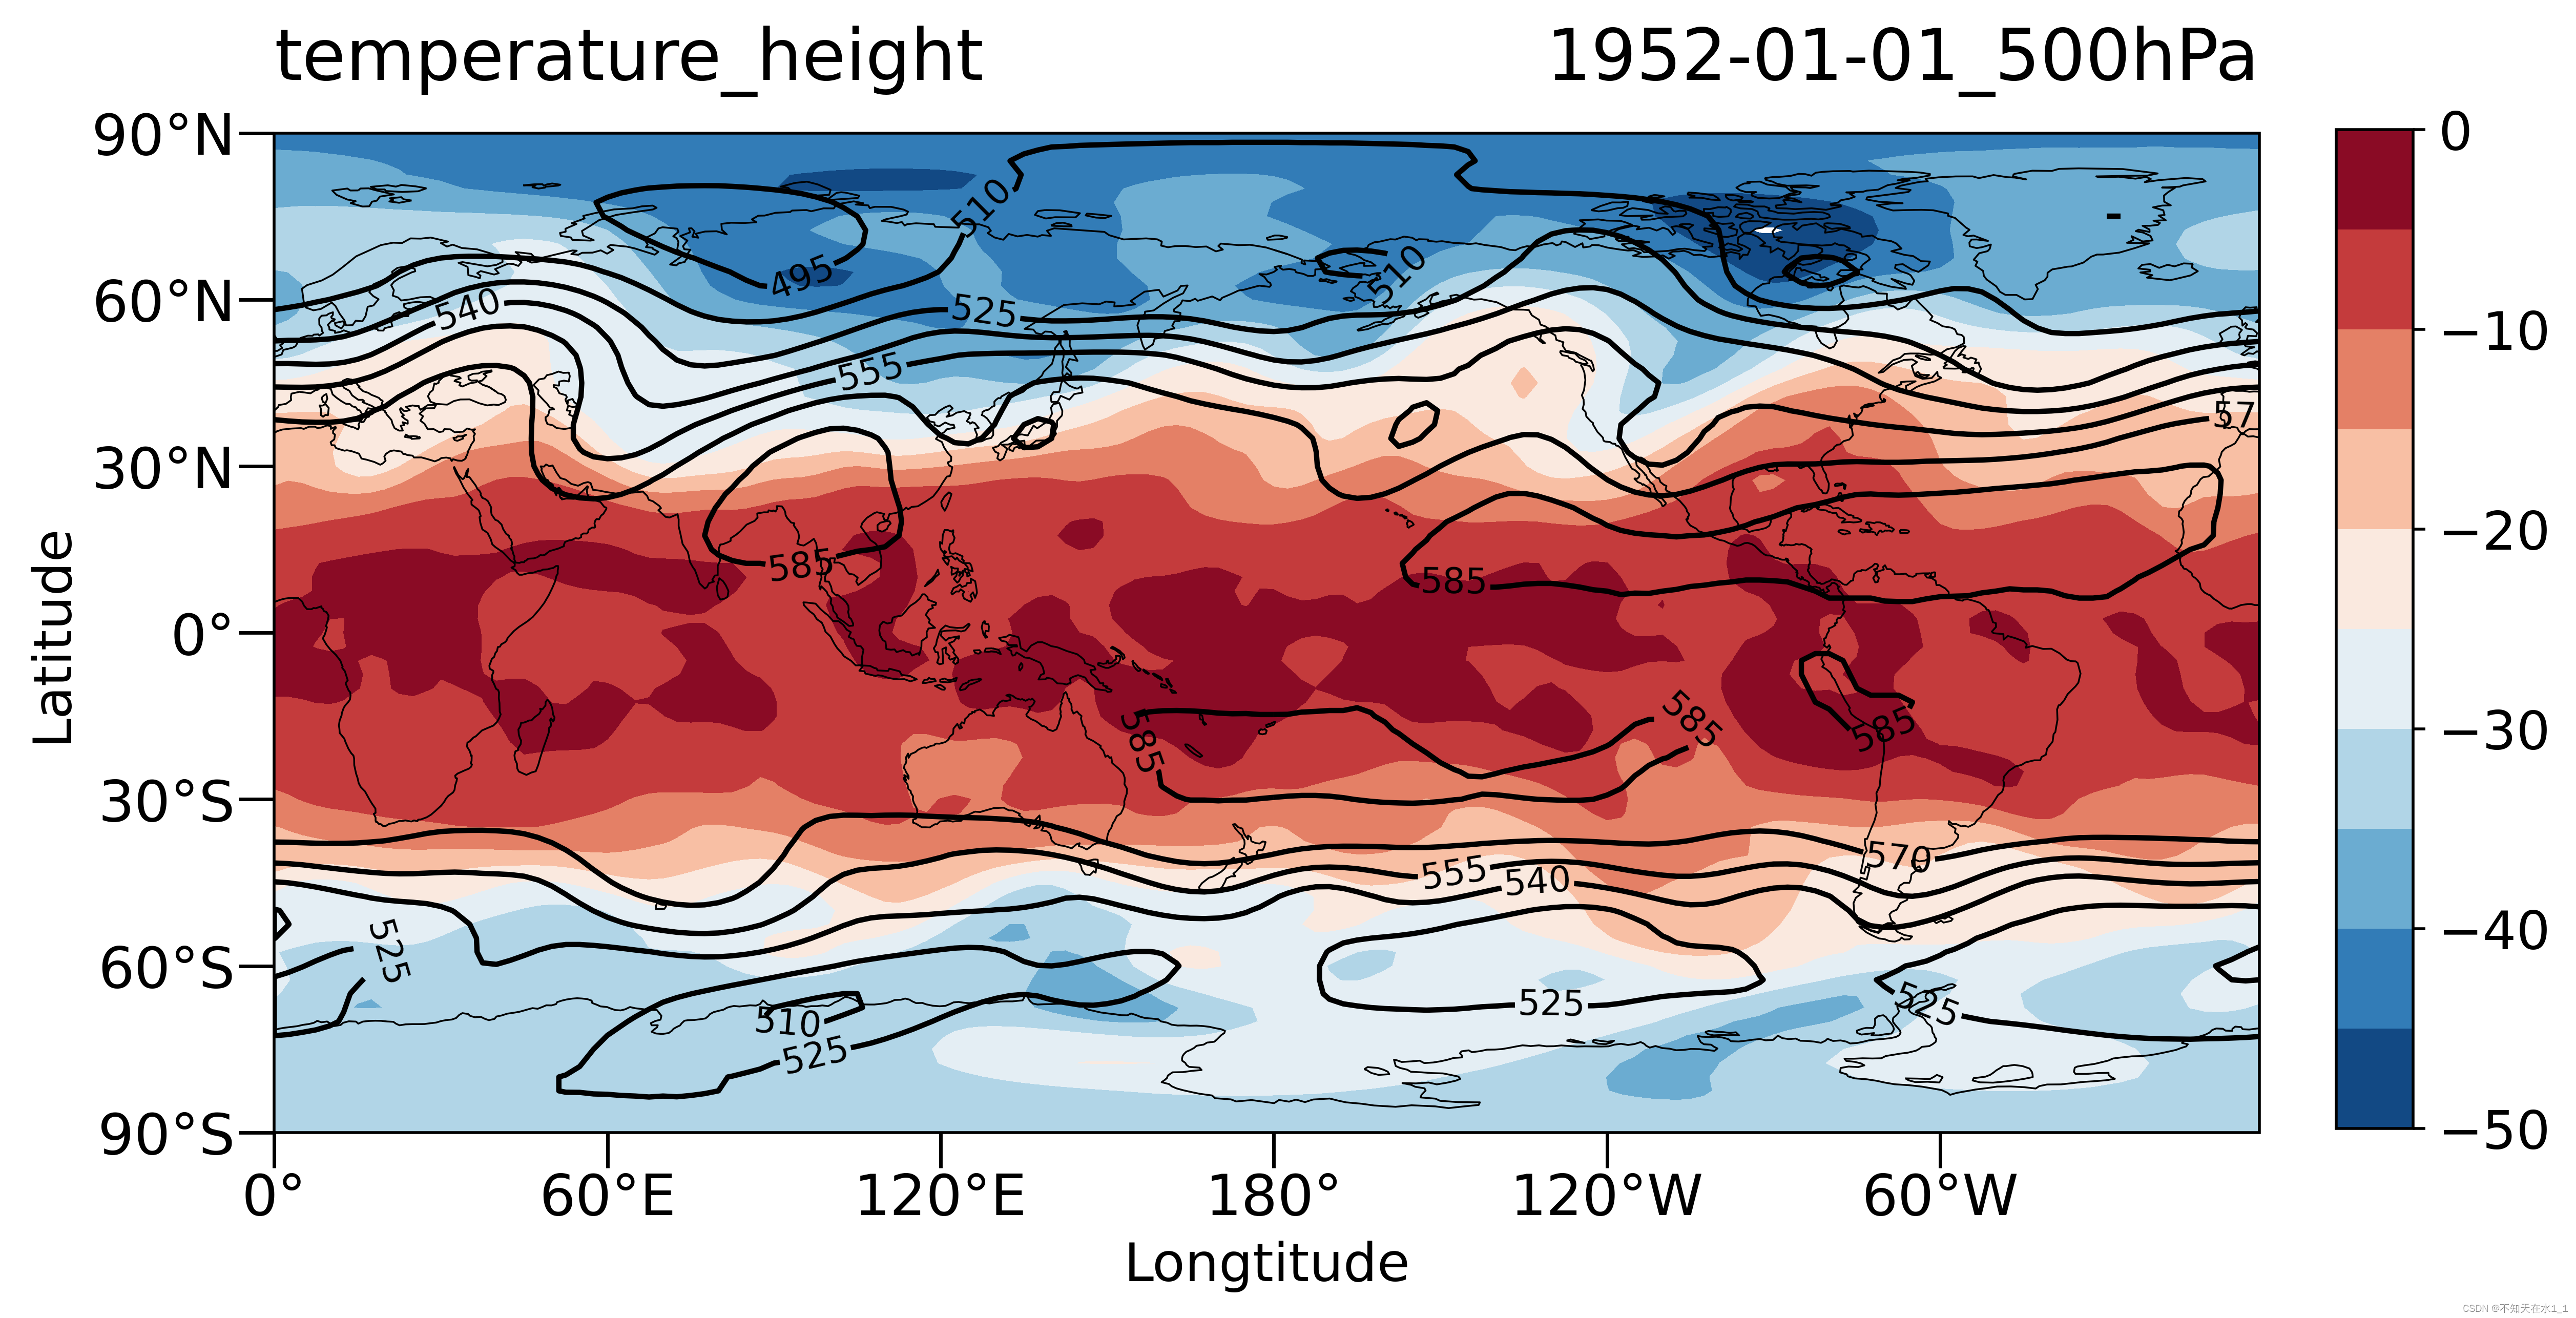
现在就一切正常了。
若文章有问题,还望不吝赐教!
ps:气象小白,python小白,刚刚读研。愿诸君前程似锦,你我共勉!


 1万+
1万+

 被折叠的 条评论
为什么被折叠?
被折叠的 条评论
为什么被折叠?
 到【灌水乐园】发言


