


最近学习黑马pink老师开始的Echart课程,发现跟着他学到导入echarts.min.js,导入之后再去添加配置项和数据,修改配置项和数据中的Xaxis的刻度的字体颜色时,就会导致柱形图不显示,一开始找不到解决办法,也可能是我使用了* pnpm install echarts安装的缘故,后面我发现在我添加color*属性时,.js文件中会生成一个导入的语句,如下 :
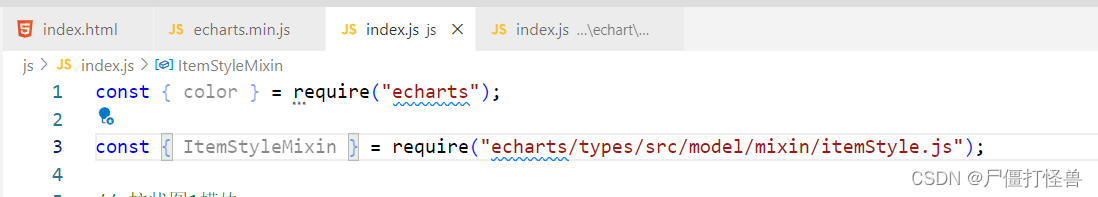
后面我发现,只要注释掉这个语句,就可以显示柱形图了,但是具体是啥问题还是不清楚。希望知道的小伙伴可以留言讨论一下。
实现的效果是这样的,简直 超酷 
index.html
<!DOCTYPE html>
<html lang="zh-CN">

<head>
  <meta charset="UTF-8">
  <meta name="viewport" content="width=device-width, initial-scale=1.0">
  <title>数据可视化</title>
  <link rel="stylesheet" href="css/index.css">
  <!-- <link rel="stylesheet" href="css/index.less"> -->
</head>

<body>
  <!-- 头部的盒子 -->
  <header>
    <h1>数据可视化-Echarts</h1>
    <div class="showTime">当前时间:</div>
    <!-- 格式: 当前时间:2020年3月17-0时54分14秒 -->
    <script>
      var t = null;
      t = setTimeout(time, 1000);//開始运行
      function time() {
        clearTimeout(t);//清除定时器
        dt = new Date();
        var y = dt.getFullYear();
        var mt = dt.getMonth() + 1;
        var day = dt.getDate();
        var h = dt.getHours();//获取时
        var m = dt.getMinutes();//获取分
        var s = dt.getSeconds();//获取秒
        document.querySelector(".showTime").innerHTML = '当前时间:' + y + "年" + mt + "月" + day + "-" + h + "时" + m + "分" + s + "秒";
        t = setTimeout(time, 1000); //设定定时器,循环运行
      }
    </script>
  </header>


  <!-- 页面主题部分 -->
  <section class="mainbox">
    <div class="column">
      <!-- 柱状图 -->
      <div class="panel bar">
        <h2>柱状图-就业行业 2019 2020</h2>
        <div class="chart"></div>
        <!-- 左下角 -->
        <div class="panel-footer"> </div>
      </div>

      <!-- 折线图 -->
      <div class="panel line">
        <h2>柱形图- 就业行业</h2>
        <div class="chart">图表2</div>
        <!-- 左下角 -->
        <div class="panel-footer"> </div>
      </div>

      <!-- 饼状图 -->
      <div class="panel pie">
        <h2>柱形图- 就业行业</h2>
        <div class="chart">图表3</div>
        <!-- 左下角 -->
        <div class="panel-footer"> </div>
      </div>

    </div>

    <!-- 中间盒子 -->
    <div class="column">
      <!-- 数字模块 -->
      <div class="no">
        <div class="no-hd">
          <ul>
            <li>12511</li>
            <li>10000</li>
          </ul>
        </div>
        <div class="no-bd">
          <ul>
            <li>前端需求人数</li>
            <li>市场供应人数</li>
          </ul>
        </div>
      </div>

      <!-- 地图模块 -->
      <div class="map">
        <!-- 地图中央的球体 -->
        <div class="map1"></div>
        <!-- 旋转动画 -->
        <div class="map2"></div>
        <!-- 逆时针旋转箭头 -->
        <div class="map3"></div>
        <!-- 图表 -->
        <div class="chart"></div>
      </div>
    </div>

    <!-- 右侧盒子 -->
    <div class="column">
      <!-- 柱状图 -->
      <div class="panel bar">
        <h2>柱形图- 就业行业</h2>
        <div class="chart">图表1</div>
        <!-- 左下角 -->
        <div class="panel-footer"> </div>
      </div>

      <!-- 折线图 -->
      <div class="panel line">
        <h2>柱形图- 就业行业</h2>
        <div class="chart">图表2</div>
        <!-- 左下角 -->
        <div class="panel-footer"> </div>
      </div>

      <!-- 饼状图 -->
      <div class="panel pie">
        <h2>柱形图- 就业行业</h2>
        <div class="chart">图表3</div>
        <!-- 左下角 -->
        <div class="panel-footer"> </div>
      </div>
    </div>
  </section>
  <script src="js/flexible.js"></script>
  <script src="js/echarts.min.js"></script>
  <script src="js/index.js"></script>
</body>

</html>
**index.css
* {
  margin: 0;
  padding: 0;
  box-sizing: border-box;
}
li {
  list-style: none;
}
@font-face {
  font-family: electronicFont;
  src: url(../font/DS-DIGIT.TTF);
}
body {
  background: url('../images/bg.jpg') no-repeat top center;
}
header {
  position: relative;
  height: 1.25rem;
  background: url('../images/head_bg.png') no-repeat;
  background-size: 100% 100%;
}
header h1 {
  color: white;
  font-size: 0.475rem;
  text-align: center;
  line-height: 1rem;
}
header .showTime {
  position: absolute;
  top: 0;
  right: 0.375rem;
  line-height: 0.9375rem;
  color: rgba(255, 255, 255, 0.7);
  font-size: 0.25rem;
}
.mainbox {
  display: flex;
  min-width: 1024px;
  max-width: 1920px;
  margin: 0 auto;
  padding: 0.125rem 0.125rem 0;
}
.mainbox .column {
  flex: 3;
}
.mainbox .column:nth-child(2) {
  flex: 5;
  margin: 0 0.125rem 0.1875rem;
}
.mainbox .panel {
  position: relative;
  height: 3.875rem;
  border: 1px solid rgba(25, 186, 139, 0.17);
  background: url('../images/line\(1\).png') rgba(255, 255, 255, 0.03);
  padding: 0 0.1875rem 0.5rem;
  margin-bottom: 0.1875rem;
}
.mainbox .panel::before {
  content: ' ';
  color: white;
  position: absolute;
  top: 0;
  left: 0;
  width: 10px;
  height: 10px;
  border-top: 2px solid #02a6b5;
  border-left: 2px solid #02a6b5;
}
.mainbox .panel::after {
  content: ' ';
  color: white;
  position: absolute;
  top: 0;
  right: 0;
  width: 10px;
  height: 10px;
  border-top: 2px solid #02a6b5;
  border-right: 2px solid #02a6b5;
}
.mainbox .panel .panel-footer {
  position: absolute;
  bottom: 0;
  left: 0;
  width: 100%;
}
.mainbox .panel .panel-footer::before {
  content: '';
  position: absolute;
  left: 0;
  bottom: 0;
  width: 10px;
  height: 10px;
  border-bottom: 2px solid #02a6b5;
  border-left: 2px solid #02a6b5;
}
.mainbox .panel .panel-footer::after {
  content: ' ';
  color: white;
  position: absolute;
  bottom: 0;
  right: 0;
  width: 10px;
  height: 10px;
  border-bottom: 2px solid #02a6b5;
  border-right: 2px solid #02a6b5;
}
.mainbox .panel h2 {
  height: 0.6rem;
  line-height: 0.6rem;
  color: white;
  font-size: 0.25rem;
  text-align: center;
  font-weight: 400;
}
.mainbox .panel .chart {
  height: 3rem;
  color: #fff;
}
.no {
  background-color: rgba(101, 132, 226, 0.1);
  padding: 0.1875rem;
}
.no .no-hd {
  position: relative;
  border: 1px solid rgba(25, 186, 139, 0.17);
}
.no .no-hd::before {
  content: '';
  position: absolute;
  top: 0;
  left: 0;
  width: 30px;
  height: 10px;
  border-top: 2px solid #02a6b5;
  border-left: 2px solid #02a6b5;
}
.no .no-hd::after {
  content: '';
  position: absolute;
  right: 0;
  bottom: 0;
  width: 30px;
  height: 10px;
  border-right: 2px solid #02a6b5;
  border-bottom: 2px solid #02a6b5;
}
.no .no-hd ul {
  display: flex;
}
.no .no-hd ul li {
  flex: 1;
  height: 1rem;
  font-size: 0.875rem;
  color: #ffeb7b;
  text-align: center;
  font-family: 'electronicFont';
  position: relative;
}
.no .no-hd ul li::after {
  position: absolute;
  content: '';
  top: 25%;
  right: 0;
  height: 50%;
  width: 1px;
  background-color: rgba(255, 255, 255, 0.2);
}
.no .no-bd ul {
  display: flex;
  flex-direction: flex;
}
.no .no-bd ul li {
  flex: 1;
  text-align: center;
  height: 0.5rem;
  line-height: 0.5rem;
  color: rgba(255, 255, 255, 0.7);
  font-size: 0.225rem;
  padding-top: 0.125rem;
}
.map {
  height: 10.125rem;
  position: relative;
}
.map .map1 {
  width: 6.475rem;
  height: 6.475rem;
  position: absolute;
  top: 50%;
  left: 50%;
  transform: translate(-50%, -50%);
  background: url('../images/map.png');
  background-size: 100% 100%;
  opacity: 0.3;
}
.map .map2 {
  position: absolute;
  top: 50%;
  left: 50%;
  width: 8.0375rem;
  height: 8.0375rem;
  transform: translate(-50%, -50%);
  background: url('../images/lbx.png');
  background-size: 100% 100%;
  opacity: 0.6;
  animation: rotate1 15s linear infinite;
}
.map .map3 {
  position: absolute;
  top: 50%;
  left: 50%;
  width: 7.075rem;
  height: 7.075rem;
  transform: translate(-50%, -50%);
  background: url('../images/jt.png');
  background-size: 100% 100%;
  opacity: 0.6;
  animation: rotate2 10s linear infinite;
}
.map .chart {
  position: absolute;
  top: 0;
  left: 0;
  width: 100%;
  height: 10.125rem;
}
@keyframes rotate1 {
  form {
    transform: translate(-50%, -50%) rotate(0deg);
  }
  to {
    transform: translate(-50%, -50%) rotate(360deg);
  }
}
@keyframes rotate2 {
  form {
    transform: translate(-50%, -50%) rotate(0deg);
  }
  to {
    transform: translate(-50%, -50%) rotate(-360deg);
  }
}
index.js
// const { color } = require("echarts");

// const { ItemStyleMixin } = require("echarts/types/src/model/mixin/itemStyle.js");

// 柱状图1模块
(function () {
  // 实例化对象
  let myChart = echarts.init(document.querySelector(".bar .chart"));
  // 指定配置和数据
  let option = {
    color: ["#3398DB"],
    tooltip: {
      trigger: "axis",
      axisPointer: {
        // 坐标轴指示器,坐标轴触发有效
        type: "shadow", // 默认为直线,可选为:'line' | 'shadow'
      },
    },
    grid: {
      left: "0%",
      right: "0%",
      bottom: "4%",
      top: "10px",
      containLabel: true,
    },
    xAxis: [
      {
        type: "category",
        // x轴中更换data数据
        data: [
          "旅游行业",
          "教育培训",
          "游戏行业",
          "医疗行业",
          "电商行业",
          "社交行业",
          "金融行业",
        ],
        axisTick: {
          alignWithLabel: true,
        },
        // 设置X轴刻度样式文字颜色和大小
        axisLabel: {
          textStyle: {
            color: "rgba(255,255,255,.6)",
            fontSize: "12",
          },
        },
        // 不显示X坐标轴的线的样式
        axisLine: {
          show: "false",
        },
      },
    ],
    yAxis: [
      {
        type: "value",
        // 设置y轴刻度样式文字颜色和大小
        axisLabel: {
          textStyle: {
            color: "rgba(255,255,255,.6)",
            fontSize: "12",
          },
        },
        // Y轴线条样式更改为1px rgba(255,255,255,0.1)的边框
        axisLine: {
          lineStyle: {
            color: "rgba(255,255,255,0.1)",
            width: 2,
            type: "solid",
          },
        },

        // Y轴分割线(横着的)
        splitLine: {
          lineStyle: {
            color: "rgba(255,255,255,0.1)",
            width: 1,
          },
        },
      },
    ],
    series: [
      {
        name: "直接访问",
        type: "bar",
        barWidth: "35%",
        // series 更换数据
        data: [200, 300, 300, 900, 1500, 1200, 600],
        itemStyle: {
          // 修改柱子圆角
          barBorderRadius: 3,
        },
      },
    ],
  };

  // 把配置给实例对象
  myChart.setOption(option);
})();
虽然还没写完,但是后续会继续努力的!


 2351
2351

 被折叠的 条评论
为什么被折叠?
被折叠的 条评论
为什么被折叠?
 到【灌水乐园】发言


