


目录
一.环境信息
1.服务器及k8s版本信息
| IP地址 | 主机名称 | 角色 | 版本 |
|---|---|---|---|
| 192.168.40.180 | master1 | master节点 | 1.27 |
| 192.168.40.181 | node1 | node节点 | 1.27 |
| 192.168.40.182 | node2 | node节点 | 1.27 |
2.部署组件版本
| 序号 | 名称 | 版本 | 作用 |
|---|---|---|---|
| 1 | Prometheus | v2.33.5 | 收集、存储和处理指标数据 |
| 2 | Node_exporter | v0.16.0 | 采集服务器指标,如CPU、内存、磁盘、网络等 |
| 3 | Kube-state-metrics | v1.9.0 | 采集K8S资源指标,如Pod、Node、Deployment、Service等 |
| 4 | Grafana | v8.4.5 | 可视化展示Prometheus收集数据 |
二.部署提前工作
1.创建名称空间,下面所有的资源到到这里
kubectl create ns prometheus
2.创建ServiceAccount账号,并绑定cluster-admin集群角色(Prometheus中需要指定)
kubectl create serviceaccount prometheus -n prometheus

kubectl create clusterrolebinding prometheus-clusterrolebinding -n prometheus --clusterrole=cluster-admin  --serviceaccount=prometheus:prometheus

kubectl create clusterrolebinding prometheus-clusterrolebinding-1 -n prometheus --clusterrole=cluster-admin --user=system:serviceaccount:prometheus:prometheus
3.创建Prometheus存放数据目录
注意:我们将prometheus服务部署在node1节点上,此步骤在node1上操作
mkdir /data
chmod -R 777 /data
4.创建Grafana存放数据目录
将Grafana服务部署在node1节点,所以此步骤也在node1节点执行
mkdir /var/lib/grafana/ -p
chmod 777 /var/lib/grafana/
三.部署Prometheus监控系统
1.创建ConfigMap资源
vim prometheus-cfg.yaml
---
kind: ConfigMap
apiVersion: v1
metadata:
  labels:
    app: prometheus
  name: prometheus-config
  namespace: prometheus
data:
  prometheus.yml: |
    global:
      scrape_interval: 15s           # 采集目标主机监控据的时间间隔
      scrape_timeout: 10s            # 数据采集超时时间,默认10s
      evaluation_interval: 1m        # 触发告警检测的时间,默认是1m
    scrape_configs:
    - job_name: 'kubernetes-node'
      kubernetes_sd_configs:          # 基于K8S的服务发现
      - role: node                    # 使用node模式服务发现
      relabel_configs:                # 正则匹配
      - source_labels: [__address__]  # 匹配带有IP的标签
        regex: '(.*):10250'           # 10250端口(kubelet端口)
        replacement: '${1}:9100'      # 替换成9100
        target_label: __address__
        action: replace
      - action: labelmap
        regex: __meta_kubernetes_node_label_(.+)
    - job_name: 'kubernetes-node-cadvisor' # cadvisor容器用于收集和提供有关节点上运行的容器的资源使用情况和性能指标
      kubernetes_sd_configs:
      - role:  node
      scheme: https
      tls_config:
        ca_file: /var/run/secrets/kubernetes.io/serviceaccount/ca.crt
      bearer_token_file: /var/run/secrets/kubernetes.io/serviceaccount/token
      relabel_configs:
      - action: labelmap   # 把匹配到的标签保留
        regex: __meta_kubernetes_node_label_(.+) # 保留匹配到的具有__meta_kubernetes_node_label的标签
      - target_label: __address__
        replacement: kubernetes.default.svc:443
      - source_labels: [__meta_kubernetes_node_name]
        regex: (.+)
        target_label: __metrics_path__
        replacement: /api/v1/nodes/${1}/proxy/metrics/cadvisor
    - job_name: 'kubernetes-apiserver'
      kubernetes_sd_configs:
      - role: endpoints
      scheme: https
      tls_config:
        ca_file: /var/run/secrets/kubernetes.io/serviceaccount/ca.crt
      bearer_token_file: /var/run/secrets/kubernetes.io/serviceaccount/token
      relabel_configs:
      - source_labels: [__meta_kubernetes_namespace, __meta_kubernetes_service_name, __meta_kubernetes_endpoint_port_name]
        action: keep
        regex: default;kubernetes;https
    - job_name: 'kubernetes-service-endpoints'
      kubernetes_sd_configs:
      - role: endpoints   # 使用k8s中的endpoint模式服务发现
      relabel_configs:
      - source_labels: [__meta_kubernetes_service_annotation_prometheus_io_scrape]
        action: keep      # 采集满足条件的实例,其他实例不采集
        regex: true
      - source_labels: [__meta_kubernetes_service_annotation_prometheus_io_scheme]
        action: replace
        target_label: __scheme__
        regex: (https?)
      - source_labels: [__meta_kubernetes_service_annotation_prometheus_io_path]
        action: replace
        target_label: __metrics_path__
        regex: (.+)
      - source_labels: [__address__, __meta_kubernetes_service_annotation_prometheus_io_port]
        action: replace
        target_label: __address__
        regex: ([^:]+)(?::\d+)?;(\d+)
        replacement: $1:$2
      - action: labelmap
        regex: __meta_kubernetes_service_label_(.+)
      - source_labels: [__meta_kubernetes_namespace]
        action: replace
        target_label: kubernetes_namespace
      - source_labels: [__meta_kubernetes_service_name]
        action: replace
        target_label: kubernetes_name
执行配置清单:
kubectl apply -f prometheus-cfg.yaml
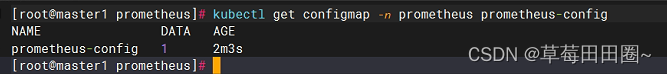
查看ConfigMap资源信息
kubectl get configmap -n prometheus prometheus-config
2.创建Deployment资源
vim prometheus-deploy.yaml
---
apiVersion: apps/v1
kind: Deployment
metadata:
  name: prometheus-server
  namespace: prometheus
  labels:
    app: prometheus
spec:
  replicas: 1
  selector:
    matchLabels:
      app: prometheus
      component: server
  template:
    metadata:
      labels:
        app: prometheus
        component: server
      annotations:
        prometheus.io/scrape: 'false'
    spec:
      nodeName: node1                # 调度到node1节点
      serviceAccountName: prometheus  # 指定sa服务账号
      containers:
      - name: prometheus
        image: prom/prometheus:v2.33.5
        imagePullPolicy: IfNotPresent
        command:                       # 启动时运行的命令
          - prometheus
          - --config.file=/etc/prometheus/prometheus.yml  # 指定配置文件
          - --storage.tsdb.path=/prometheus               # 数据存放目录
          - --storage.tsdb.retention=720h                 # 暴露720小时(30天)
          - --web.enable-lifecycle                        # 开启热加载
        ports:
        - containerPort: 9090
          protocol: TCP
        volumeMounts:
        - mountPath: /etc/prometheus       # 将prometheus-config卷挂载至/etc/prometheus
          name: prometheus-config
        - mountPath: /prometheus/
          name: prometheus-storage-volume
      volumes:
        - name: prometheus-config          # 将prometheus-config做成卷
          configMap:
            name: prometheus-config
        - name: prometheus-storage-volume
          hostPath:
           path: /data
           type: Directory
执行配置清单:
kubectl apply -f prometheus-deploy.yaml
查看Deployment资源信息:
kubectl get deployment prometheus-server -n prometheus

3.创建Service资源
vim prometheus-svc.yaml
---
apiVersion: v1
kind: Service
metadata:
  name: prometheus-svc
  namespace: prometheus
  labels:
    app: prometheus
spec:
  type: NodePort
  ports:
    - port: 9090
      targetPort: 9090
      nodePort: 31090
      protocol: TCP
  selector:
    app: prometheus
    component: server
执行配置清单:
kubectl apply -f prometheus-svc.yaml
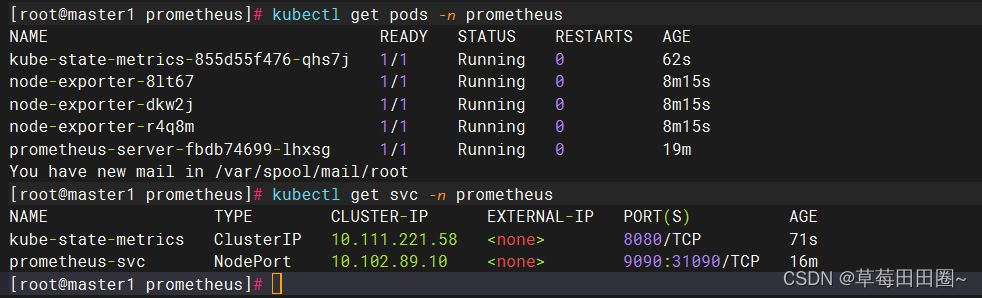
查看Service资源信息:
kubectl get svc prometheus-svc -n prometheus

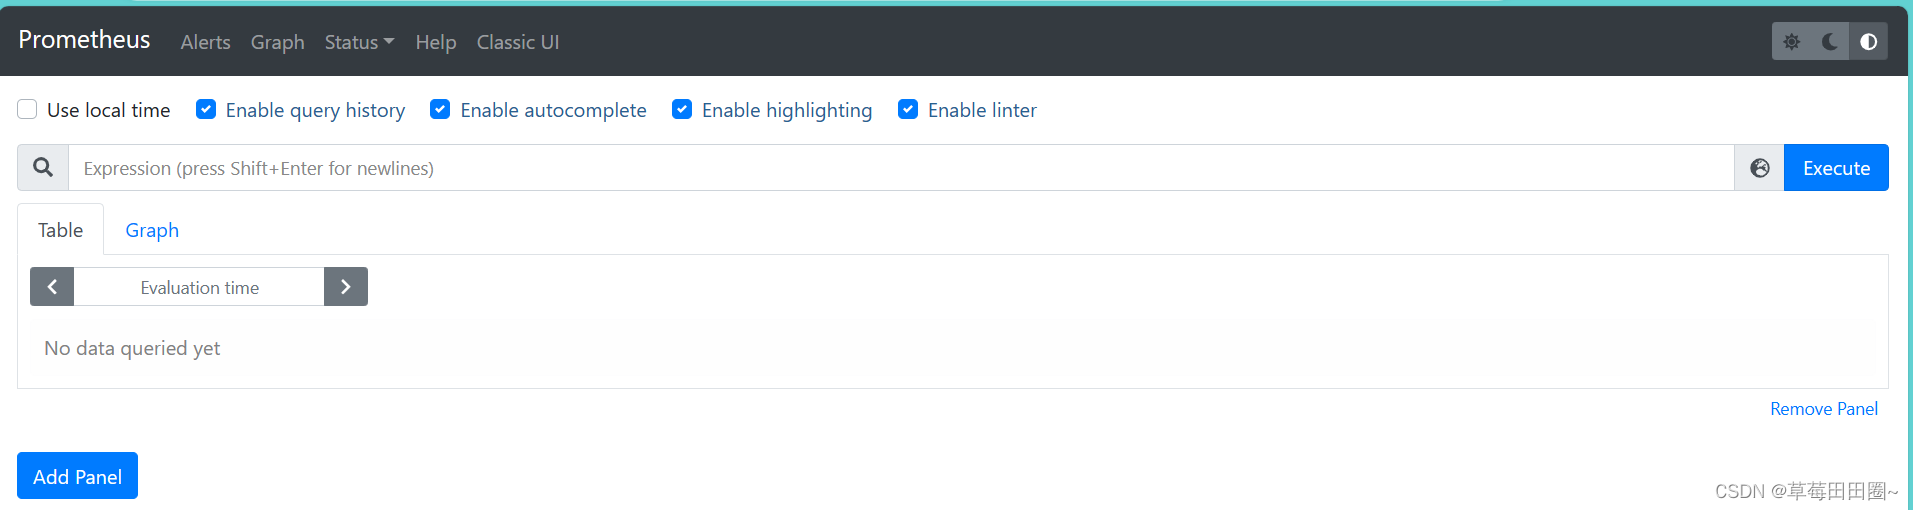
4.访问浏览器:http://IP:31090
四.部署Node_exporter组件
使用daemonsets资源
vim node-export.yaml
---
apiVersion: apps/v1
kind: DaemonSet
metadata:
  name: node-exporter
  namespace: prometheus
  labels:
    name: node-exporter
spec:
  selector:
    matchLabels:
     name: node-exporter
  template:
    metadata:
      labels:
        name: node-exporter
    spec:
      hostPID: true
      hostIPC: true
      # 使用物理机IP地址(调度到那个节点,就使用该节点IP地址)
      hostNetwork: true
      containers:
      - name: node-exporter
        image: prom/node-exporter:v0.16.0
        imagePullPolicy: IfNotPresent
        ports:
        # 暴露端口
        - containerPort: 9100
        resources:
          requests:
            cpu: 0.15
        securityContext:
          privileged: true
        args:
        - --path.procfs
        - /host/proc
        - --path.sysfs
        - /host/sys
        - --collector.filesystem.ignored-mount-points
        - '"^/(sys|proc|dev|host|etc)($|/)"'
        volumeMounts:
        - name: dev
          mountPath: /host/dev
        - name: proc
          mountPath: /host/proc
        - name: sys
          mountPath: /host/sys
        - name: rootfs
          mountPath: /rootfs
        - name: localtime
          mountPath: /etc/localtime
      # 指定容忍度,允许调度到master节点
      tolerations:
      - key: "node-role.kubernetes.io/control-plane"
        operator: "Exists"
        effect: "NoSchedule"
      volumes:
        - name: proc
          hostPath:
            path: /proc
        - name: dev
          hostPath:
            path: /dev
        - name: sys
          hostPath:
            path: /sys
        - name: rootfs
          hostPath:
            path: /
        - name: localtime
          hostPath:
            path: /etc/localtime
            type: File
注意:需要根据环境修改容忍度tolerations 允许调度到Master节点,其他不用修改!!
可以使用以下命令查看master1节点中的污点是什么,然后配置到上面的tolerations

执行资源清单:
kubectl apply -f node-export.yaml
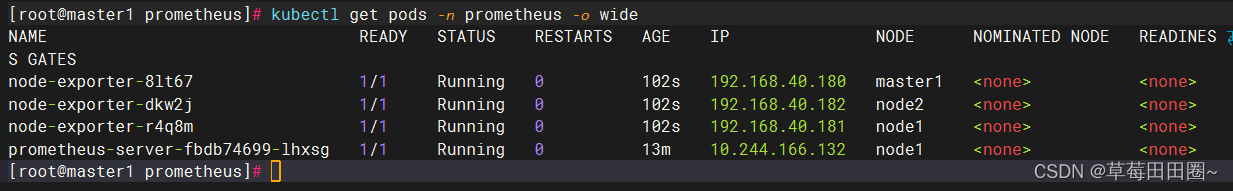
查看资源信息,正常三个节点都要部署node_exporter,如果没有master节点,就要检查上面容忍度配置了。
kubectl get pods -n prometheus -o wide
五.部署Kube_state_metrics组件
kube-state-metrics是什么?
kube-state-metrics通过监听API Server生成有关资源对象的状态指标,比如Node、Pod,需要注意的是kube-state-metrics只是简单的提供一个metrics数据,并不会存储这些指标数据,所以我们可以使用Prometheus来抓取这些数据然后存储,主要关注的是业务相关的一些元数据,比如Pod副本状态等;调度了多少个replicas?现在可用的有几个?多少个Pod是running/stopped/terminated状态?Pod重启了多少次?我有多少job在运行中
vim kube-state-metrics.yaml
---
apiVersion: v1
kind: ServiceAccount
metadata:
  name: kube-state-metrics
  namespace: prometheus
---
apiVersion: rbac.authorization.k8s.io/v1
kind: ClusterRole
metadata:
  name: kube-state-metrics
rules:
- apiGroups: [""]
  resources: ["nodes", "pods", "services", "resourcequotas", "replicationcontrollers", "limitranges", "persistentvolumeclaims", "persistentvolumes", "namespaces", "endpoints"]
  verbs: ["list", "watch"]
- apiGroups: ["extensions"]
  resources: ["daemonsets", "deployments", "replicasets"]
  verbs: ["list", "watch"]
- apiGroups: ["apps"]
  resources: ["statefulsets"]
  verbs: ["list", "watch"]
- apiGroups: ["batch"]
  resources: ["cronjobs", "jobs"]
  verbs: ["list", "watch"]
- apiGroups: ["autoscaling"]
  resources: ["horizontalpodautoscalers"]
  verbs: ["list", "watch"]
---
apiVersion: rbac.authorization.k8s.io/v1
kind: ClusterRoleBinding
metadata:
  name: kube-state-metrics
roleRef:
  apiGroup: rbac.authorization.k8s.io
  kind: ClusterRole
  name: kube-state-metrics
subjects:
- kind: ServiceAccount
  name: kube-state-metrics
  namespace: prometheus
---
apiVersion: apps/v1
kind: Deployment
metadata:
  name: kube-state-metrics
  namespace: prometheus
spec:
  replicas: 1
  selector:
    matchLabels:
      app: kube-state-metrics
  template:
    metadata:
      labels:
        app: kube-state-metrics
    spec:
      serviceAccountName: kube-state-metrics
      containers:
      - name: kube-state-metrics
        image: quay.io/coreos/kube-state-metrics:v1.9.0
        imagePullPolicy: IfNotPresent
        ports:
        - containerPort: 8080
---
apiVersion: v1
kind: Service
metadata:
  annotations:
    prometheus.io/scrape: 'true'
  name: kube-state-metrics
  namespace: prometheus
  labels:
    app: kube-state-metrics
spec:
  ports:
  - name: kube-state-metrics
    port: 8080
    protocol: TCP
  selector:
    app: kube-state-metrics
执行资源清单:
kubectl apply -f kube-state-metrics.yaml
查看资源信息:
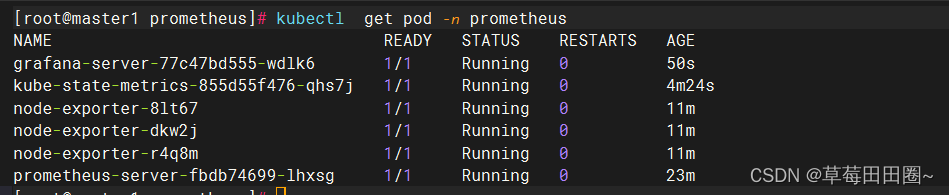
kubectl get pods -n prometheus
六.部署Grafana可视化平台
注意:修改nodeName指定部署到node1节点,其他不用修改!!
vim grafana.yaml
---
apiVersion: apps/v1
kind: Deployment
metadata:
  name: grafana-server
  namespace: prometheus
spec:
  replicas: 1
  selector:
    matchLabels:
      task: monitoring
      k8s-app: grafana
  template:
    metadata:
      labels:
        task: monitoring
        k8s-app: grafana
    spec:
      nodeName: node1 # 部署到node1节点
      containers:
      - name: grafana
        image: grafana/grafana:8.4.5
        imagePullPolicy: IfNotPresent
        ports:
        - containerPort: 3000
          protocol: TCP
        volumeMounts:
        - mountPath: /etc/ssl/certs
          name: ca-certificates
          readOnly: true
        - mountPath: /var
          name: grafana-storage
        - mountPath: /var/lib/grafana/
          name: lib
        env:
        - name: INFLUXDB_HOST
          value: monitoring-influxdb
        - name: GF_SERVER_HTTP_PORT
          value: "3000"
        - name: GF_AUTH_BASIC_ENABLED
          value: "false"
        - name: GF_AUTH_ANONYMOUS_ENABLED
          value: "true"
        - name: GF_AUTH_ANONYMOUS_ORG_ROLE
          value: Admin
        - name: GF_SERVER_ROOT_URL
          value: /
      volumes:
      - name: ca-certificates
        hostPath:
          path: /etc/ssl/certs
      - name: grafana-storage
        emptyDir: {}
      - name: lib
        hostPath:
         path: /var/lib/grafana/
         type: DirectoryOrCreate
---
apiVersion: v1
kind: Service
metadata:
  labels:
    kubernetes.io/cluster-service: 'true'
    kubernetes.io/name: monitoring-grafana
  name: grafana-svc
  namespace: prometheus
spec:
  ports:
  - port: 80
    targetPort: 3000
    nodePort: 31091
  selector:
    k8s-app: grafana
  type: NodePort
执行资源清单:
kubectl apply -f grafana.yaml
查看资源信息:
kubectl get pods -n prometheus
浏览器访问:http://IP:31091
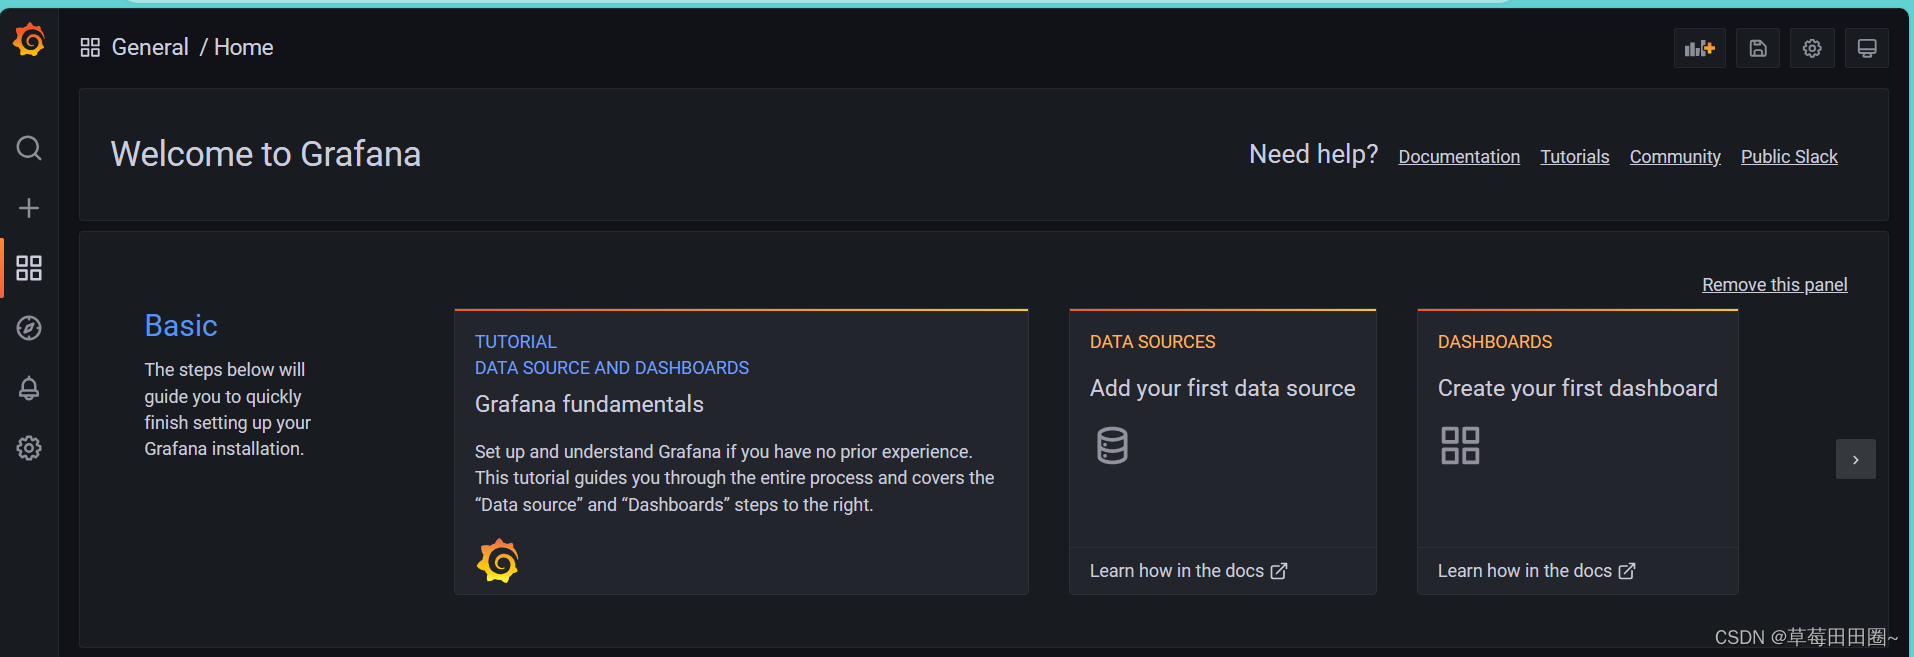
OK,浏览器可以访问到Grafana,表示至此步骤,无误!
七.Grafana接入Prometheus数据
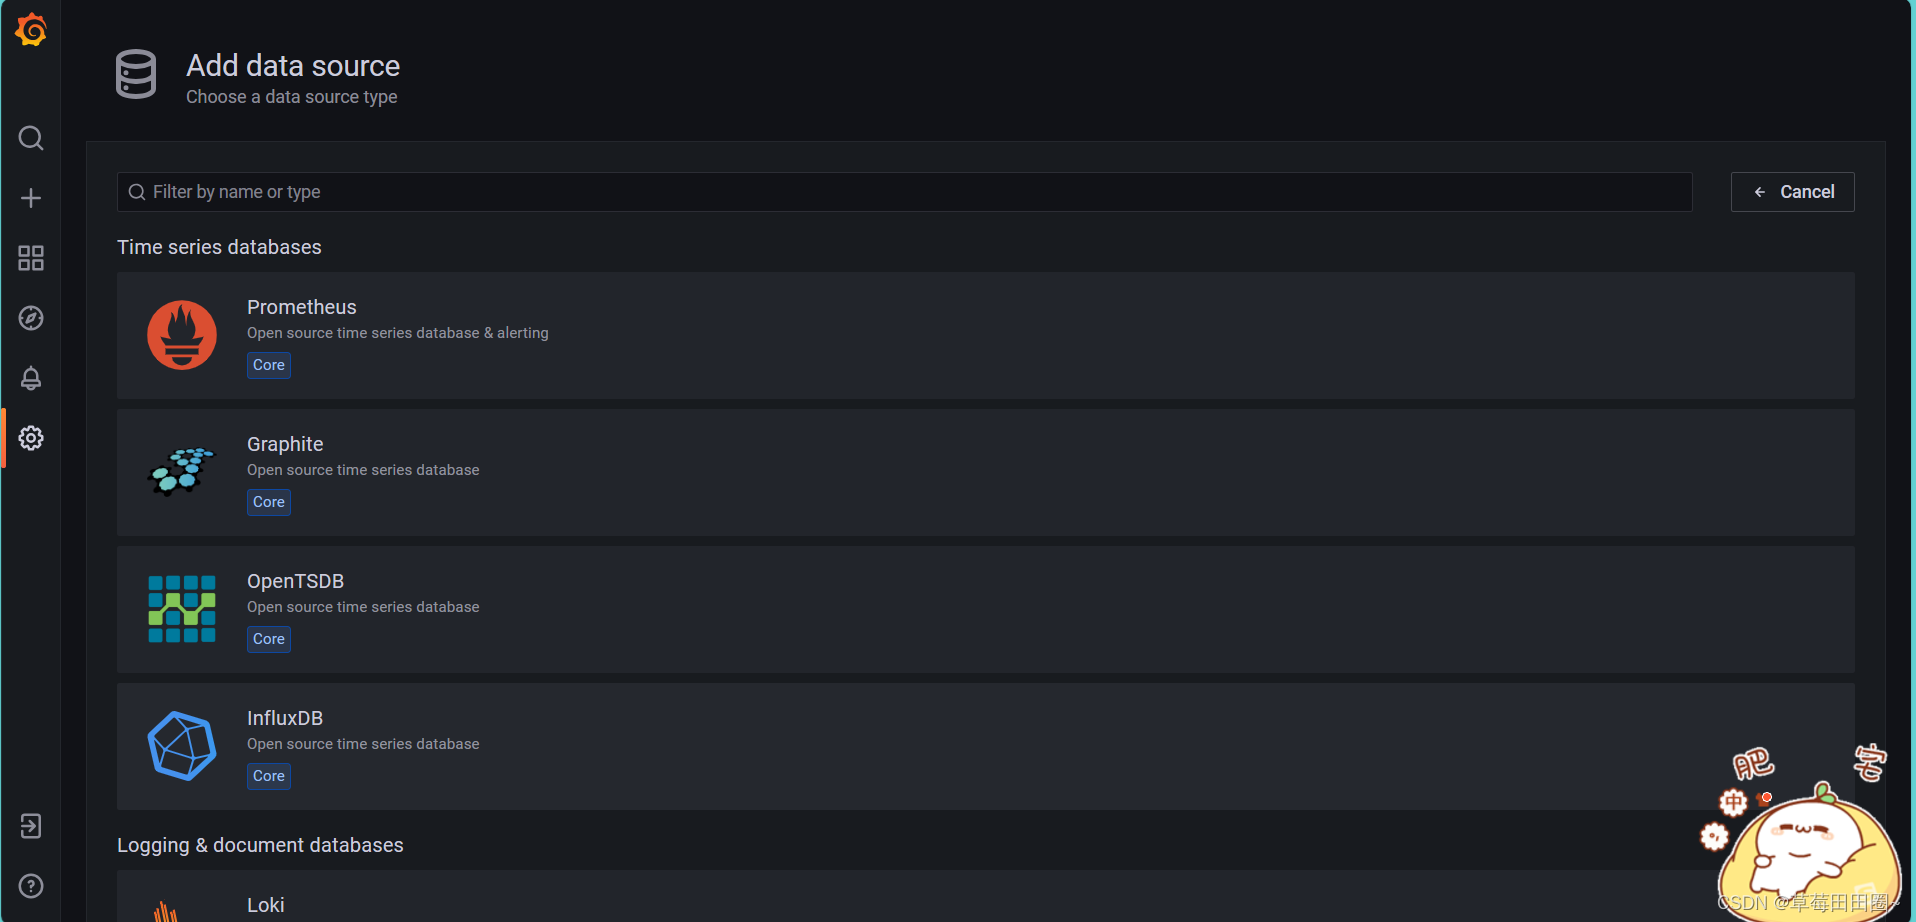
1.点击 设置 > Data Sources > Add data source > 选择Prometheus
2.填写Name、URL 字段
URL 使用SVC的域名,格式是:SVC名称.名称空间.svc
http://prometheus-svc.prometheus.svc:9090
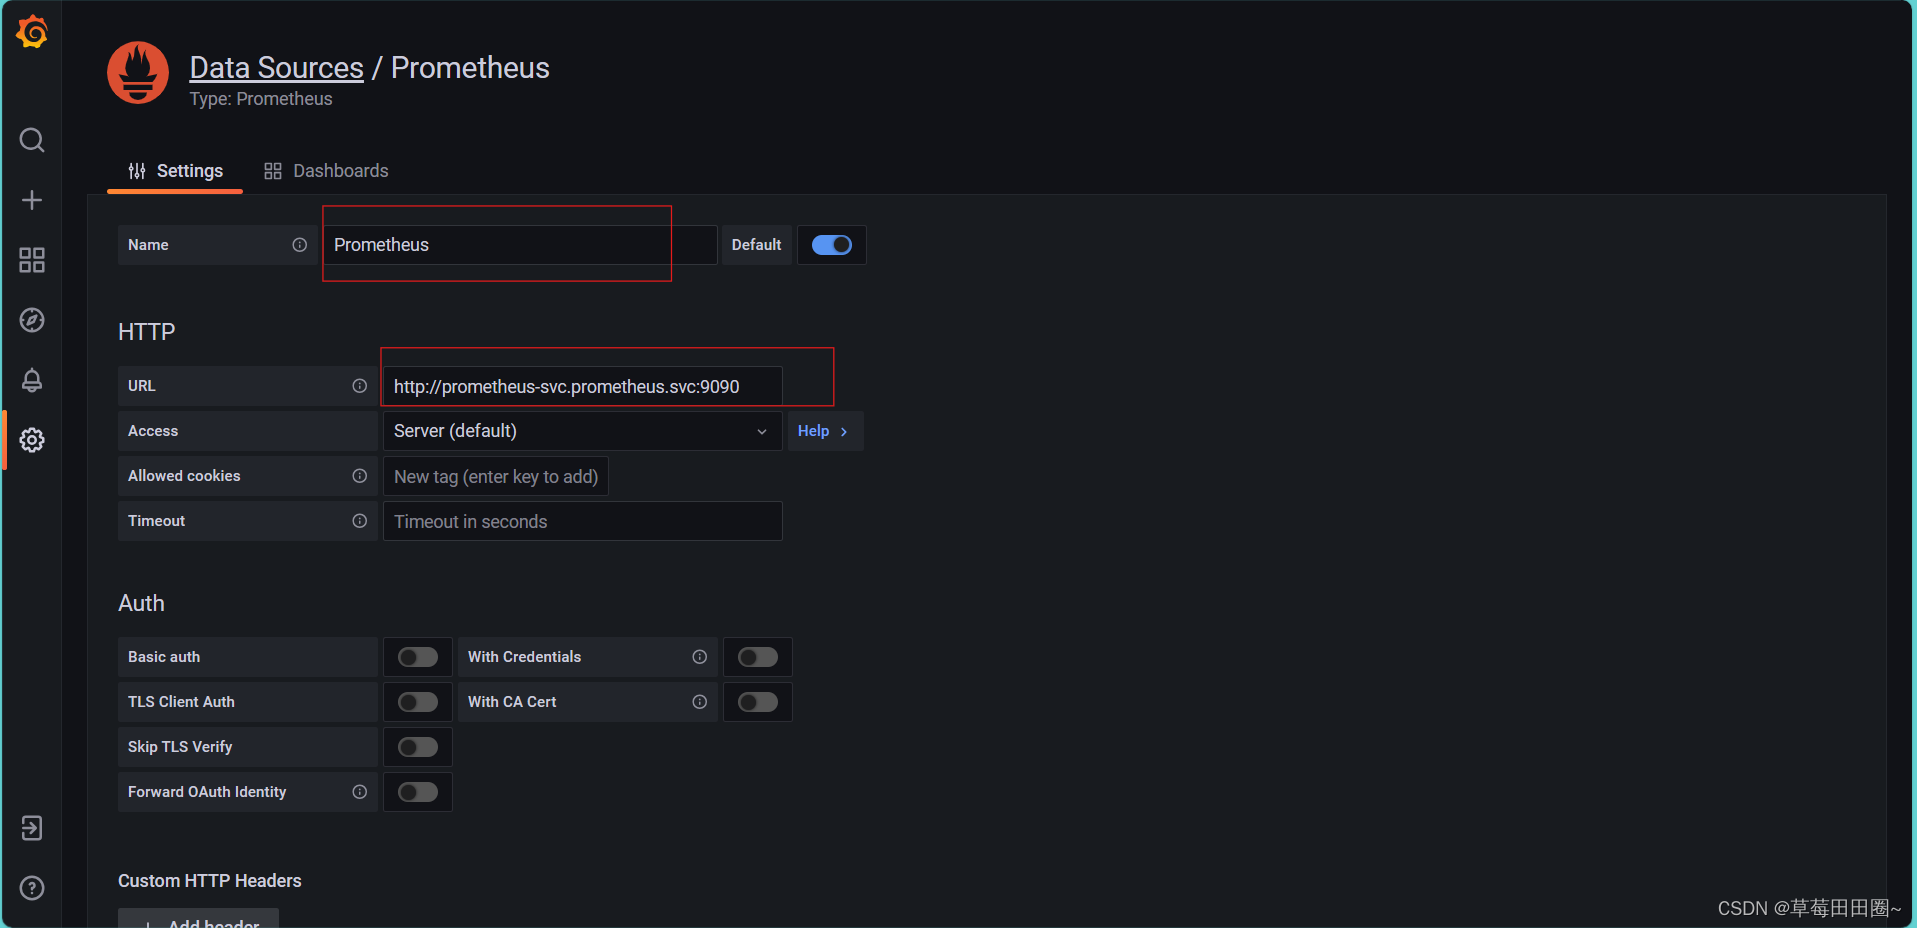
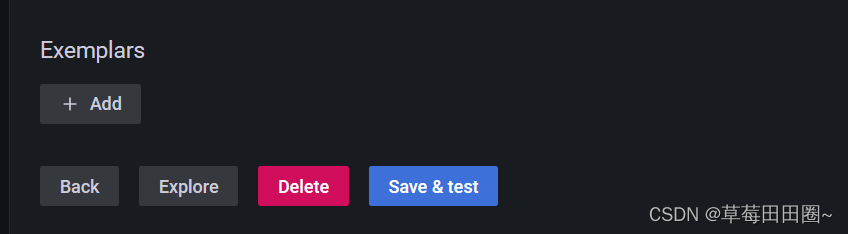
3.往下滑,点击 Save & test
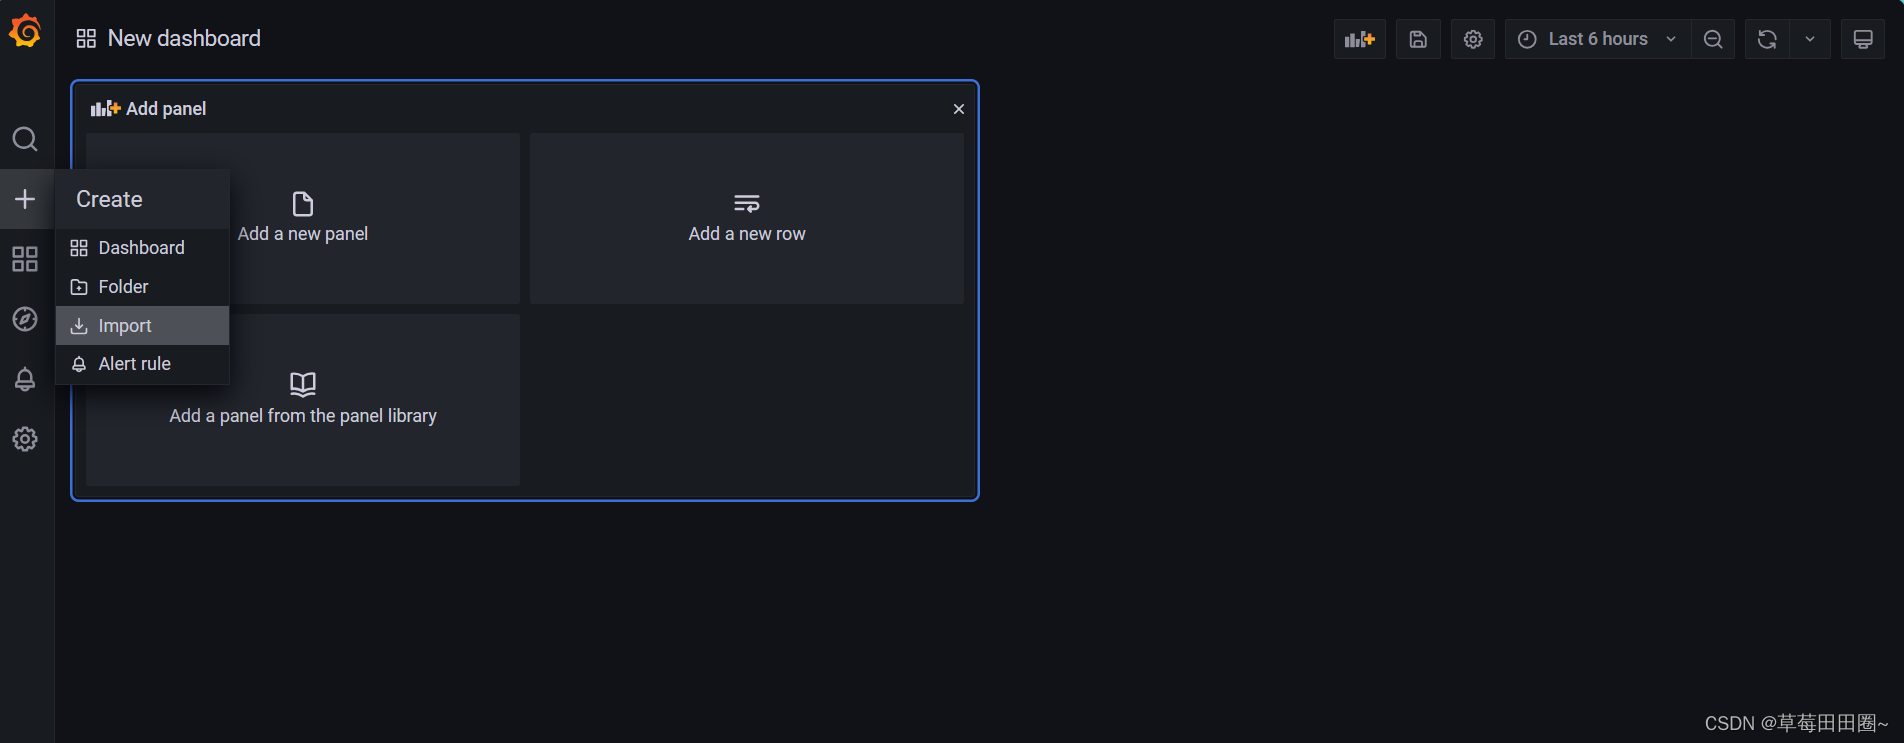
八.Grafana添加监控模板
| 序号 | 模板文件 | 备注 |
|---|---|---|
| 1 | node_exporter.json | 服务器监控模板-2 |
| 2 | docker_rev1.json | Docker监控模板 |
| 3 | Kubernetes-1577674936972.json | K8S集群监控模板 |
| 4 | Kubernetes-1577691996738.json | K8S集群监控模板 |
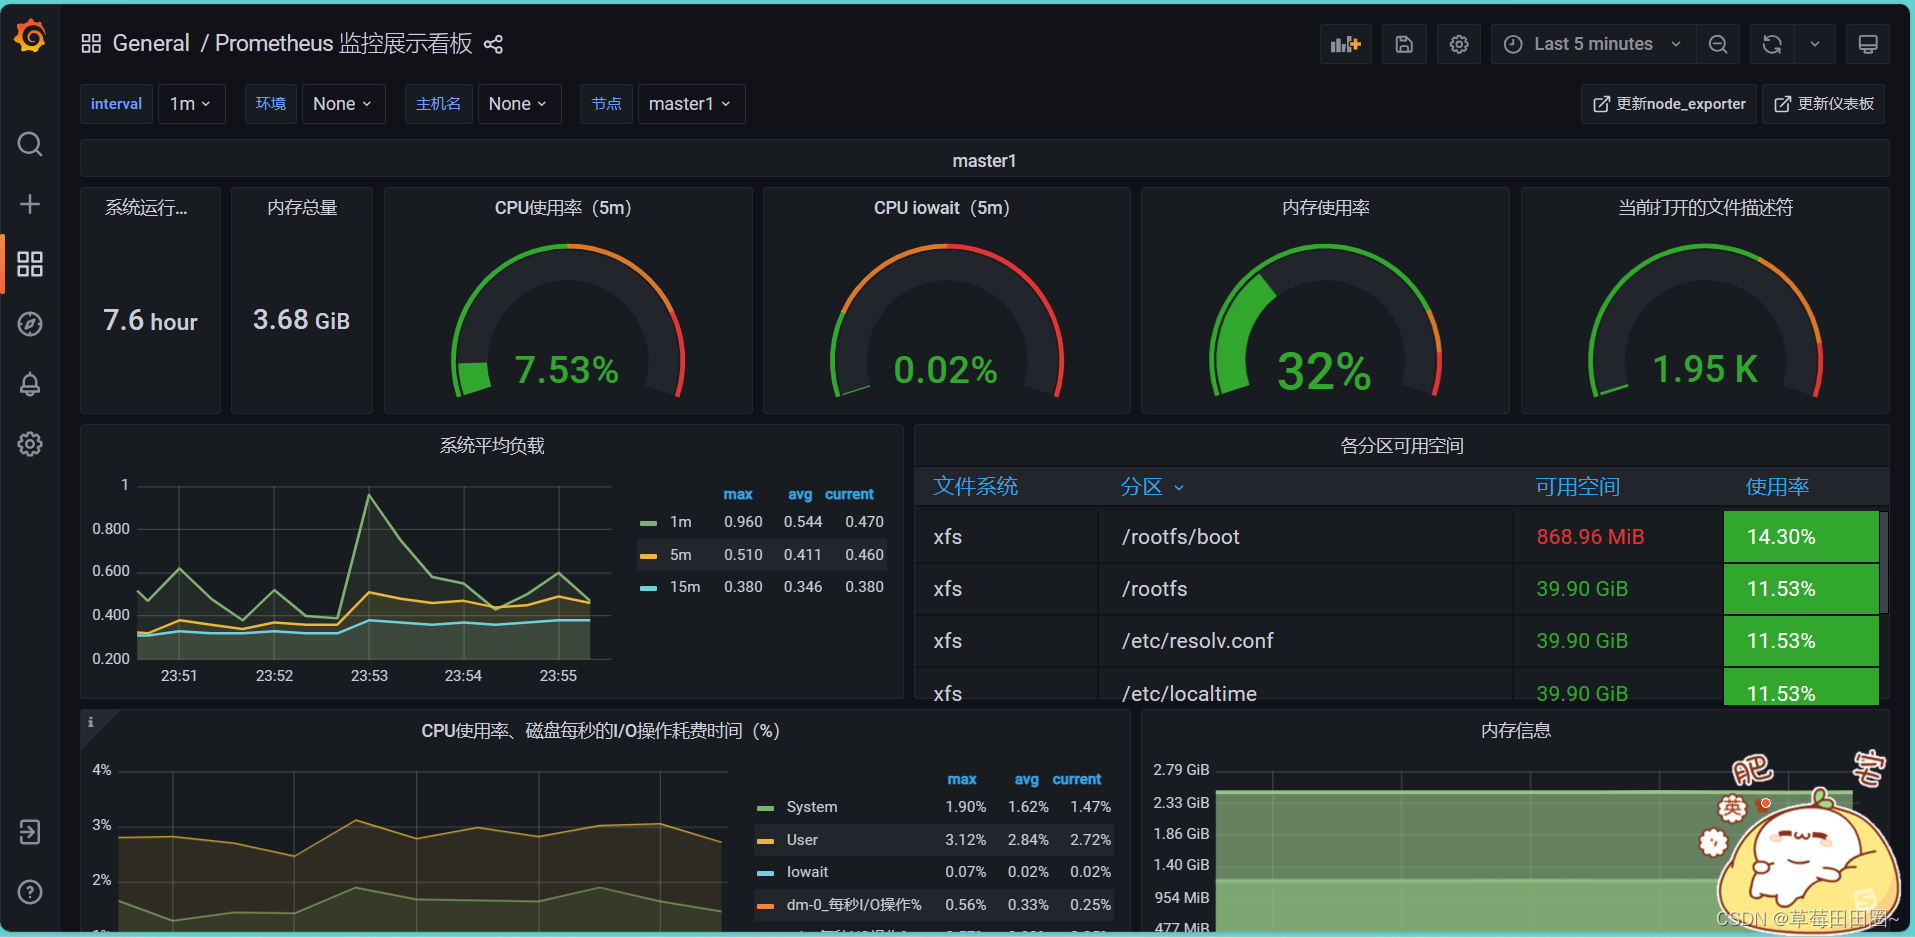
1.导入node_exporter.json 服务器监控-2模板:
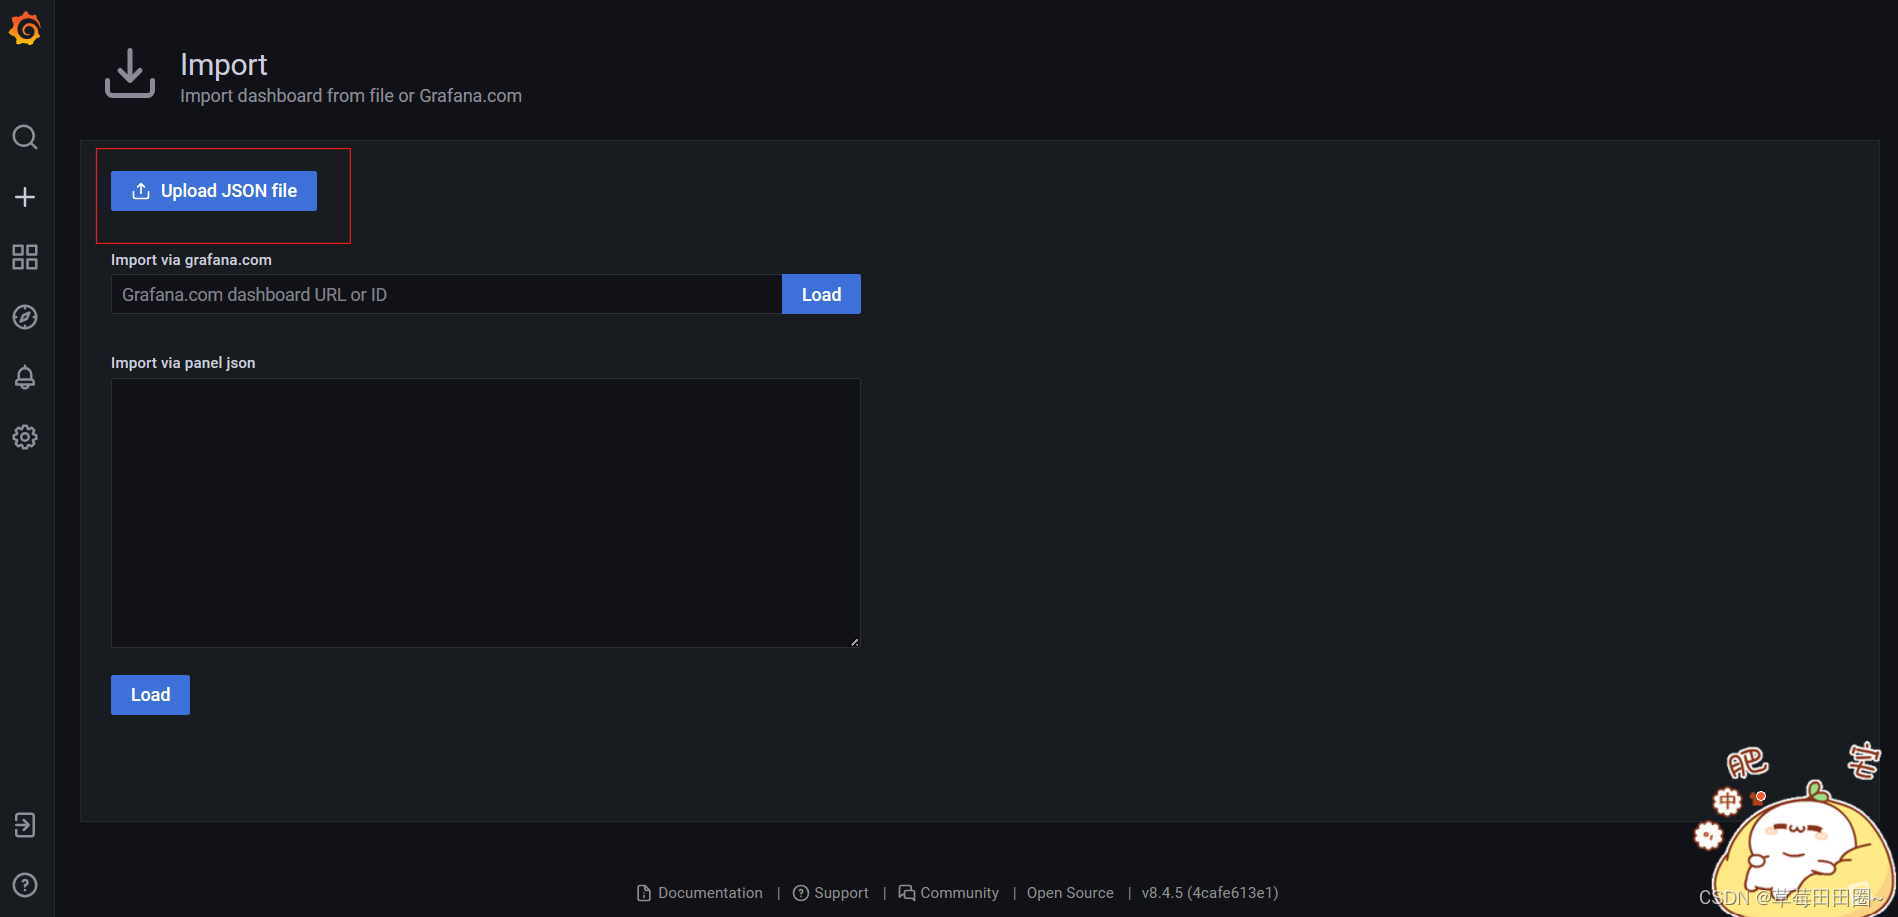
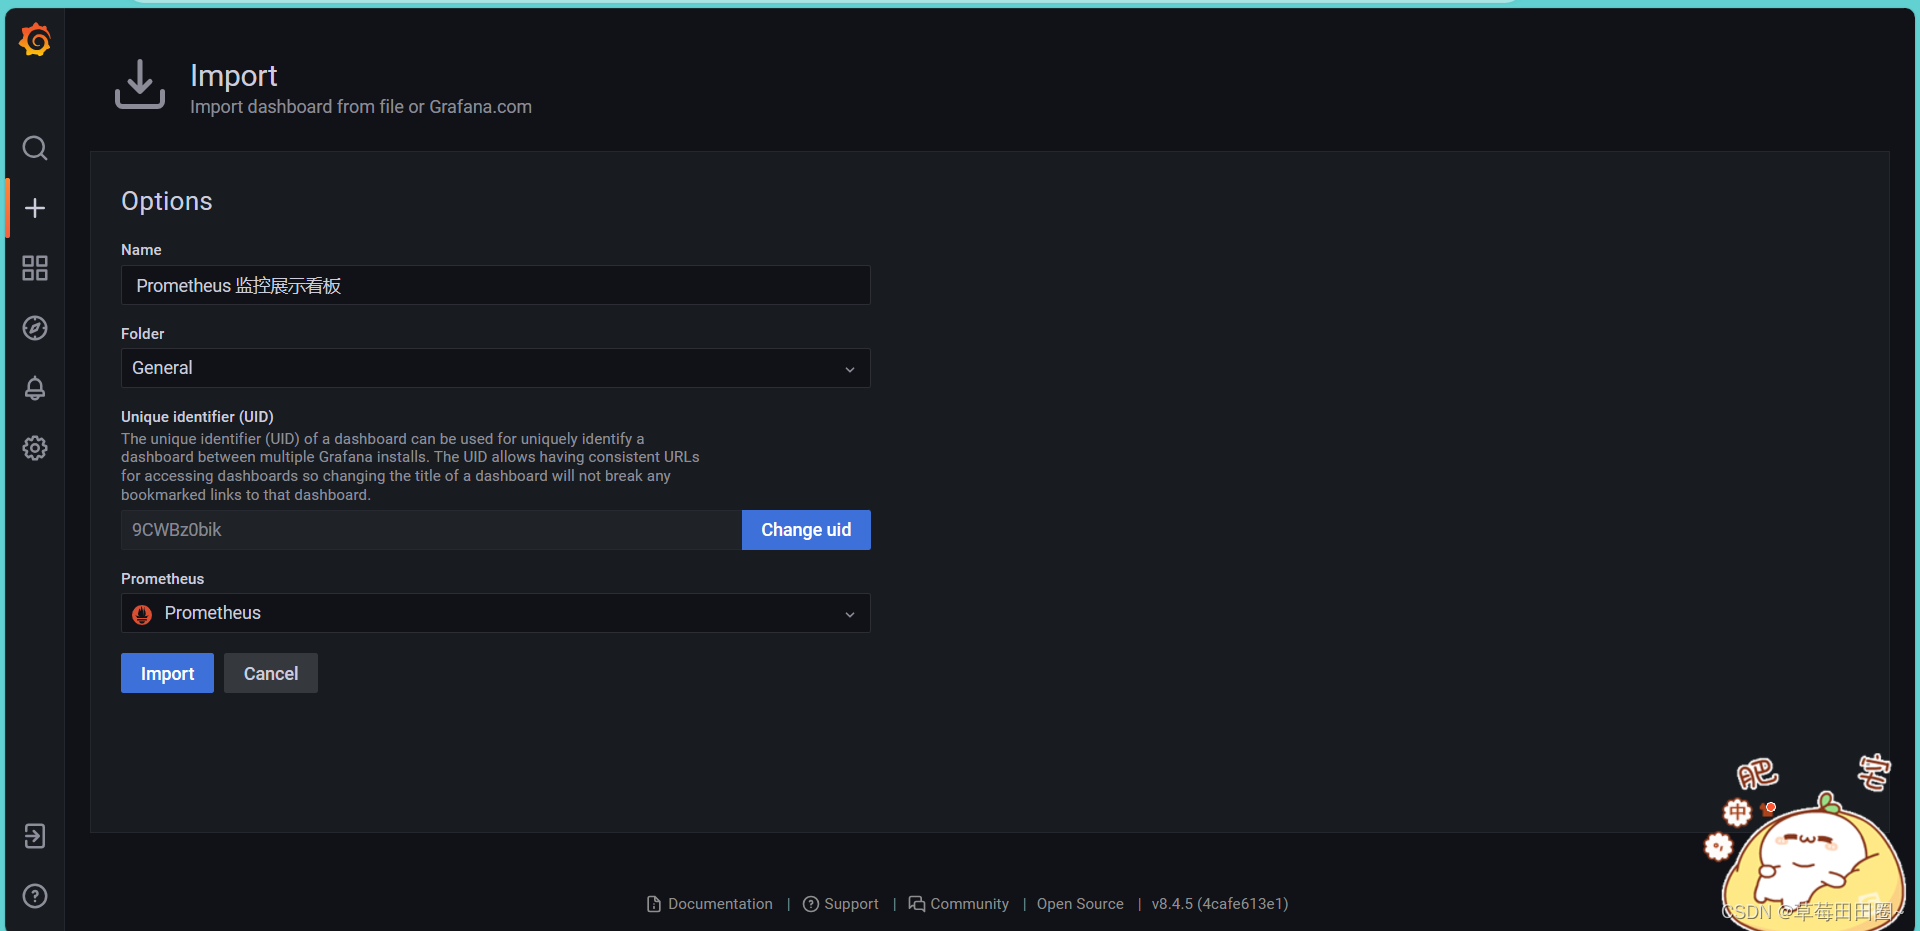
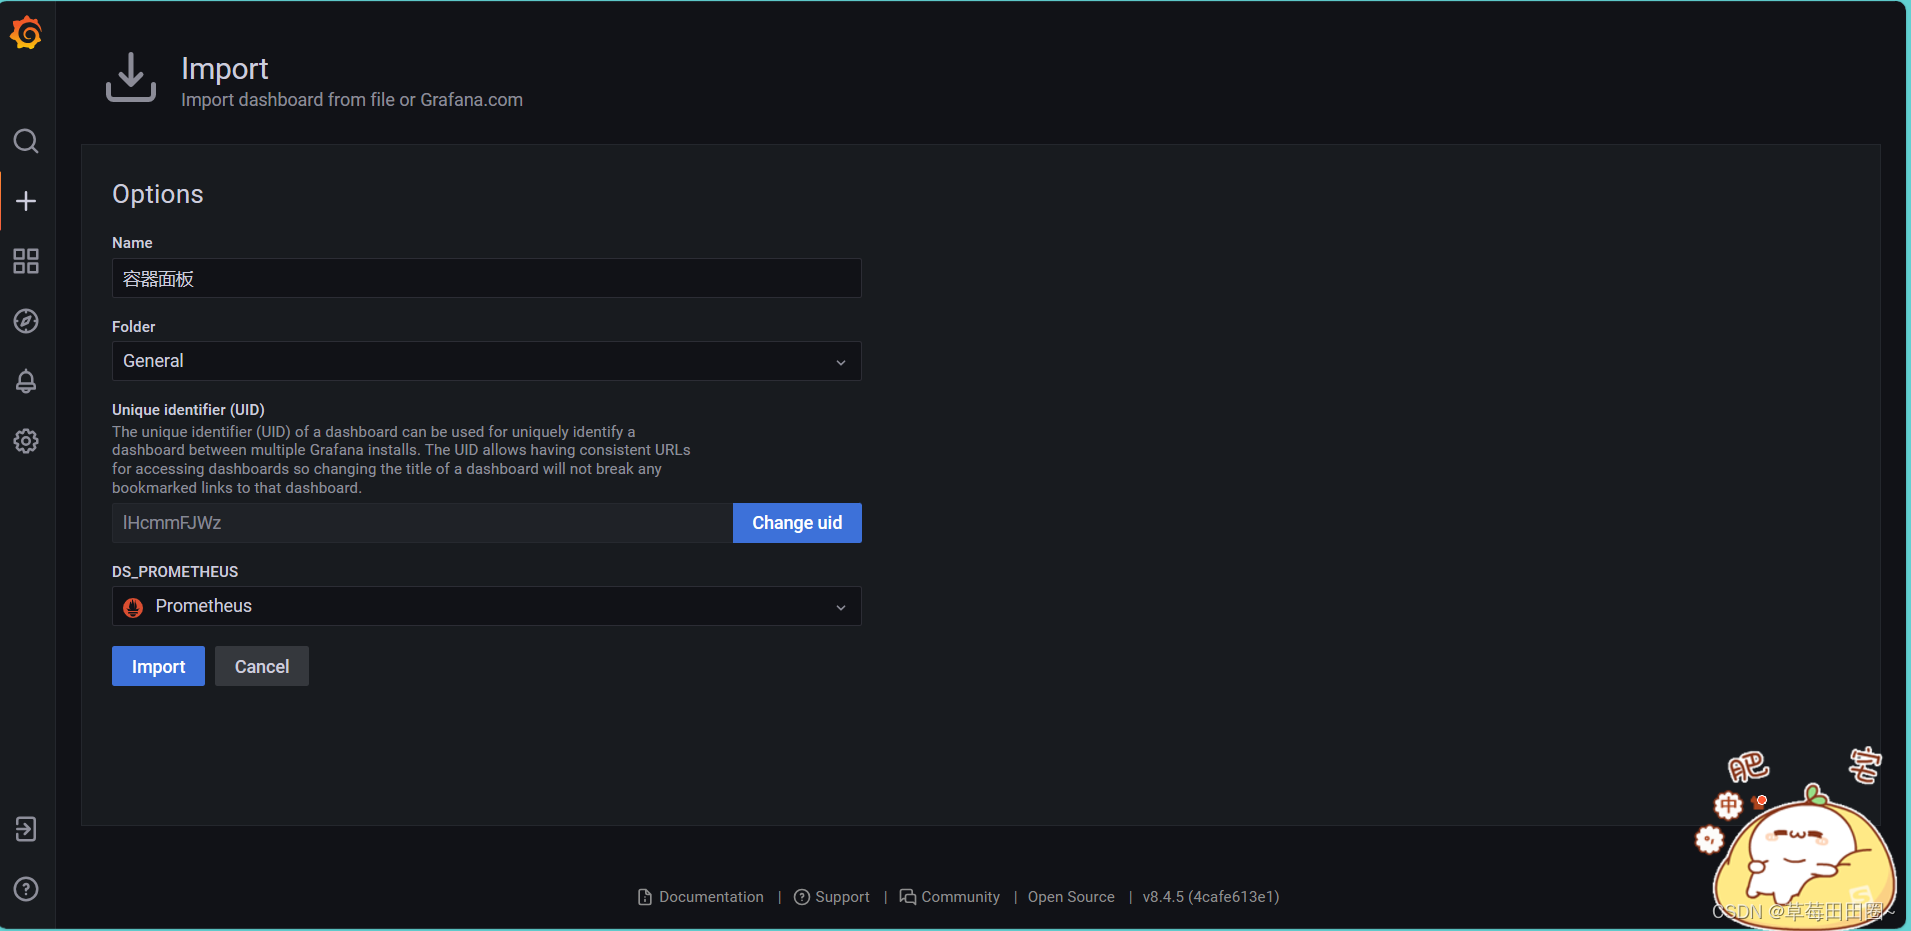
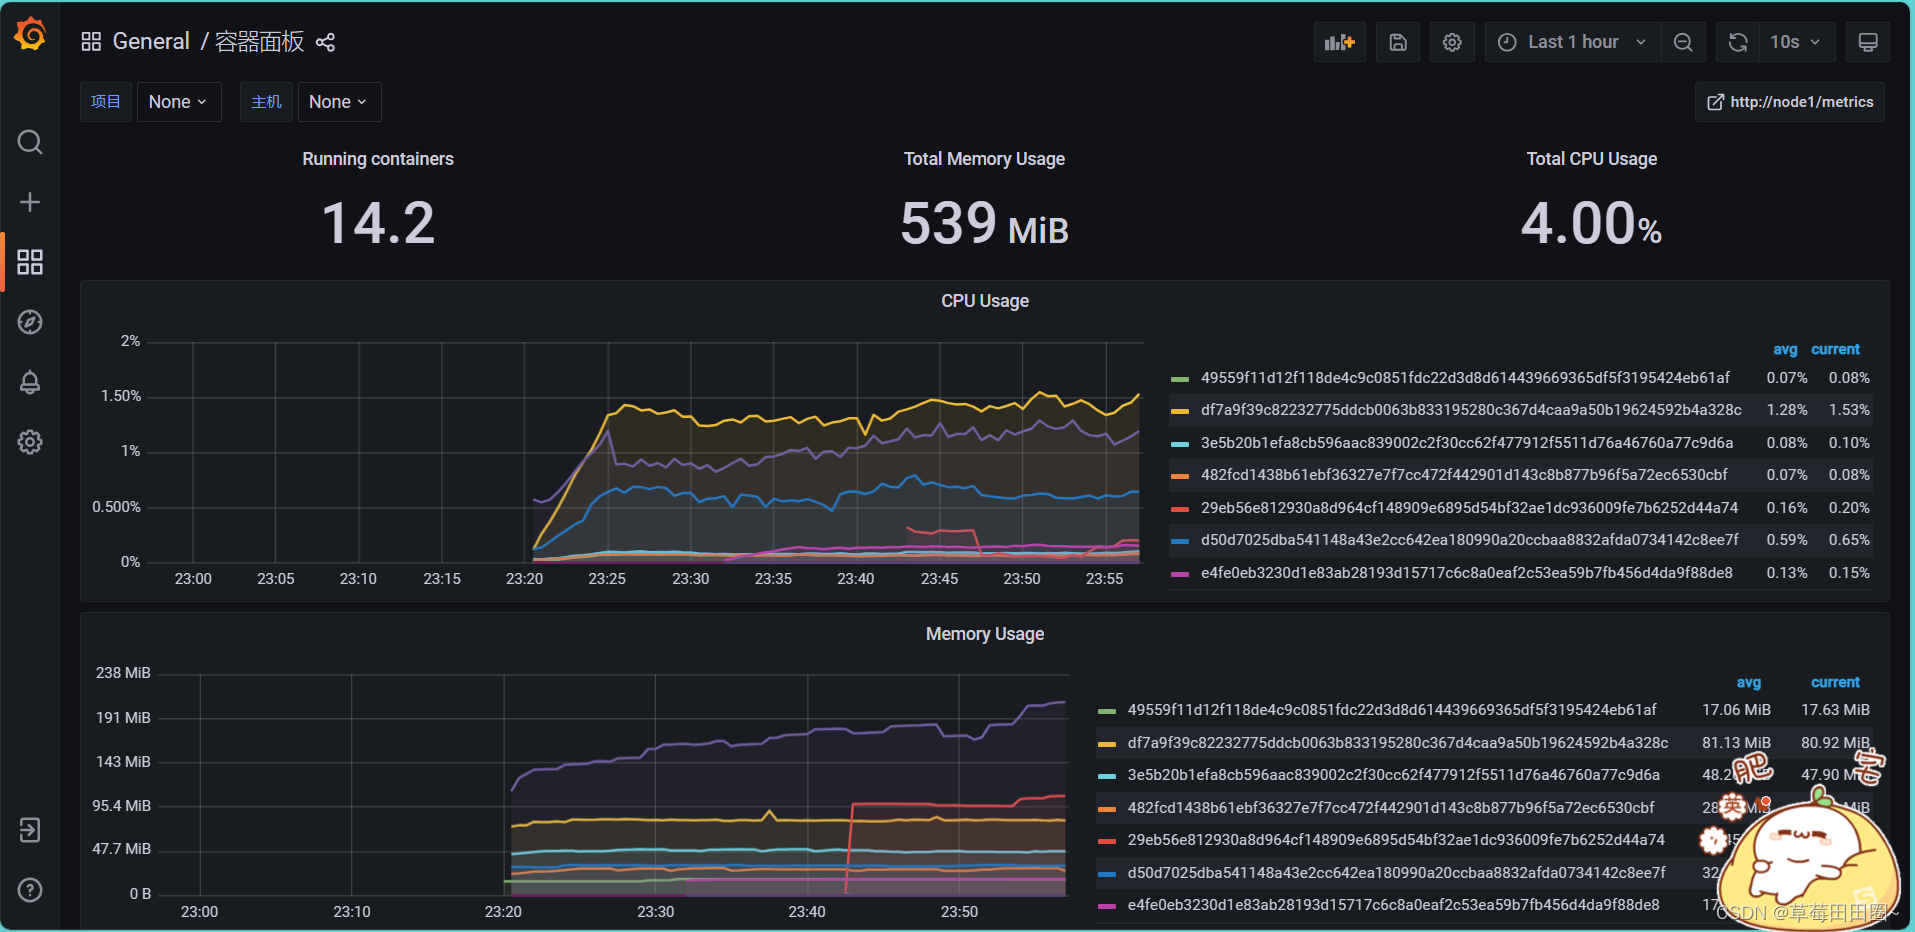
2.导入docker_rev1.json Docker监控模板:
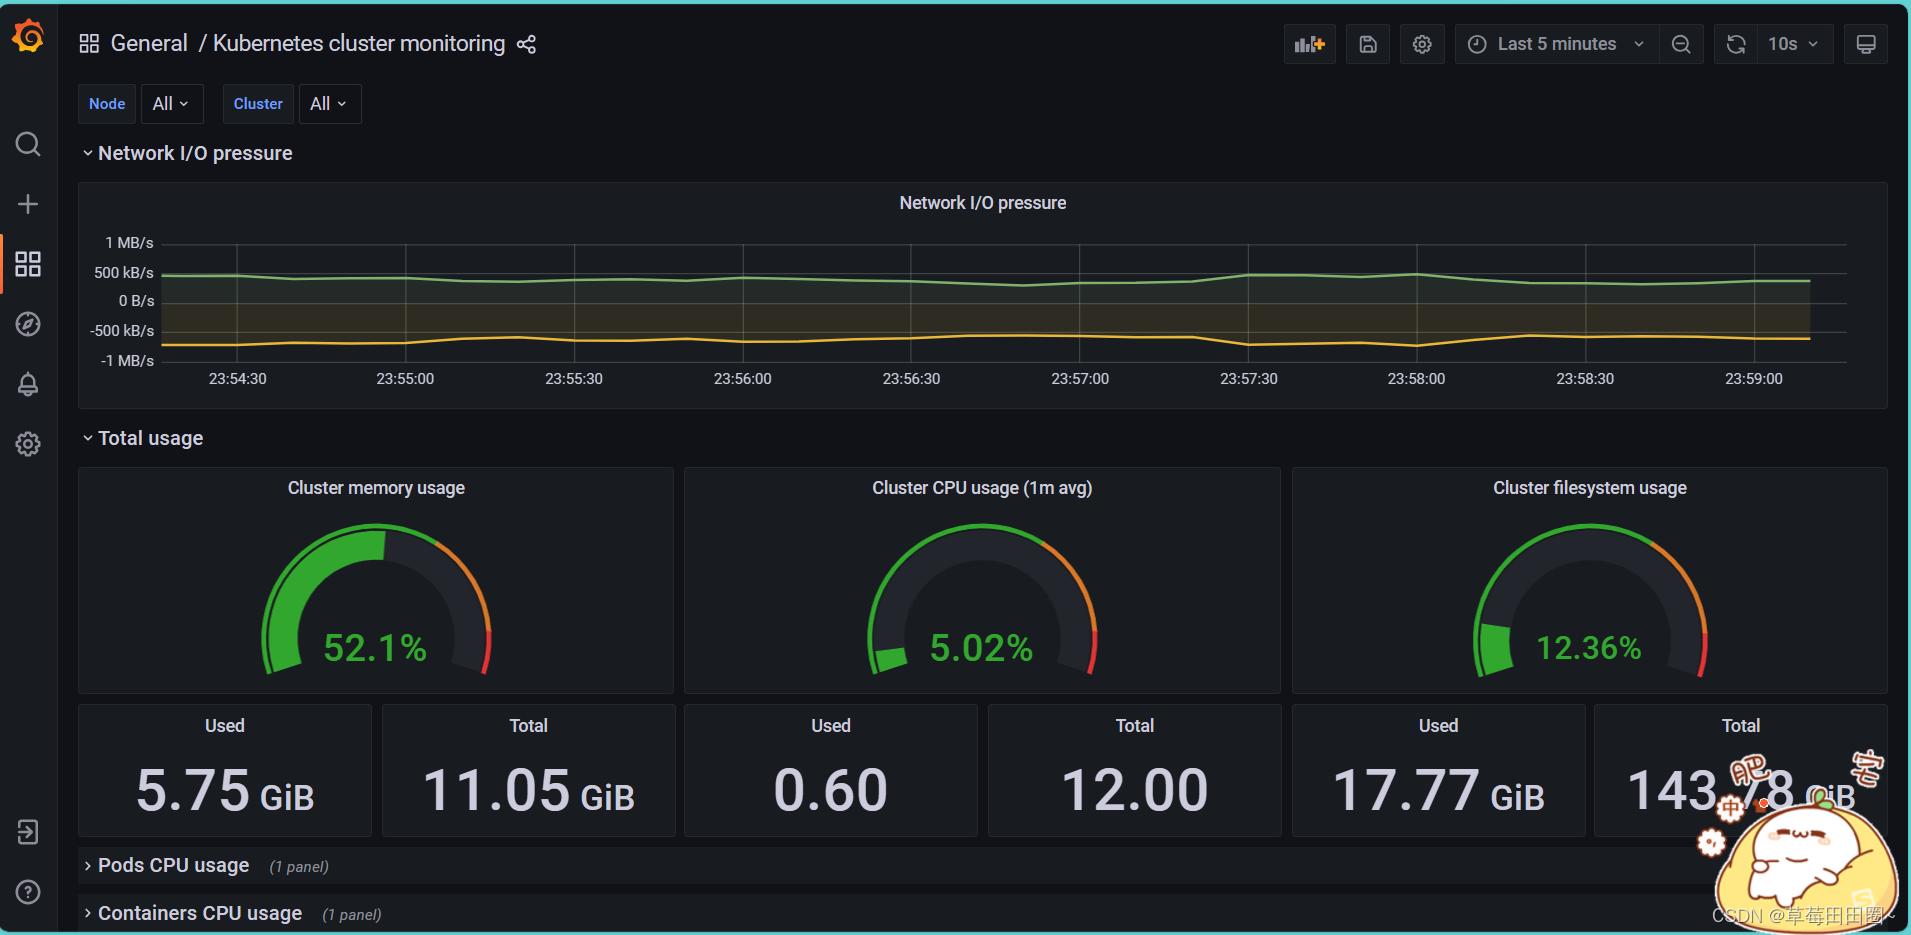
3.导入Kubernetes-1577691996738.jsonK8S-2监控模板:
九.拓展
1.热加载
curl -XPOST http://192.168.40.180:31090/-/reload
2.新增Service服务
在Service中添加注解才可以被Prometheus发现,如下图,这是我们定义的ConfigMap内容:
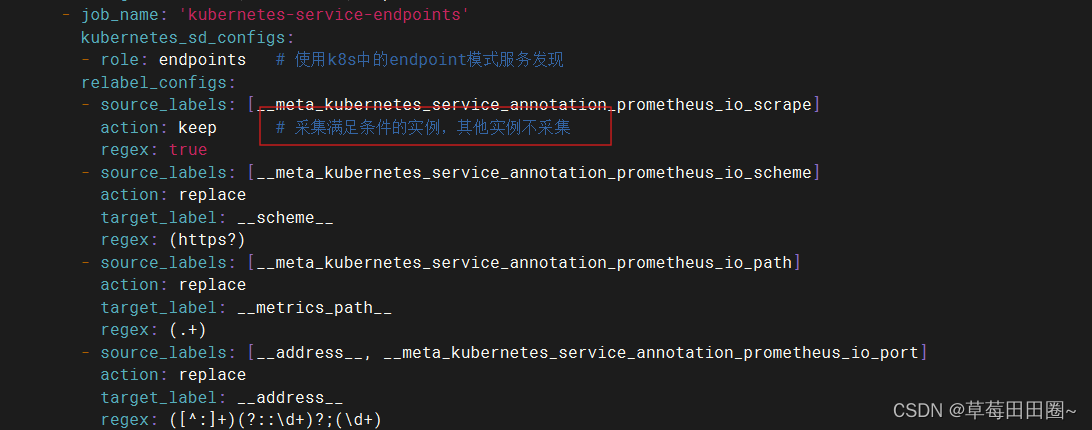
案例:以上面定义的prometheus-svc 为例子,添加prometheus_io_scrape注解。
vim prometheus-svc.yaml
---
apiVersion: v1
kind: Service
metadata:
  name: prometheus-svc
  namespace: prometheus
  labels:
    app: prometheus
  annotations:
    prometheus_io_scrape: "true"  # 注解,有这个才可以被Prometheus发现
spec:
  type: NodePort
  ports:
    - port: 9090
      targetPort: 9090
      nodePort: 31090
      protocol: TCP
  selector:
    app: prometheus
    component: server
更新一下资源清单:
kubectl apply -f prometheus-svc.yaml
热加载一下Prometheus:
curl -XPOST http://192.168.40.180:31090/-/reload
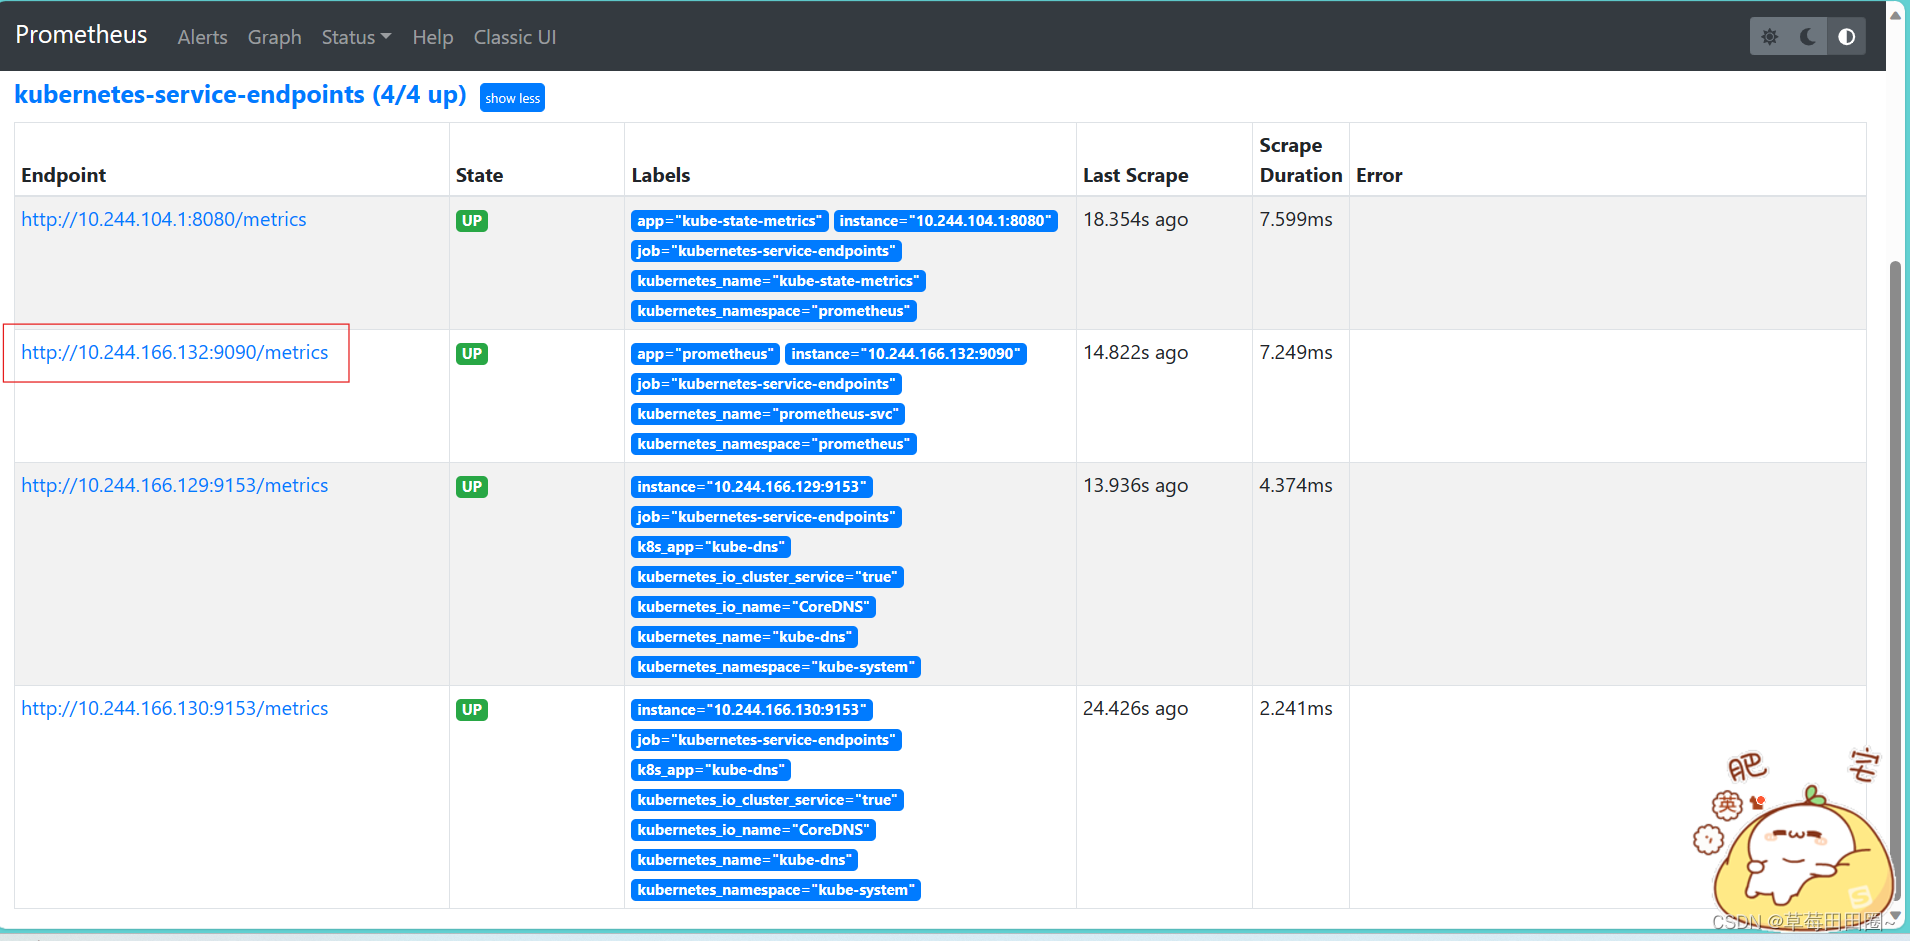
OK,Prometheus已经监控上了!


 1321
1321


 被折叠的 条评论
为什么被折叠?
被折叠的 条评论
为什么被折叠?
 到【灌水乐园】发言


