


一、简介
广州塔作为广州的地标性建筑,吸引了大量游客。其周边酒店的竞态分析对于投资者、酒店管理者以及旅游规划者来说具有重要意义。通过高德地图API爬取相关数据,可以全面了解广州塔周边酒店的分布、类型、评分等情况。
二、准备工作
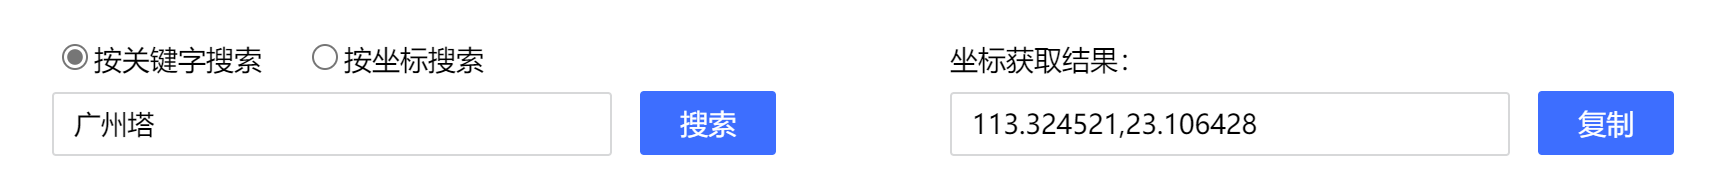
通过高德地图坐标拾取器,输入关键字获得坐标:坐标拾取器 | 高德地图API (amap.com)![]() https://lbs.amap.com/tools/picker
https://lbs.amap.com/tools/picker
阅读高德地图搜索POI文档,基础 API 文档-开发指南-Web服务 API | 高德地图API
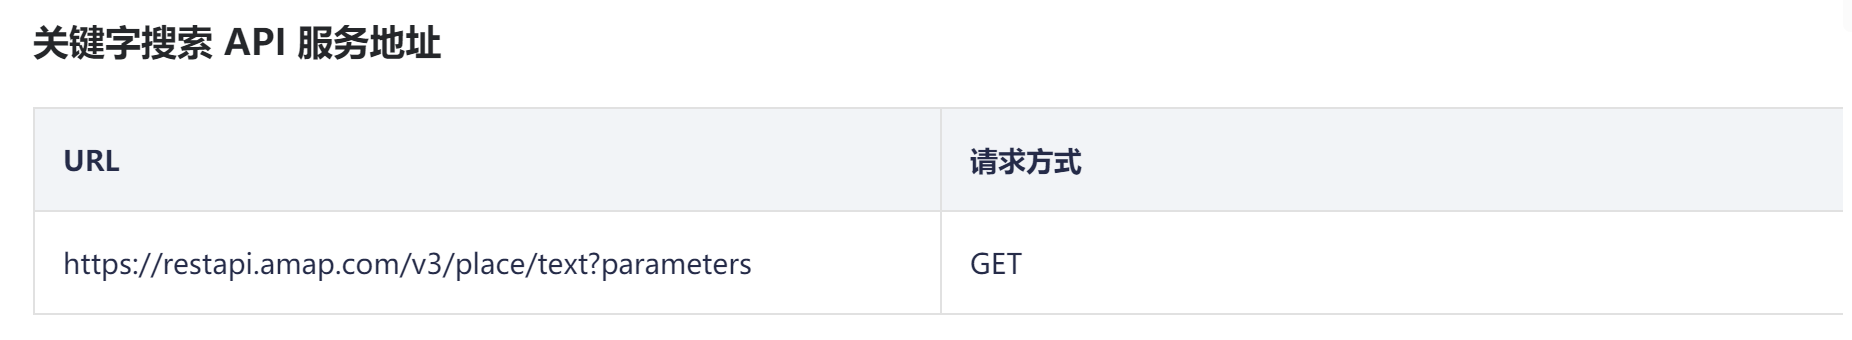
parameter就是我们要进行调整的参数。
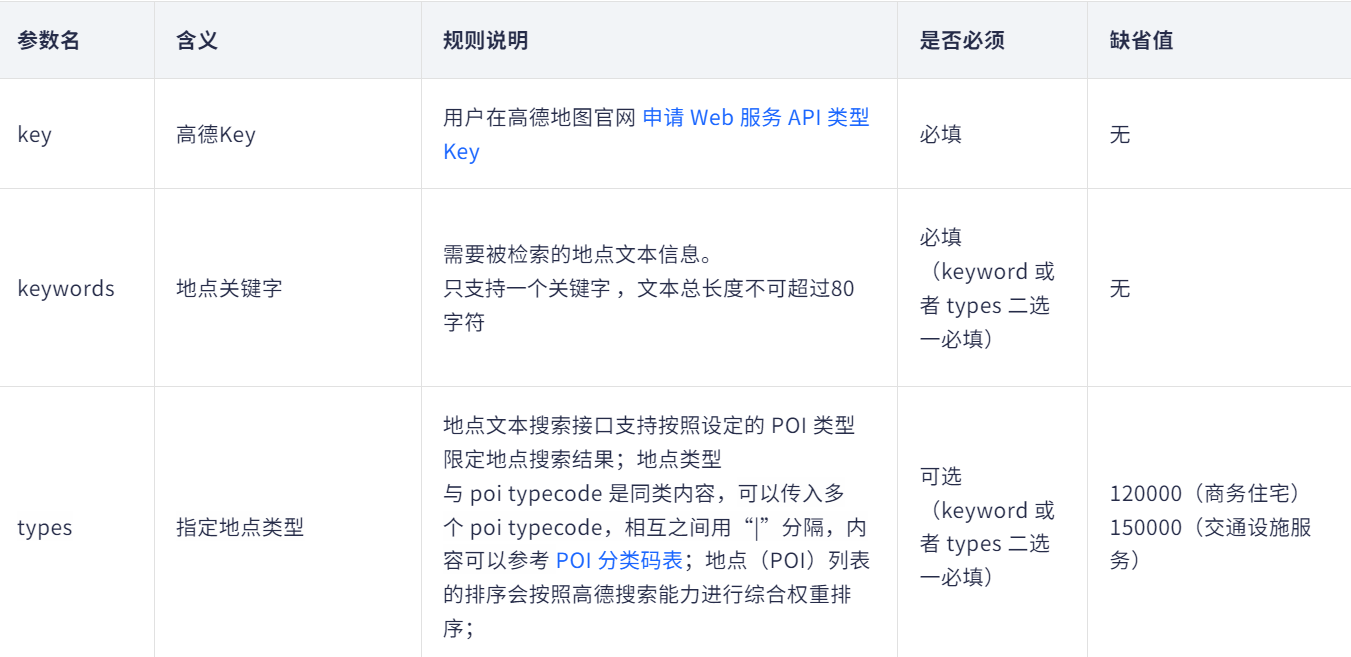
查看文档,根据需求调整参数,其中key和keywords(或者types)必填。
因为想要获取酒店的business的详细信息,需要对show_fields的参数进行设置。
三、数据抓取
import requests
import time
import pandas as pd
url='https://restapi.amap.com/v5/place/around?key=2f9b2fd9d640cbb7480bccda426d4ba2&keywords=酒店&location=113.324521,23.106428&radius=5000&show_fields=business&page_size=25&page_num=1'
#构建网址的操作
page=0
poi_all=pd.DataFrame()
while page<25: #构建翻页的模式
url_next=url.replace('page_num=1','page_num='+str(page))
poi=requests.get(url_next)
poi_text=eval(poi.text) #将request收到的数据进行转换
if poi_text['count']=='0':
break
else:
poi_d=pd.DataFrame(poi_text['pois']) #不同页面的数据合并到一个表格里
poi_all=pd.concat([poi_all, poi_d])
page+=1
time.sleep(3)
print(page)
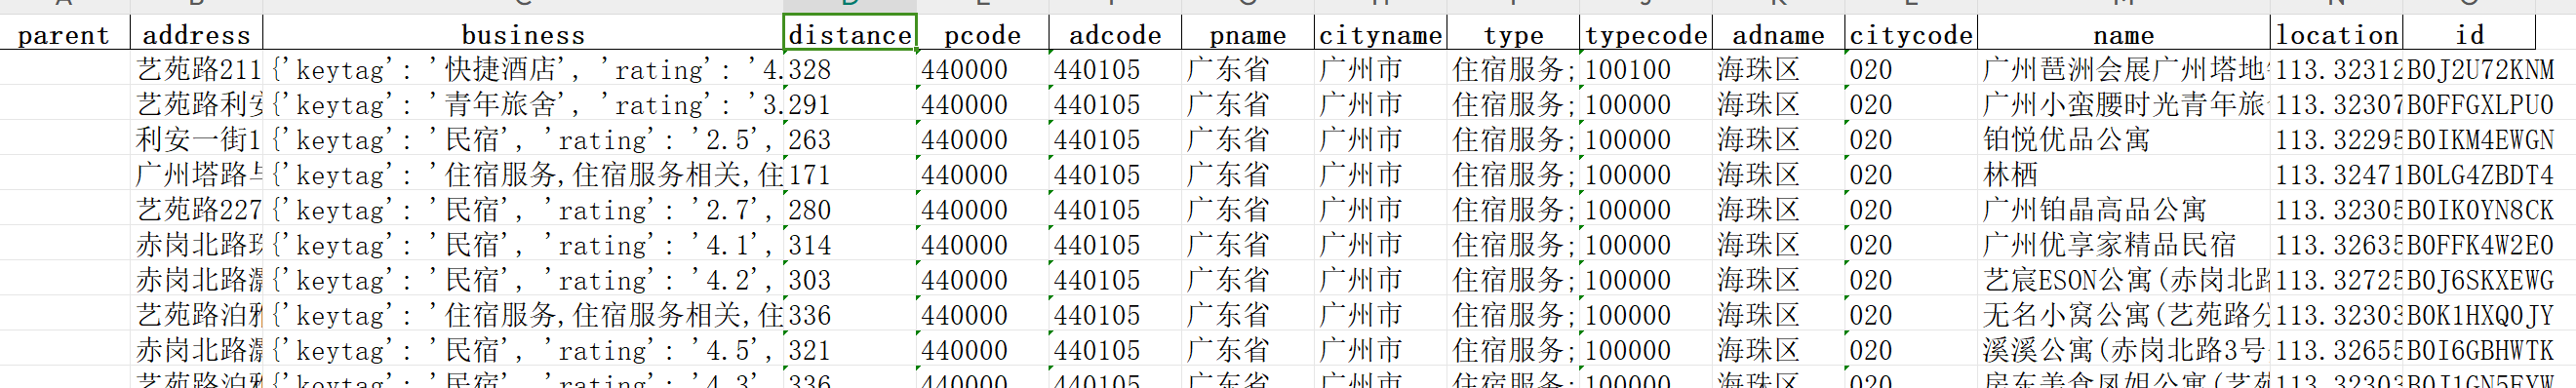
poi_all.to_excel('酒店高德.xlsx','Sheet1',index=False)爬取的数据详情如下图所示:
四、数据清洗
1.缺失值检验
2.重复值检验
df = pd.read_excel(r'酒店高德.xlsx','Sheet1')
print(df.info())
#缺失值检验
print(df.isnull().sum())
#重复值检验
print("重复行数为:", len(df[df.duplicated()]))
#删除重复值
df = df.drop_duplicates()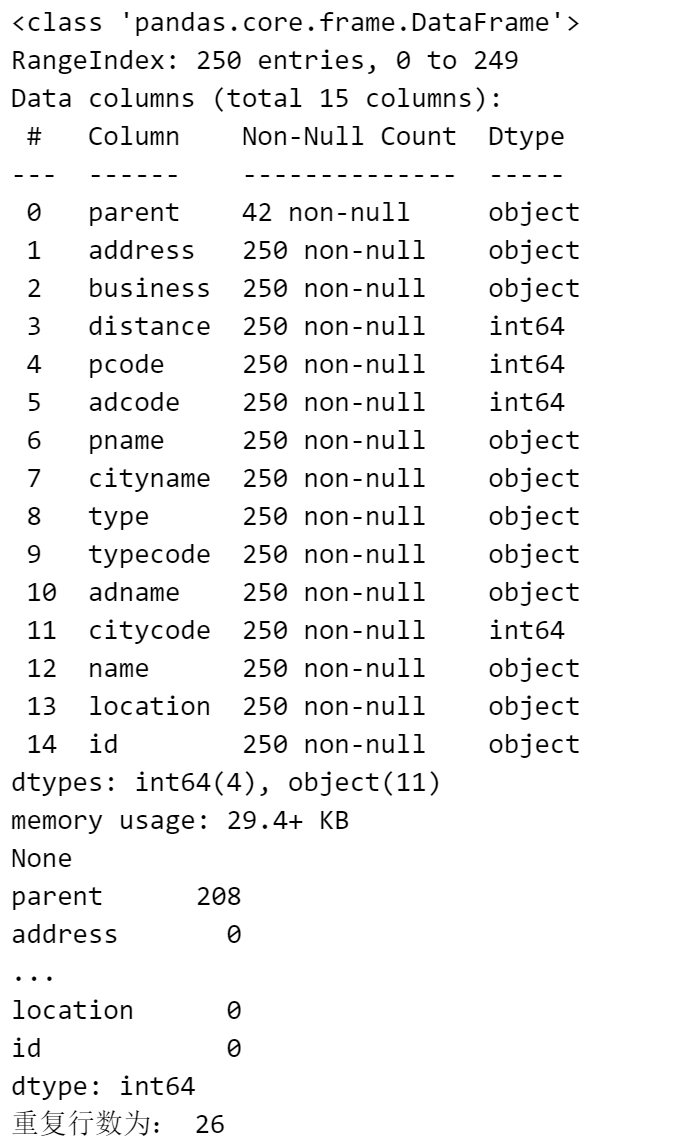
可以看到parent列有缺失值,但是是无关变量,所以无需处理。重复值有26行,剔除重复行。所以最终有224条数据。
3.对business列进行处理
df['business'] = df['business'].apply(ast.literal_eval)
if 'business' in df.columns:
    # 尝试直接从字典中提取字段
    df['keytag'] = df['business'].apply(lambda x: x.get('keytag', ''))
    df['rating'] = df['business'].apply(lambda x: x.get('rating', ''))
五、数据可视化
1.坐标可视化
import folium
poi=df['location'].str.split(',')
poi_map = folium.Map(location=[23.106428,113.324521], zoom_start=10,tiles='http://webrd02.is.autonavi.com/appmaptile?lang=zh_cn&size=1&scale=1&style=8&x={x}&y={y}&z={z}<ype=6',attr='AutoNavi')
folium.Marker(location=[23.106428,113.324521],icon=folium.Icon(color='red')).add_to(poi_map)
for p in poi:
folium.Marker(
location=p[::-1]
).add_to(poi_map)
for c in range(1,6):
folium.Circle(
radius=1000*c,
location=[23.106428,113.324521],
color='crimson',
fill=False,
).add_to(poi_map)
poi_map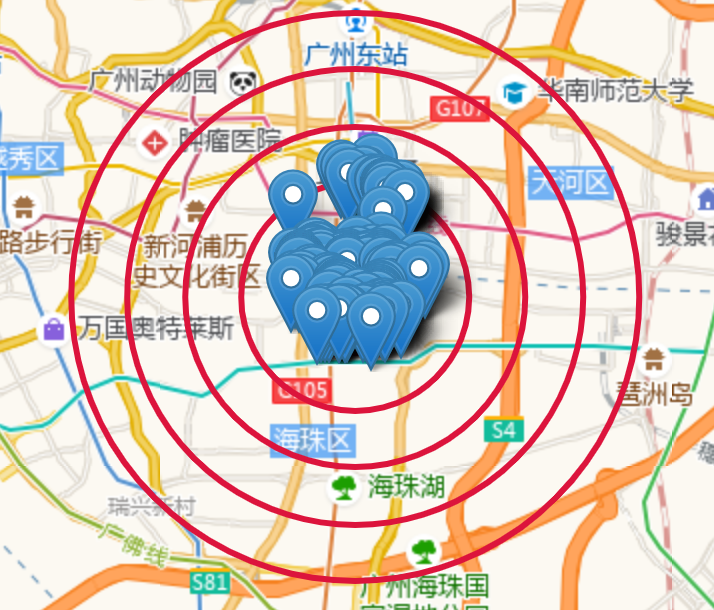
可以看到2公里范围外都没有相关数据,这可能是因为高德地图最多返回的poi数据是250条,而由于广州塔附近的酒店2公里范围内的数据远远超过250条,导致2公里范围之外的数据没有抓取到。
2.方位角统计
from math import sin, cos, atan2, pi
import numpy as np
from pyecharts import options as opts
from pyecharts.charts import Bar
#计算⽅向⻆
def calcu_azimuth(p1,p2):
    lat1, lon1 = np.radians(p1)
    lat2, lon2 = np.radians(p2)
    lat1_rad = lat1 * pi / 180
    lon1_rad = lon1 * pi / 180
    lat2_rad = lat2 * pi / 180
    lon2_rad = lon2 * pi / 180
    y = sin(lon2_rad - lon1_rad) * cos(lat2_rad)
    x = cos(lat1_rad) * sin(lat2_rad) - sin(lat1_rad) * cos(lat2_rad) * cos(lon2_rad -lon1_rad)
    brng = atan2(y, x) / pi * 180
    return float((brng + 360.0) % 360.0)
# 给定点
point = [23.106428,113.324521]
poi_r=df['location'].str.split(',')
poi=[]
for r in poi_r:
    r1=[float(item) for item in r]
    poi.append(r1)
# 计算方位角并分类
bearings = []
for p in poi:
    bearing = calcu_azimuth(point, p[::-1])
    bearing_class = ''
    if 0 <= bearing < 90:
        bearing_class = '0-90度'
    elif 90 <= bearing < 180:
        bearing_class = '90-180度'
    elif 180 <= bearing < 270:
        bearing_class = '180-270度'
    else:
        bearing_class = '270-360度'
    bearings.append(bearing_class)
# 更新数据
df['方位角'] = bearings
# 统计不同方位角的数据量
bearing_count = df['方位角'].value_counts()
# 生成柱状图
c = (
    Bar()
    .add_xaxis(bearing_count.index.values.tolist())
    .add_yaxis("不同方位角酒店数", bearing_count.values.tolist())
    .set_global_opts(title_opts=opts.TitleOpts(title="", subtitle=""))
    .render(r'方位角.html')
)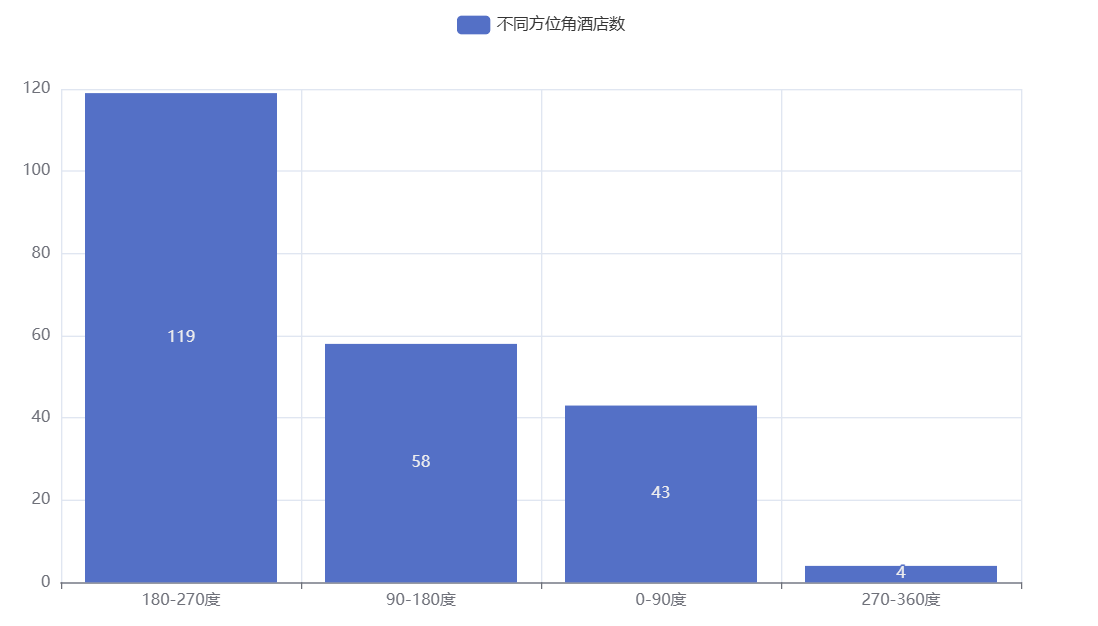
可以看到在广州塔两公里方位内,西南角(180-270度)的酒店数量最多,而西北角(270-360度)的酒店数量最少。也可以体现出西南角的酒店竞争是非常激烈的。
3.酒店类型情况词云图
from wordcloud import WordCloud
import matplotlib.pyplot as plt
plt.rcParams['font.family'] = 'SimHei'
plt.rcParams['font.size'] = 12
plt.rcParams['axes.unicode_minus'] = False
text = ' '.join(df['keytag'].astype(str))
wc = WordCloud(width=800, height=400,
               background_color='white',
               font_path='simhei.ttf',  # 设置字体路径,确保支持中文显示
               max_words=200).generate(text)
plt.imshow(wc, interpolation='bilinear')
plt.axis('off')  # 不显示坐标轴
plt.show()
由于分类比较杂乱,有些keytag部分数据含大、中、小分类,有些又仅有小类数据。因此采取了词云图的形式,可以看到广州塔附近民宿、经济型酒店以及公寓式酒店是比较多的。
4.酒店评分情况
import seaborn as sns
df['rating'] = pd.to_numeric(df['rating'], errors='coerce')
plt.figure(figsize=(8, 6))
sns.histplot(df['rating'], bins=5, kde=True)
plt.title('广州塔附近酒店评分情况')
plt.xlabel('评分')
plt.ylabel('数量')
plt.show()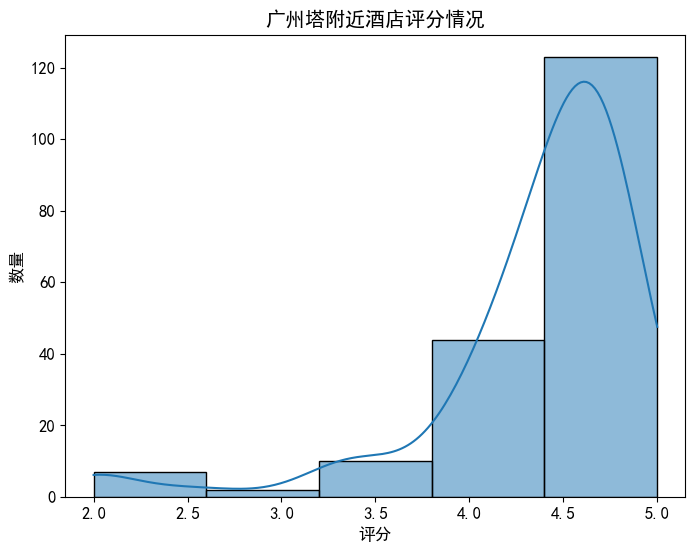
可以看到广州塔附近大多数酒店的评分在4.0以上,还是处于比较高的评价,给予了用户比较好的服务体验。这个反映了在服务质量方面的竞争也很激烈。
六、总结
酒店主要集中在广州塔周围,尤其是在海心沙和珠江新城区域。分布呈现出一定的聚集效应,可能与该区域的旅游吸引力和商业活动有关。同时可以看到仅广州塔两公里范围内就有200多家酒店,可见住宿服务的竞争是十分激烈的,特别是广州塔西南角方向的区域。


 被折叠的 条评论
为什么被折叠?
被折叠的 条评论
为什么被折叠?
 到【灌水乐园】发言


