官网: https://leafletjs.cn/reference.html#polygon

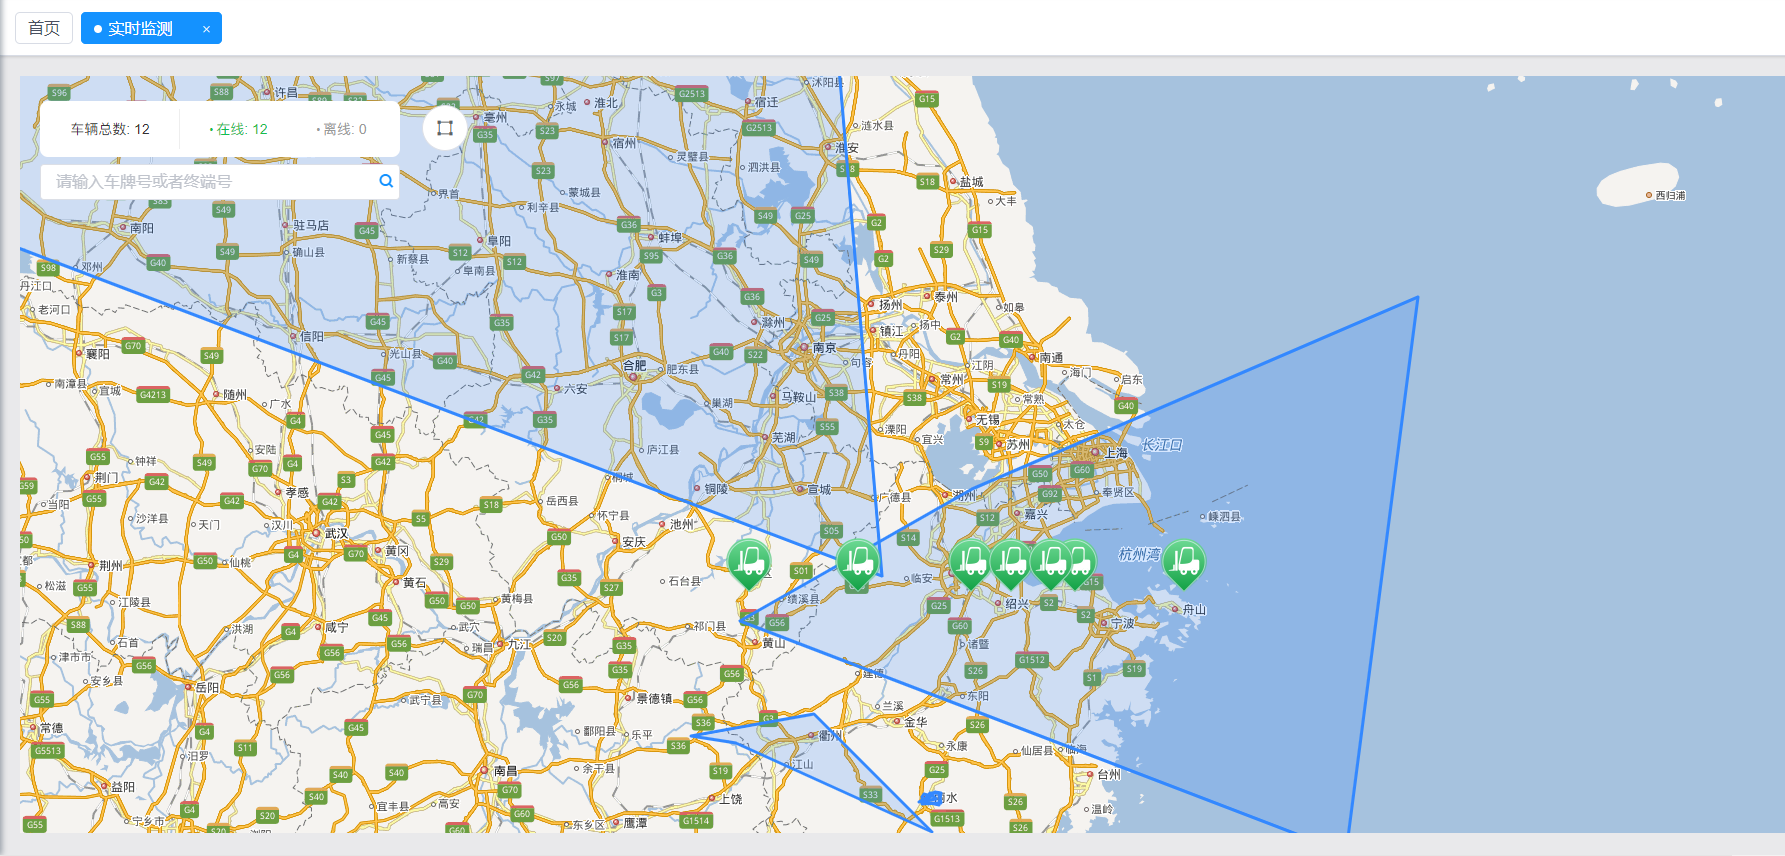
如图所示接口返回多个多边形经纬度和点位信息(注意: 以下省略了leaflet的引入步骤)
 // 在地图上画选框的方法
let pointsList = [
  [36.79364322167569, 118.07446541195007], [33.440106715216565, 109.72120044240603],
  [30.27022820630607, 119.5096078516515], [37.47082862133101, 118.7737041476045]
 ]
 this.map.addLayer(new L.Polygon(pointsList));
/**
* 清除多边形
* */
clearBorderList() {
this.map.eachLayer(function (layer) {
if (layer._path != null) {
layer.remove();
}
});
}, this.map.removeLayer(this.carsGroup) // 清除点位的方法// 打点的方法
this.carsGroup = L.layerGroup(markerGroup);
this.map.addLayer(this.carsGroup);
// 具体实现如下
/**
* 获取点位信息
* */
getCarsGroup(e) {
var carLists = [];
this.carsGroup = [];
var markerGroup = [];
var markerIcon = "";
markerIcon = L.divIcon({
className: "markerBox",
html: '<div><img class="eventMarker" src="/img/eventIcon/forklift.png" /></div>', // marker标注
iconSize: [40, 40],
iconAnchor: [20, 40], // marker宽高
});
this.getMarkerParams();
// interface
selectCarPoints(this.markerParams).then((res) => {
if (res.code === 1) {
carLists = res.data;
carLists.map((item) => {
var eventMarker = "";
if (item.cluster) {
eventMarker = new L.Marker(
{ lat: item.y, lng: item.x },
{ icon: markerIcon }
);
markerGroup.push(eventMarker);
} else {
eventMarker = new L.Marker(
{ lat: item.data.latitude, lng: item.data.longitude },
{ icon: markerIcon }
);
markerGroup.push(eventMarker);
}
});
}
this.carsGroup = L.layerGroup(markerGroup);
this.map.addLayer(this.carsGroup);
// 监听点击事件marker
this.handleClickEventMarker(markerGroup, carLists);
});
},
/**
* 初始化地图
* */
initMap() {
// 2、创建地图
this.map = L.map("map", {
// center: [28.465403, 119.933452],
center: [30.165101, 120.21000000000006],
zoom: 10,
attributionControl: false, // 隐藏logo
zoomControl: false,
crs: L.CRS.Baidu,
});
L.control
.zoom({
position: "bottomright",
})
.addTo(this.map);
// 添加底图
L.tileLayer.baidu({ layer: "custom_online" }).addTo(this.map);
this.getCarsGroup();
// 缩放改变聚合点
//this.map.on("zoomend", (e) => {
// this.getMapChange();
// });
// 移动改变聚合点
// this.map.on("moveend", (e) => {
// this.getMapChange();
// });
},
data() {
return {
markerParams: {
mapLevel: "",
bottomLeftLatitude: "",
bottomLeftLongitude: "",
topRightLatitude: "",
topRightLongitude: "",
}, // 点聚合参数
carsGroup: [], // 车辆 marker 组
// pointsArr: [], // 围栏的点位组
};
},// 顺便记录下 获取点聚合参数的方法
/**
* 获取聚合参数
* 地图左下角和右上角的经纬度
* mapLevel 缩放层级
* */
getMarkerParams() {
this.markerParams.mapLevel = this.map.getZoom();
this.markerParams.bottomLeftLatitude = this.map
.getBounds()
.getSouthWest().lat;
this.markerParams.bottomLeftLongitude = this.map
.getBounds()
.getSouthWest().lng;
this.markerParams.topRightLatitude = this.map
.getBounds()
.getNorthEast().lat;
this.markerParams.topRightLongitude = this.map
.getBounds()
.getNorthEast().lng;
},// 在地图上展示多边形的方法(点位是接口返回的)
/**
* 在地图上展示围栏
* */
getBorderList() {
// 点位数据格式如下
// [
// [36.79364322167569, 118.07446541195007], [33.440106715216565, 109.72120044240603],
// [30.27022820630607, 119.5096078516515], [37.47082862133101, 118.7737041476045]
// ]
this.pointsArr = [];
getBorderAllList().then((res) => {
if (res.code === 1 && res.data) {
res.data.forEach((item, index) => {
if (item.borderArea) {
this.pointsArr.push(JSON.parse(item.borderArea));
}
});
}
});
setTimeout(() => {
this.pointsArr.forEach((item, index) => {
this.showBorder = false;
this.map.addLayer(new L.Polygon(item));
});
}, 200);
},


 1254
1254

 被折叠的 条评论
为什么被折叠?


