


准备工作
elasticsearch-7.XX需要更高版本的java(11),而提高es的版本也需要提高filebeat的版本!我这里使用的是jdk8,所以下载的elasticsearch-5.6.0
下载地址:https://www.elastic.co/cn/downloads/elasticsearch地址
一、安装elasticearch
1. 下载完成elasticsearch之后时行解压缩;
Linux解压命令:
tar -zxvf 压缩文件名.tar.gz
2. 创建用户组和用户
由于elasticsearch启动不可以用root用户启用,所以这里需要创建用户和组,命令如下:
   groupadd esgroup
   useradd esuser -g esgroup -p espassword
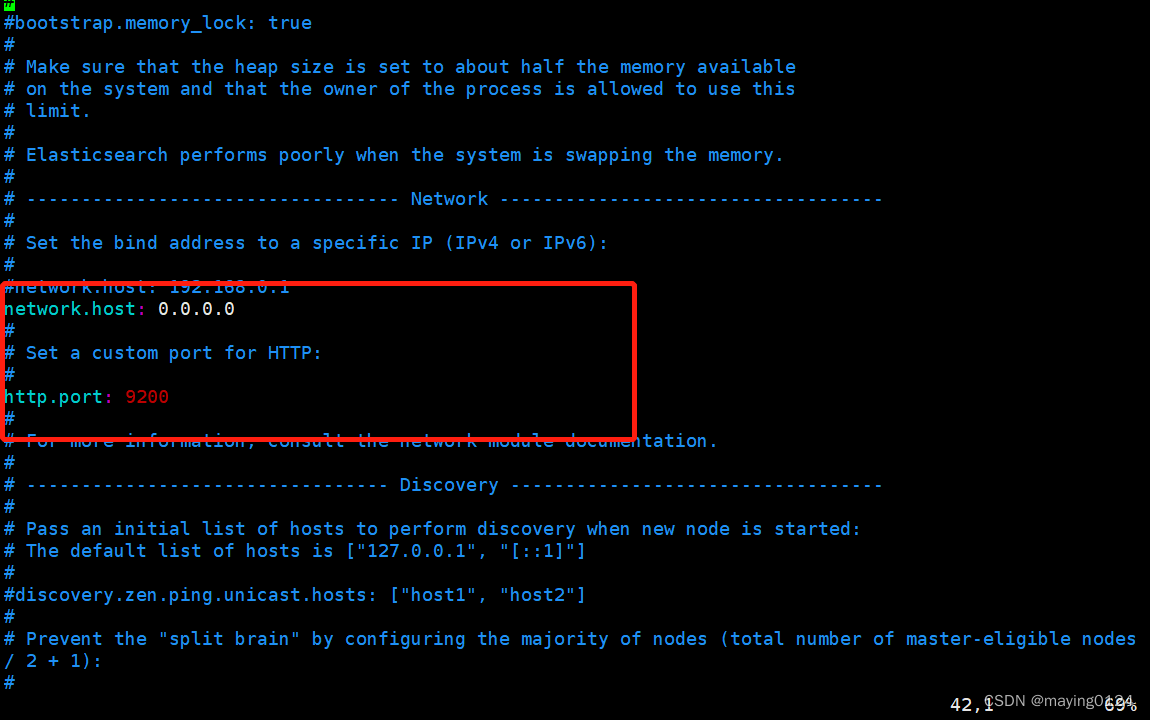
3. 修改配置
设置 network.host: 0.0.0.0
http.port: 9200
4. 启动
切换用户并启动
su esuser
   ./bin/elasticsearch
   su esuser
   ./bin/elasticsearch -d     启动在后台运行
5.启动过程中的问题
此部分引用:https://blog.csdn.net/cookzrk/article/details/80179006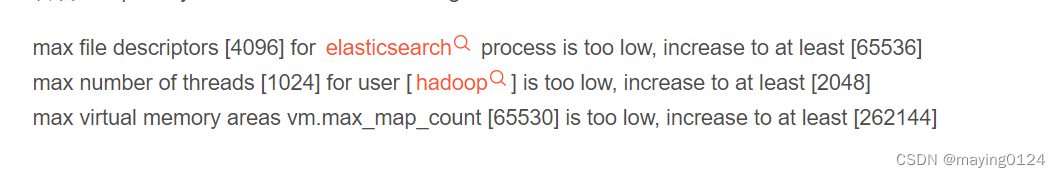 解决方案:max file descriptors [4096] for elasticsearch process is too low, increase to at least [65536]
切换到root用户
ulimit -Hn 查看硬限制
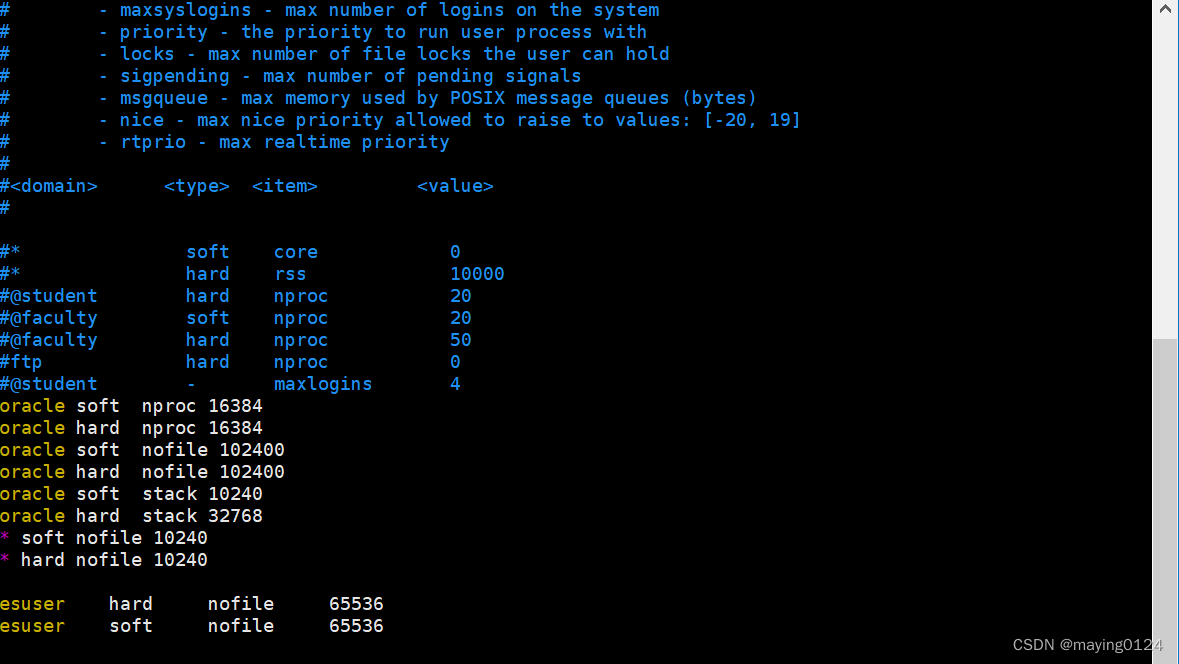
vim /etc/security/limits.conf
添加下面设置 hadoop是用户
esuser hard nofile 65536
esuser soft nofile 65536
退出用户重新登录,使配置生效
重新 ulimit -Hn 查看硬限制 会发现数值有4096改成65535
vi /etc/sysctl.conf
添加下面配置:
vm.max_map_count=655360
并执行命令:
sysctl -p
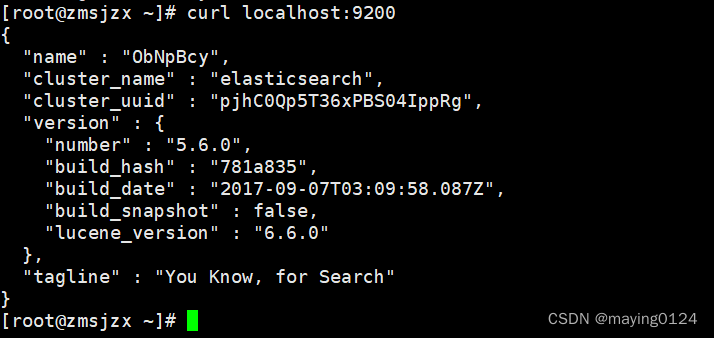
6.启动成功后:
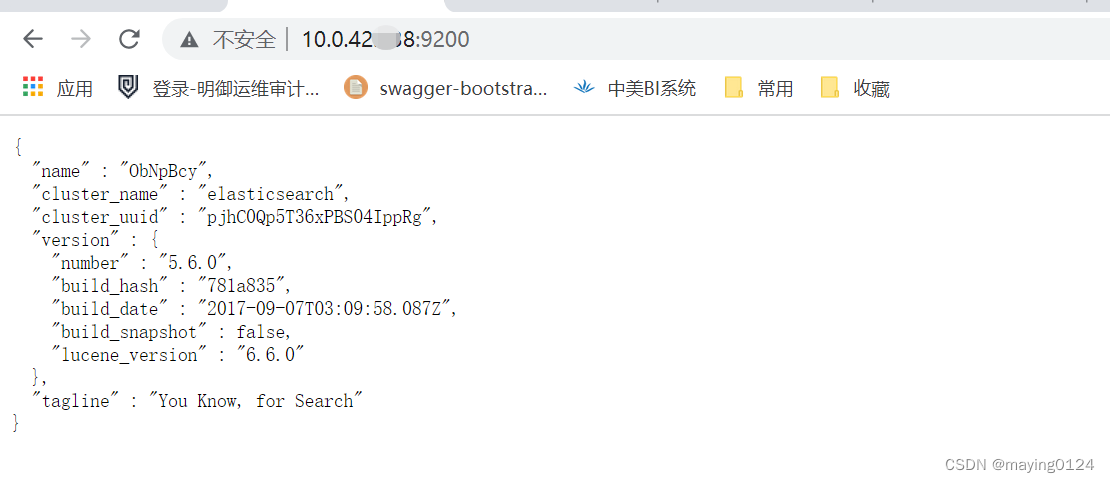
二、安装filebeat
1.下载对应的安装包,在要获取日志的服务器上解压
下载地址 filebeat下载地址
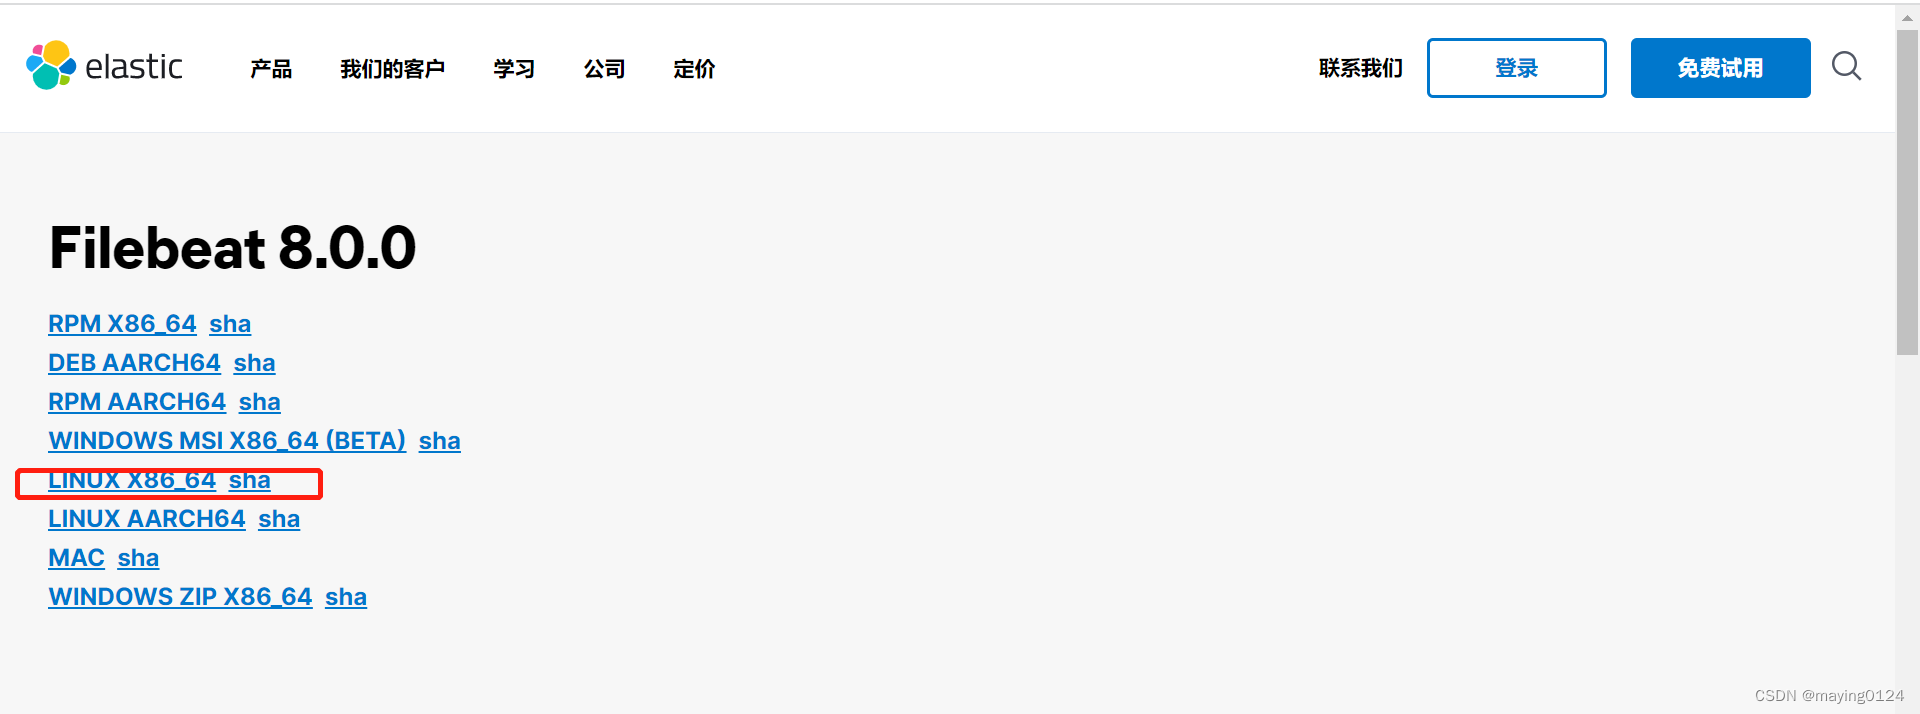
我这里统一用的filebeat-5.6.0-linux-x86_64.tar.gz
2.下载后完成解压
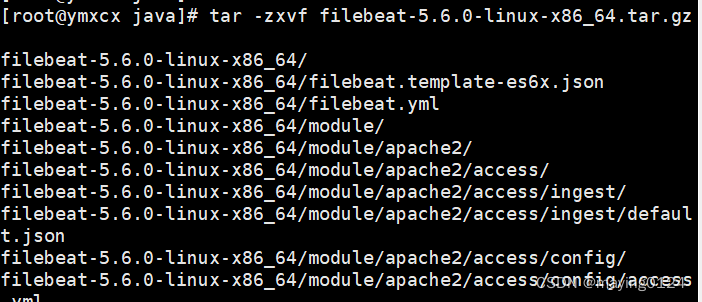
3.修改配置文件filebeat.yml
###################### Filebeat Configuration Example #########################

# This file is an example configuration file highlighting only the most common
# options. The filebeat.full.yml file from the same directory contains all the
# supported options with more comments. You can use it as a reference.
#
# You can find the full configuration reference here:
# https://www.elastic.co/guide/en/beats/filebeat/index.html

#=========================== Filebeat prospectors =============================

# 输入
fieldeat.inputs:
- type: log
  enabled: true
  paths:
    - /usr/java/apache-tomcat-8.5.64/bin/logs/*.log

# 指定索引的分区数
setup.template.settings:
  index.number_of_shards: 3


  #指定kibana所在主机的ip和服务监听的端口
setup.kibana:
host: "10.0.42.238:5601"


filebeat.prospectors:

# Each - is a prospector. Most options can be set at the prospector level, so
# you can use different prospectors for various configurations.
# Below are the prospector specific configurations.

- input_type: log

  # Paths that should be crawled and fetched. Glob based paths.
  paths:
    - /usr/java/apache-tomcat-8.5.64/bin/logs/*.log
    #- c:\programdata\elasticsearch\logs\*

  # Exclude lines. A list of regular expressions to match. It drops the lines that are
  # matching any regular expression from the list.
  #exclude_lines: ["^DBG"]

  # Include lines. A list of regular expressions to match. It exports the lines that are
  # matching any regular expression from the list.
  #include_lines: ["^ERR", "^WARN"]

  # Exclude files. A list of regular expressions to match. Filebeat drops the files that
  # are matching any regular expression from the list. By default, no files are dropped.
  #exclude_files: [".gz$"]

  # Optional additional fields. These field can be freely picked
  # to add additional information to the crawled log files for filtering
  #fields:
  #  level: debug
  #  review: 1

  ### Multiline options

  # Mutiline can be used for log messages spanning multiple lines. This is common
  # for Java Stack Traces or C-Line Continuation

  # The regexp Pattern that has to be matched. The example pattern matches all lines starting with [
  #multiline.pattern: ^\[

  # Defines if the pattern set under pattern should be negated or not. Default is false.
  #multiline.negate: false

  # Match can be set to "after" or "before". It is used to define if lines should be append to a pattern
  # that was (not) matched before or after or as long as a pattern is not matched based on negate.
  # Note: After is the equivalent to previous and before is the equivalent to to next in Logstash
  #multiline.match: after


#================================ General =====================================

# The name of the shipper that publishes the network data. It can be used to group
# all the transactions sent by a single shipper in the web interface.
#name:

# The tags of the shipper are included in their own field with each
# transaction published.
#tags: ["service-X", "web-tier"]

# Optional fields that you can specify to add additional information to the
# output.
#fields:
#  env: staging

#================================ Outputs =====================================

# Configure what outputs to use when sending the data collected by the beat.
# Multiple outputs may be used.

#-------------------------- Elasticsearch output ------------------------------
output.elasticsearch:
   #enabled:true

  # Array of hosts to connect to.
  hosts: ["10.0.42.238:9200"]

  # Optional protocol and basic auth credentials.
  protocol: "http"
 # username: "elastic"
 # password: "changeme"

  #index:"filebeatYM-%{+yyyy.MM.dd}"
#----------------------------- Logstash output --------------------------------
#output.logstash:
  # The Logstash hosts
  #hosts: ["localhost:5044"]

  # Optional SSL. By default is off.
  # List of root certificates for HTTPS server verifications
  #ssl.certificate_authorities: ["/etc/pki/root/ca.pem"]

  # Certificate for SSL client authentication
  #ssl.certificate: "/etc/pki/client/cert.pem"

  # Client Certificate Key
  #ssl.key: "/etc/pki/client/cert.key"

#================================ Logging =====================================

# Sets log level. The default log level is info.
# Available log levels are: critical, error, warning, info, debug
#logging.level: debug

# At debug level, you can selectively enable logging only for some components.
# To enable all selectors use ["*"]. Examples of other selectors are "beat",
# "publish", "service".
#logging.selectors: ["*"]
4.启动filebeat
- 测试filebeat启动后,查看相关输出信息
./filebeat -e -c filebeat.yml -d "publish"
2.后台方式启动filebeat:
nohup ./filebeat -e -c filebeat.yml >/dev/null 2>&1 & 将所有标准输出及标准错误输出到/dev/null空设备,即没有任何输出
nohup ./filebeat -e -c filebeat.yml > filebeat.log &
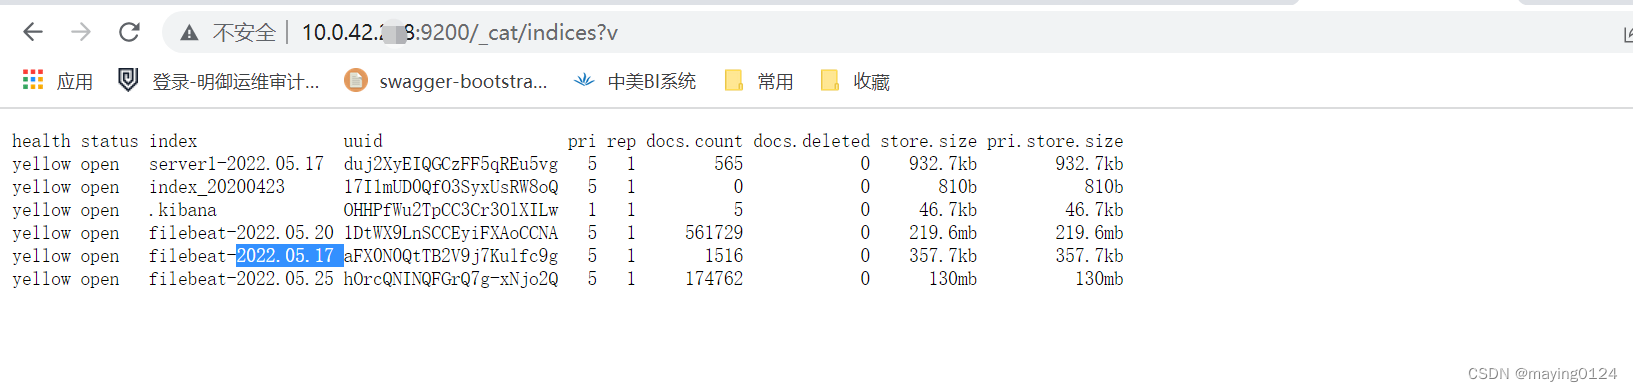
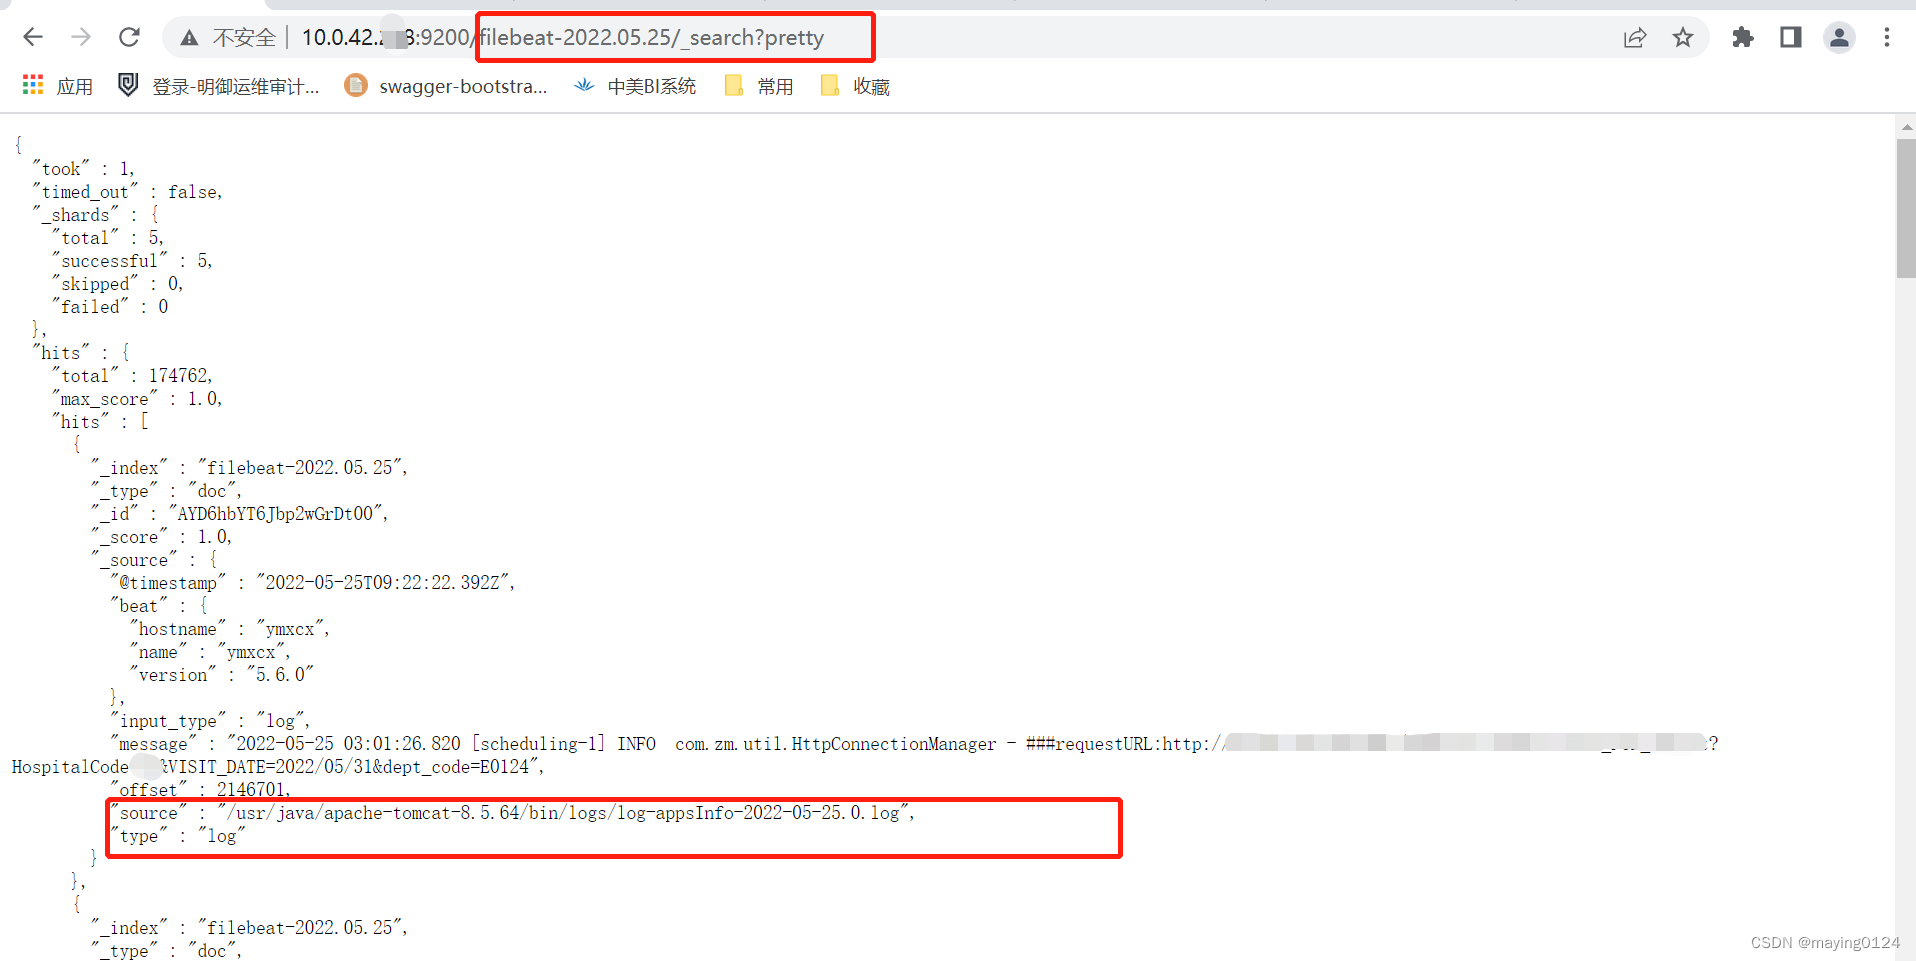
启动成功后,会根据yml文件里配的elasticsearch 地址,向其输入日志文件:
三、kibana安装部署
kibanan是elasticsearch的可视化平台
1.下载kibana安装包,我这里下载的kibana-5.6.0-linux-x86_64
下载地址:https://www.elastic.co/cn/downloads/past-releases/kibana-5-6-0下载连接
2.下载完成后进行解压
tar -zxvf kibana-5.6.0-linux-x86_64.tar.gz
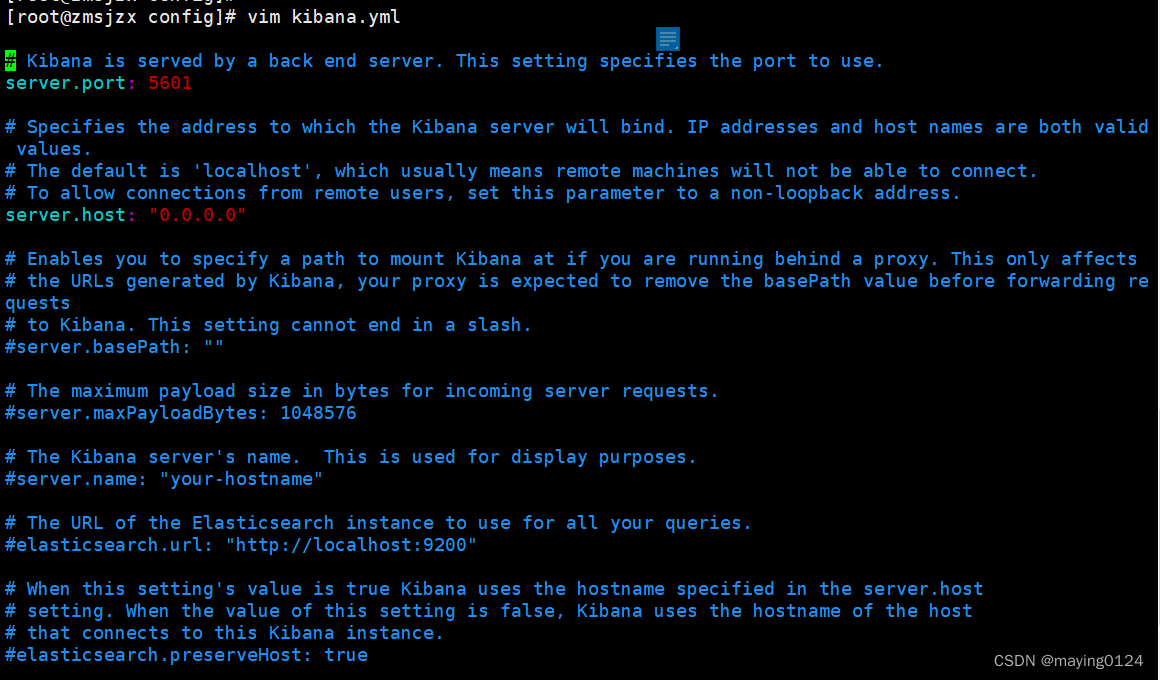
3.修改配置文件
然后到kibana安装目录的config下,编辑kibana.yml配置文件,添加如下配置:
4.启动Kibana
 cd /run/kibana-xxx-linux-x86_64/bin
 ./kibana &

主要使用&命令启动后,退出当前窗口时需要使用exit退出
成功启动后,可以访问:http:// ip: 5601来访问kibana,ip为kibana安装节点ip,端口默认为5601,可以在config/kibana.yml中配置
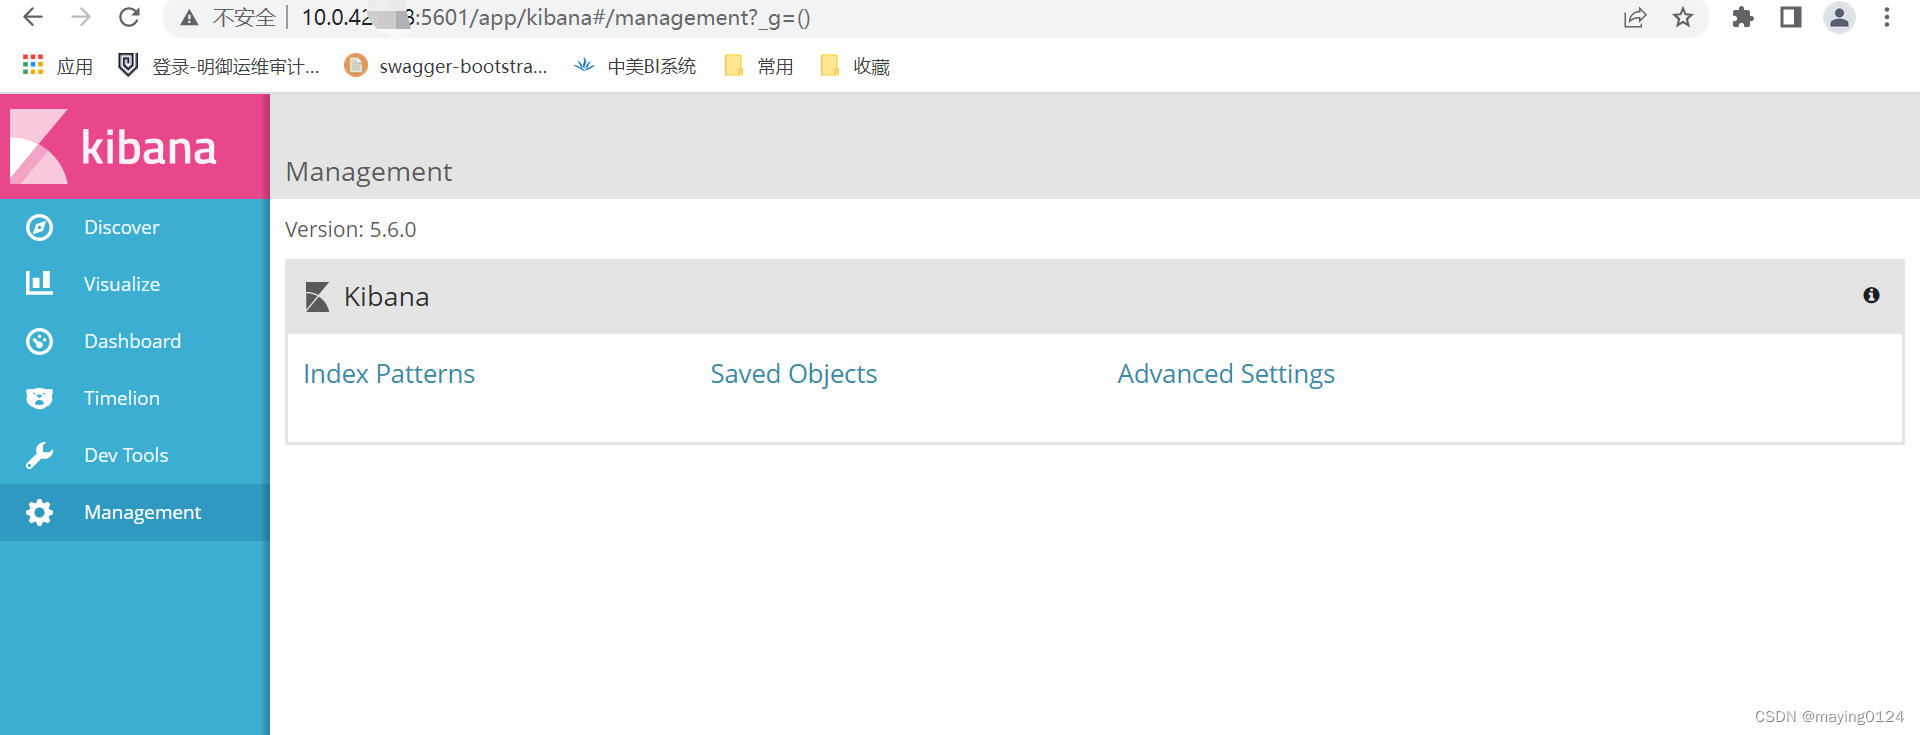
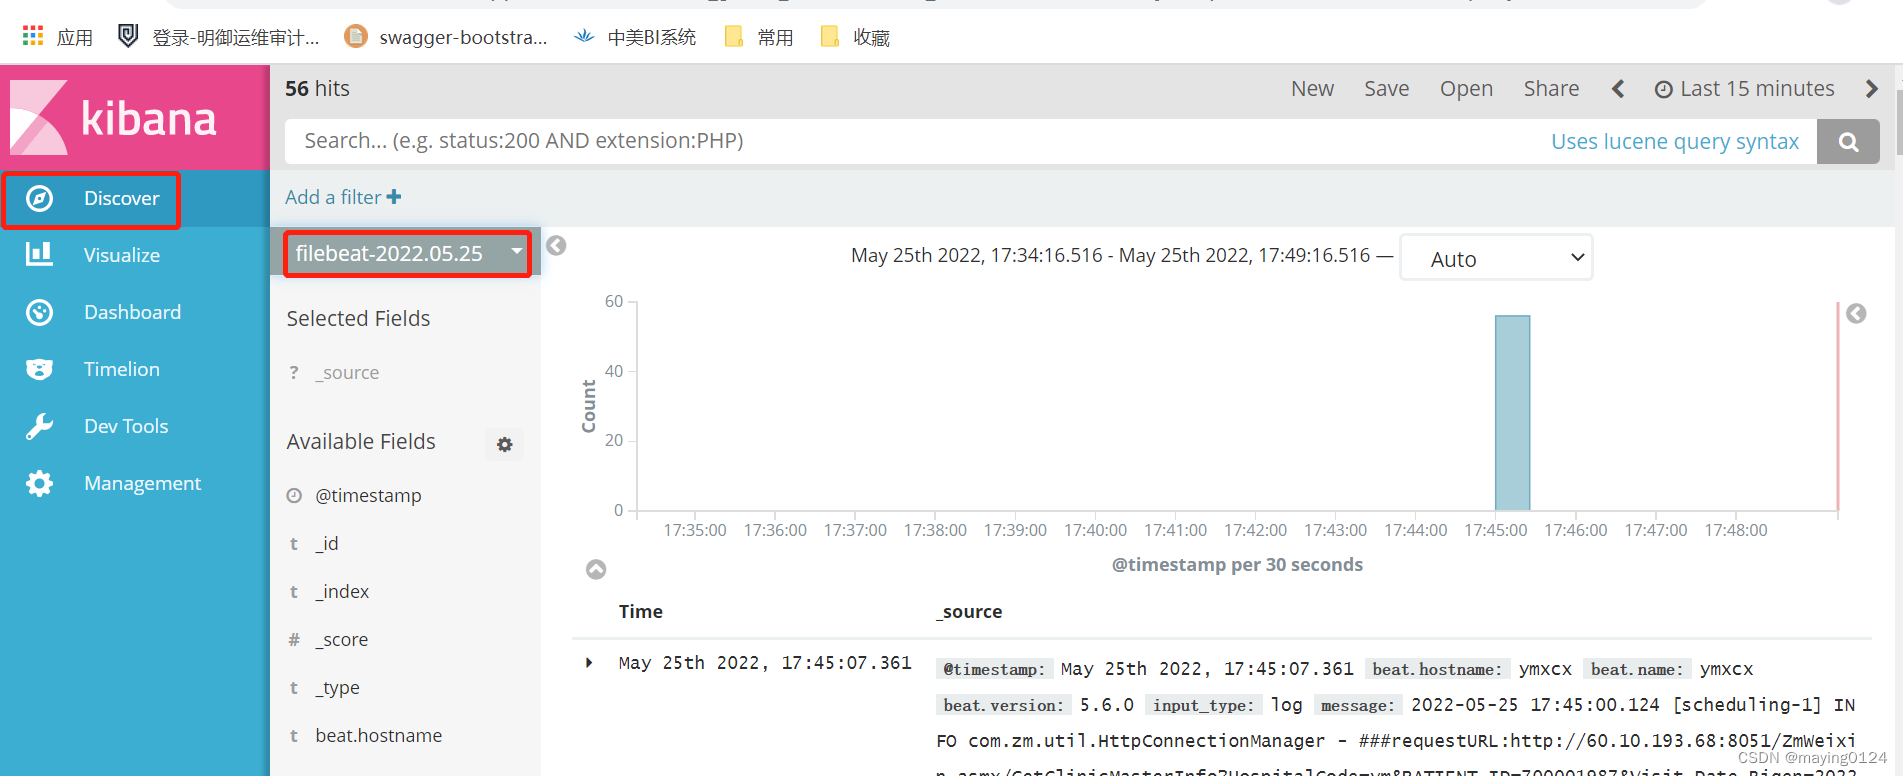
然后就可以查找自己的日志内容了!


 829
829


 被折叠的 条评论
为什么被折叠?
被折叠的 条评论
为什么被折叠?
 到【灌水乐园】发言


