


一、概述
Prometheus 几乎已成为监控领域的事实标准,它自带高效的时序数据库存储TSDB,可以让单台 Prometheus 能够高效的处理大量的数据,还有友好并且强大的 PromQL 语法,可以用来灵活的查询各种监控数据以及配置告警规则,同时它的 pull 模型指标采集方式被广泛采纳,非常多的应用都实现了 Prometheus 的 metrics 接口以暴露自身各项数据指标让 Prometheus 去采集,很多没有适配的应用也会有第三方 exporter 帮它去适配 Prometheus,所以监控系统我们通常首选用 Prometheus,所以我们的监控系统的方案也都围绕promtheus展开。
二、Prometheus痛点及解决方案
Prometheus存在单点故障,具体痛点可以这么描述
Prometheus本身只支持单机部署,也不支持高可用及水平扩容。其单机存储和抓取能力都有上限,容易单点故障。
虽然有一种方式是通过部署N个Prometheus分别抓取不同的target来分摊压力的,但是grafana就要为不同的图表配置不同的Prometheus地址(数据源),而且不同数据源之间不能聚合查询,监控页面也看不到全局的视图,造成查询混乱,复杂程度比较棘手。
Thanos+Prometheus可以解决这个问题,它提供了一个核心能力
- thanos query组件可以反向代理到N个Prometheus,然后grafana直接指向thanos query即可,thanos query会从N个Prometheus同时查询数据,返回满足PromQL的数据结果。这样Prometheus挂了一台也不影响服务,数据在其他Prometheus上还有,很好的解决了单点故障问题。
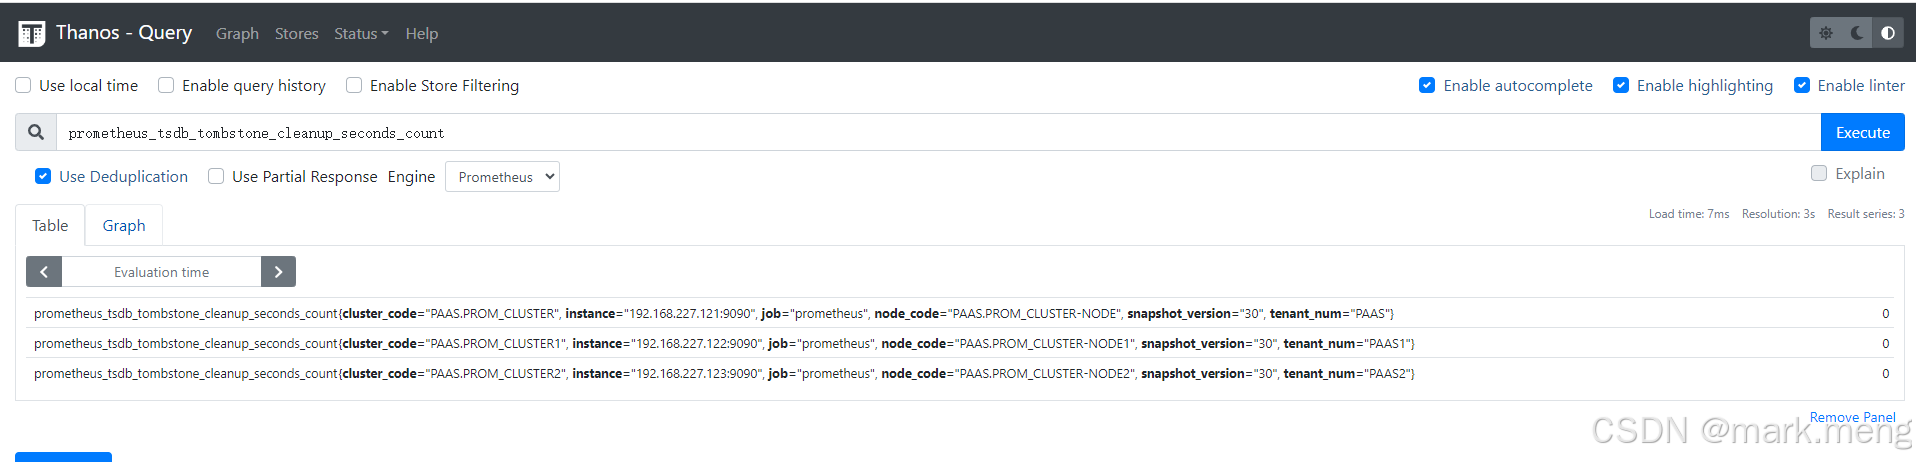
- 如果N个Prometheus抓取的数据存在重复的,那么thanos query会根据label自动去重,确保返回给grafana的数据不会重复,这个特性很关键。
三、具体架构实现
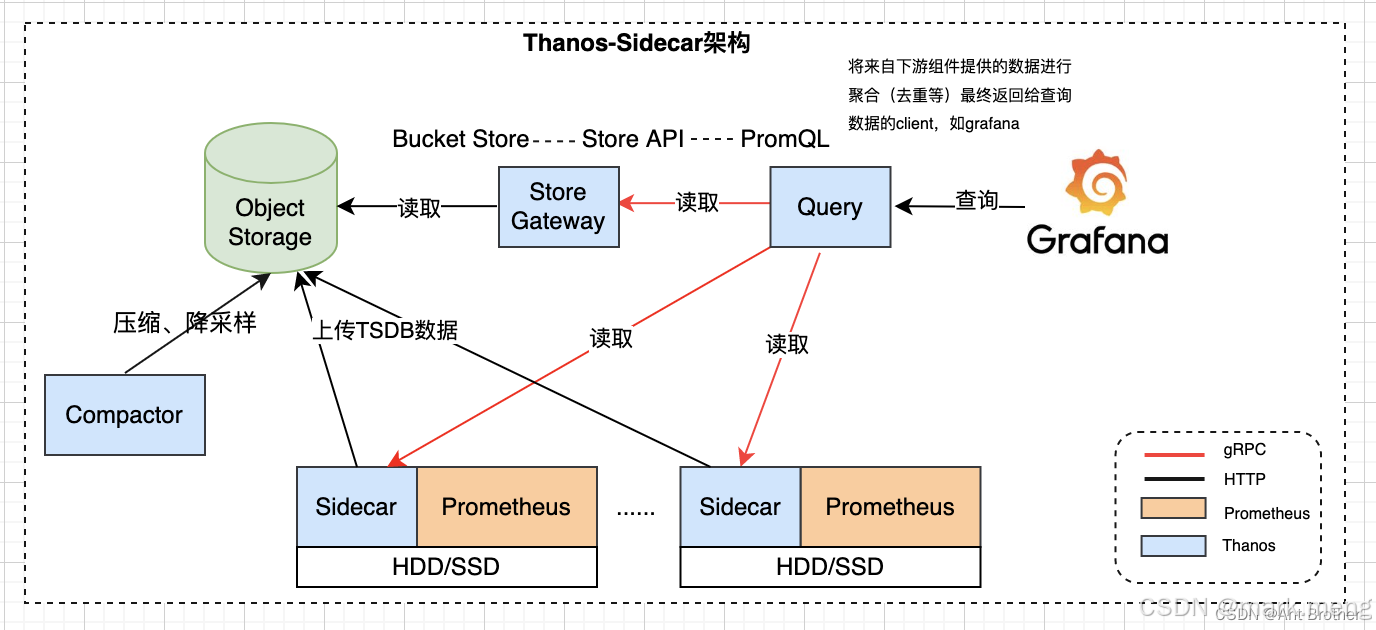
核心组件:
- Store Gateway:将云存储中的数据内容暴露出来,提供云存储到Query中转接口
- Query:实现了Prometheus API,汇聚底层组件的数据(如sidecar、store),并实现与监控面板对接(如grafana)
- Compactor:将云存储中的数据进行压缩和降采样
这套方案的工作原理如下:
Prometheus单机存储空间有限,SideCar和Prometheus在同POD内共享数据volume,然后sidecar可以自动将prometheus磁盘数据上传到Bucket里归档存储;后续Query可以通过Store组件从Bucket拉取到历史数据,这样就实现了历史数据的永久存储和查询能力。
Compactor则是对Bucket里的历史数据进行采样或者清理,有具体需求后再自行研究即可。
四、部署测试
1. 测试环境
| ip | 服务 |
|---|---|
| 192.168.227.121 | prometheus1,thanos-sidecar,minio,thanos-gateway,thanos-compact,thanos-querier,thanos-querier-frontend,thanos-redis |
| 192.168.227.122 | prometheus2,thanos-sidecar,minio |
| 192.168.227.123 | prometheus3,thanos-sidecar,minio |
| 192.168.227.124 | minio |
2.部署架构详解
- 部署三个单独的prometheus节点,负责收集本机上的prometheus metrics和thanos-sidecar metrics
- thanos-sidecar:Thanos通过该组件实现与Prometheus的集成,配置Sidecar连接Prometheus后,可读取数据给到Querier进行实时查询。另外,通过Sidecar还可以将Prometheus采集的数据上传到对象存储进行保存。
- 部署4节点的minio集群
- thanos-gateway:该组件实现与Sidercar一致的API提供给Querier进行查询,当Sidecar将数据存储到对象存储后,Prometheus会清理掉本地数据保证本地空间可用。当Querier需要调取历史数据时,则会通过Store Gateway读取对象存储中保存的数据。
- thanos-compact:主要用于对采集到的数据进行压缩和降采样,以提升对长期数据的查询效率。
- thanos-querier:该组件具有与Prometheus兼容的API并支持Prom语法,与其他组件(Sidecar或Store Gateway)一起协同工作,用于查询Prometheus的数据指标和做为Grafana的监控展示数据源。
- thanos-querier-frontend:query frontend 会将多天的的查询拆分为多个单天的查询,下游的 querier 去并行处理这些已拆分的查询。返回的查询结果由 query frontend 进行汇聚。这样可以防止大时间跨度的查询导致 queier 发生 OOM(比如查询七天,那么会并行的对七天当中每一天的数据进行查询,返回到查询前端,对这些数据聚合起来返回到前端),并且能够更快的执行查询以及更好的查询负载均衡
3. 部署过程
3.1 部署minio集群
docker-compose.yml
version: "2"

services:
  minio:
    image: minio/minio:RELEASE.2024-06-13T22-53-53Z
    network_mode: host
    volumes:
      - "/home/minio/data:/data"
      - "/home/minio/config:/root/.minio"
    environment:
      - MINIO_ACCESS_KEY=admin
      - MINIO_SECRET_KEY=xxxxxx
    ports:
      - "9000:9000"
      - "9001:9001"
    command: server --console-address ":9001" http://192.168.227.121/data http://192.168.227.122/data http://192.168.227.123/data http://192.168.227.124/data
    restart: always
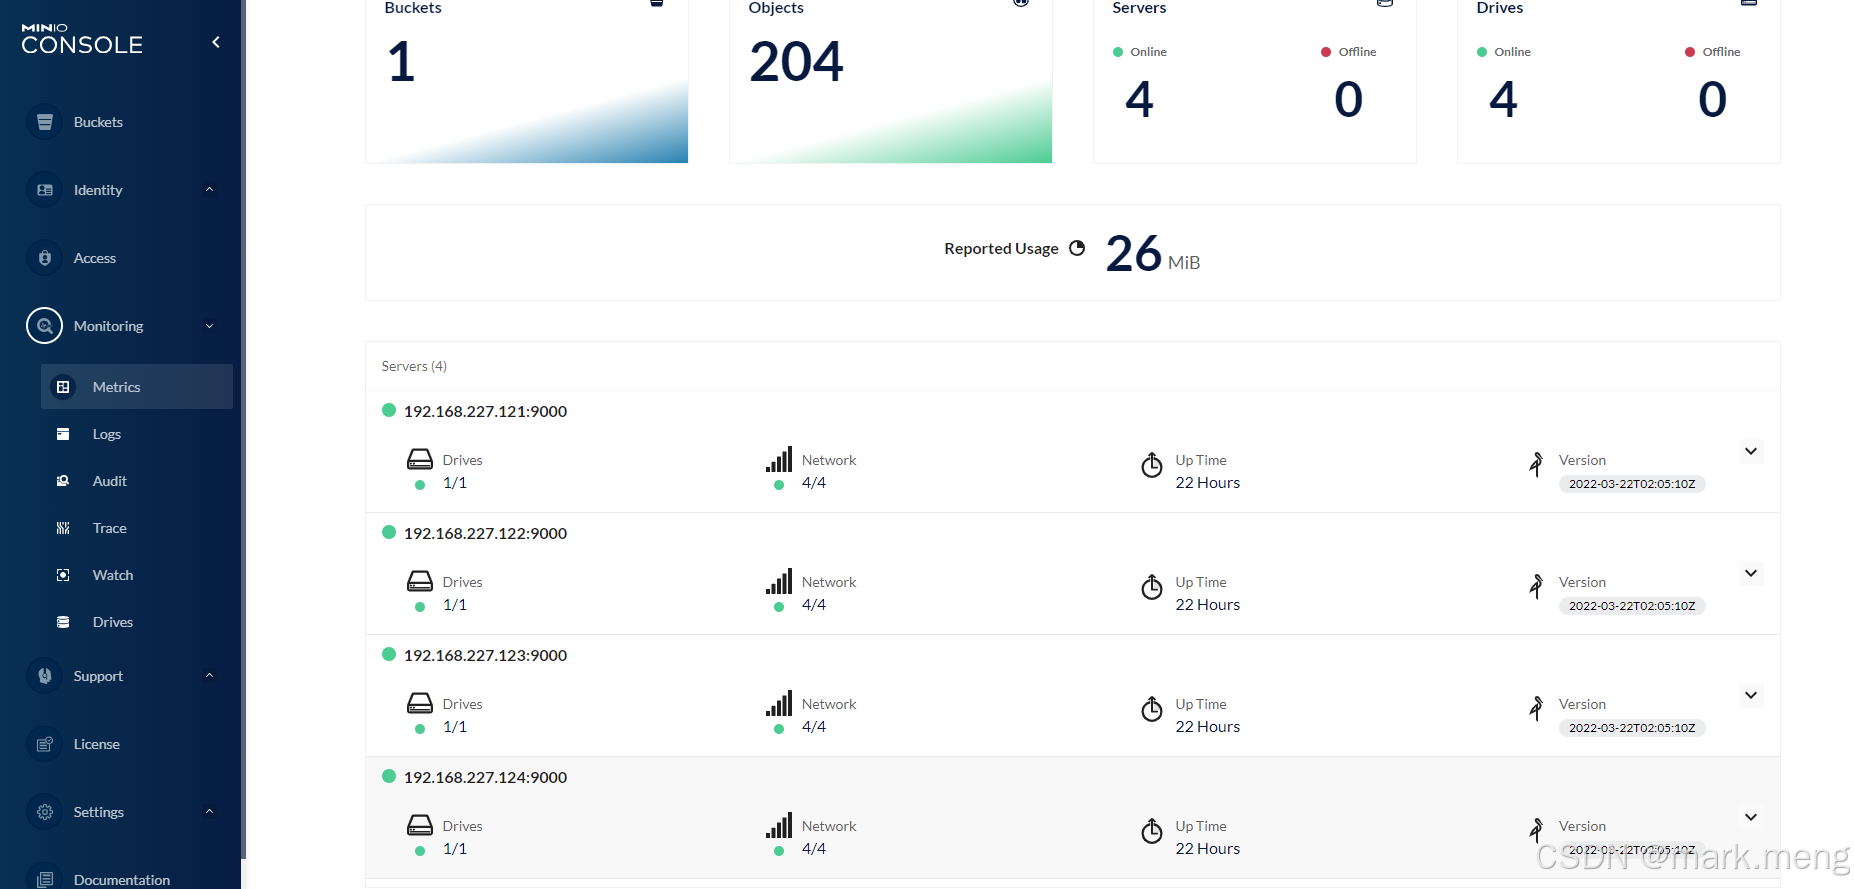
查看minio状态
3.2 prometheus+sidecar部署
docker-compose.yaml
version: '2'

services:
  prometheus:
    container_name: prometheus
    image: docker.io/bitnami/prometheus:2.44.0
    entrypoint:
      - /opt/bitnami/prometheus/bin/prometheus
      #- ls
      #- /opt/bitnami/prometheus/
    command:
      - --web.listen-address=0.0.0.0:9090
      - --storage.tsdb.path=/opt/bitnami/prometheus_data/tsdb
      - --storage.tsdb.min-block-duration=2h
      - --storage.tsdb.max-block-duration=2h
      - --config.file=/opt/bitnami/prometheus_data/conf/prometheus.yml
      - --web.enable-lifecycle
      - --storage.tsdb.retention=90d
      - --web.enable-admin-api
    ports:
      - '9090:9090'
    volumes:
      - ./prometheus_data:/opt/bitnami/prometheus_data
      - /etc/localtime:/etc/localtime:ro
      - /etc/timezone:/etc/TZ:ro
    restart: unless-stopped

  prometheus-sidecar:
    container_name: prometheus-sidecar
    image: quay.io/thanos/thanos:v0.32.4
    user: root
    command:
      - sidecar
      - --tsdb.path=/prometheus
      - --objstore.config-file=/etc/thanos/minio-bucket.yaml
      - --shipper.upload-compacted
      - --http-address=0.0.0.0:19090
      - --grpc-address=0.0.0.0:19190
      - --prometheus.url=http://192.168.227.121:9090
    ports:
      - '19090:19090'
      - '19190:19190'
    volumes:
      - ./prometheus_data/tsdb:/prometheus
      - ./thanos/config/bucket_storage.yaml:/etc/thanos/minio-bucket.yaml
      - ./thanos/config/localtime:/etc/localtime:ro
prometheus.yml
global:
  evaluation_interval: 1m
  scrape_interval: 1m
  scrape_timeout: 1m
  external_labels:
    snapshot_version: '30'
    tenant_num: PAAS
    cluster_code: PAAS.PROM_CLUSTER
    node_code: PAAS.PROM_CLUSTER-NODE


scrape_configs:
  - job_name: 'prometheus'
    static_configs:
      - targets: ['192.168.227.121:9090']
  - job_name: 'sidecar'
    static_configs:
      - targets: ['192.168.227.121:19090']
bucket_storage.yaml
type: S3
config:
  bucket: "thanos"
  endpoint: "192.168.227.121:9000"
  insecure: true
  signature_version2: true
  access_key: "admin"
  secret_key: "xxxxxx"
localtime文件需要从thanos镜像中取出Shanghai时间文件,如果宿主机文件可用可以使用宿主机的文件
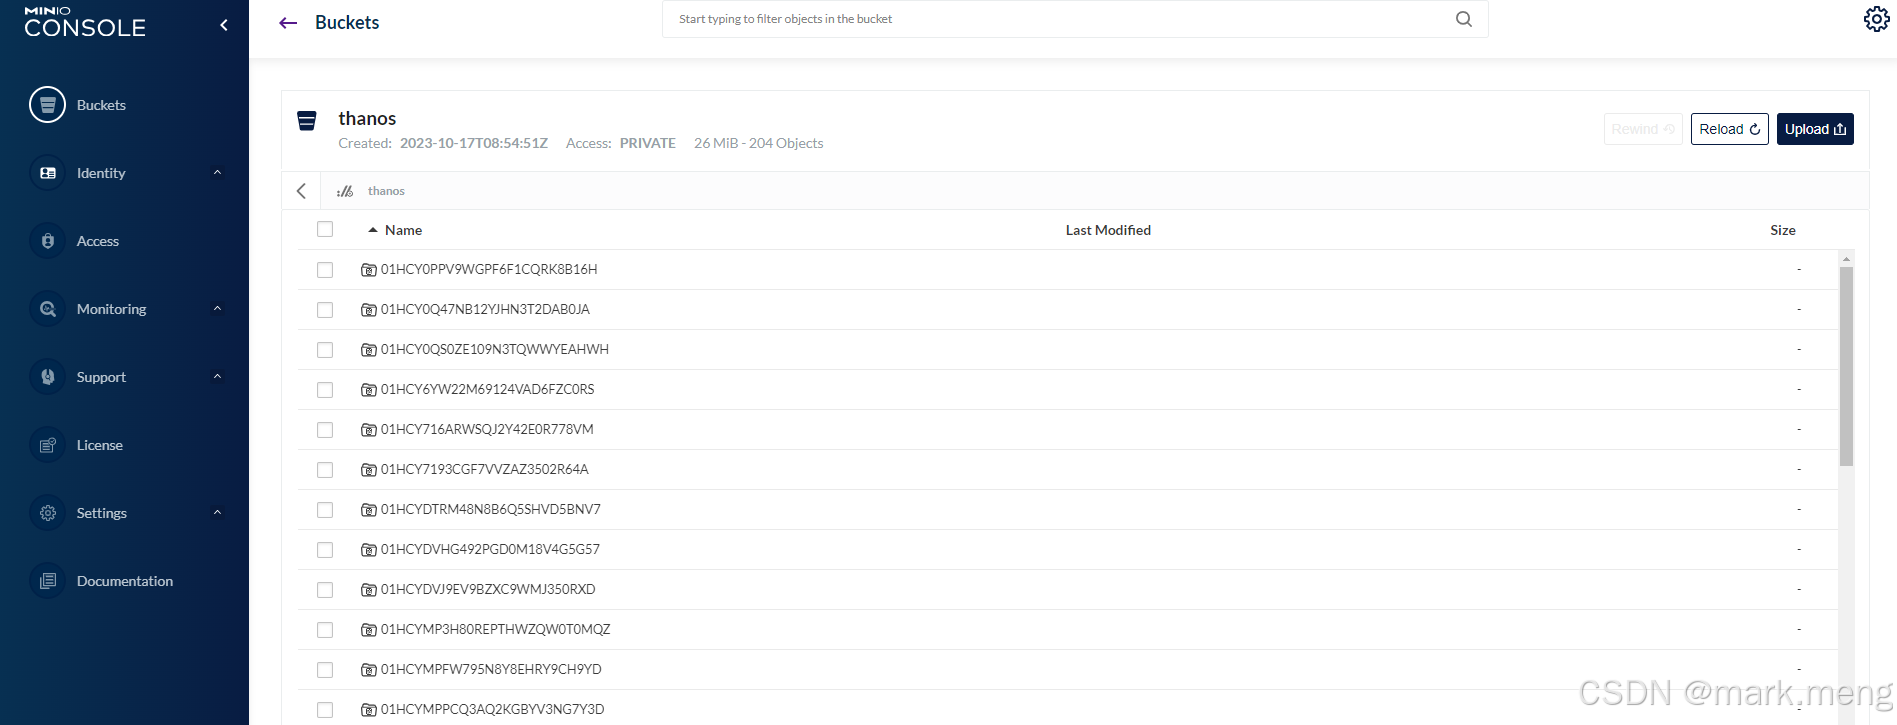
在minio中创建桶,名称为thanos
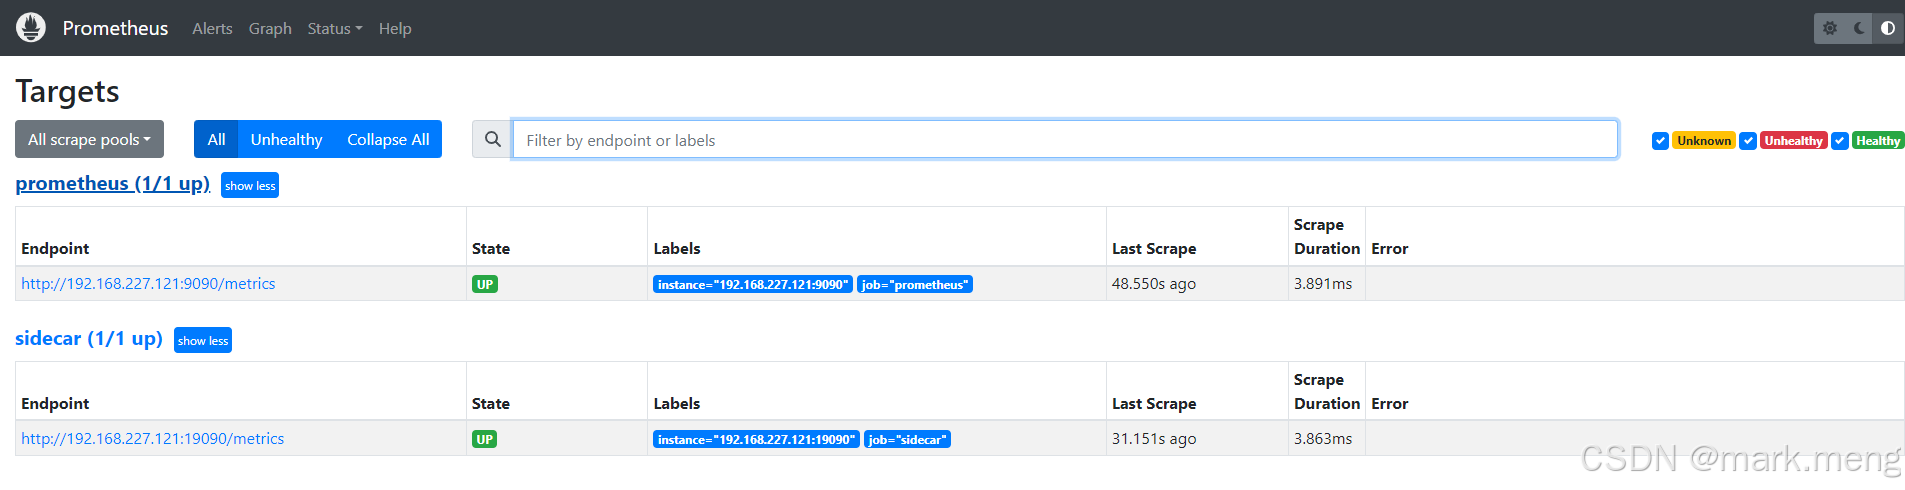
部署完成后查看prometheus状态,查看数据是否写入minio
3.3 thanos相关组件部署
docker-compose.yml
version: '2'

services:
  thanos-gateway:
    container_name: thanos-gateway
    image: quay.io/thanos/thanos:v0.32.4
    user: root
    command:
      - store
      - --http-address=0.0.0.0:29090
      - --grpc-address=0.0.0.0:29191
      - --objstore.config-file=/etc/thanos/minio-bucket.yaml
    ports:
      - '29090:29090'
      - '29191:29191'
    volumes:
      - ./config/bucket_storage.yaml:/etc/thanos/minio-bucket.yaml
      - ./config/localtime:/etc/localtime

  thanos-compact:
    container_name: thanos-compact
    image: quay.io/thanos/thanos:v0.32.4
    user: root
    command:
      - compact
      - --wait
      - --wait-interval=30s
      - --delete-delay=0
      - --retention.resolution-raw=7d
      - --retention.resolution-5m=180d
      - --retention.resolution-1h=365d
      - --block-viewer.global.sync-block-timeout=30m       - --consistency-delay=0s
      - --http-address=0.0.0.0:29290
      - --objstore.config-file=/etc/thanos/minio-bucket.yaml
    ports:
      - '29290:29290'
    volumes:
      - ./config/bucket_storage.yaml:/etc/thanos/minio-bucket.yaml
      - ./config/localtime:/etc/localtime


  thanos-querier:
    container_name: thanos-querier
    image: quay.io/thanos/thanos:v0.32.4
    user: root
    command:
      - query
      - --http-address=0.0.0.0:39090
      - --query.replica-label=replica
      - --store=192.168.227.121:29191
      - --store=192.168.227.121:19190
      - --store=192.168.227.122:19190
      - --store=192.168.227.123:19190
    ports:
      - '39090:39090'
    volumes:
      - ./config/localtime:/etc/localtime

  thanos-querier-frontend:
    container_name: thanos-querier-frontend
    image: quay.io/thanos/thanos:v0.32.4
    user: root
    command:
      - query-frontend
      - --log.level=info
      - --log.format=logfmt
      - --query-frontend.compress-responses
      - --http-address=0.0.0.0:39092
      - --query-frontend.downstream-url=http://192.168.227.121:39090
      - --query-range.split-interval=12h
      - --query-range.max-retries-per-request=10
      - --query-frontend.log-queries-longer-than=10s
      - --labels.split-interval=12h
      - --labels.max-retries-per-request=10
      - --query-range.response-cache-config-file=/etc/thanos/query-frontend-cache.yaml
      - --labels.response-cache-config-file=/etc/thanos/query-frontend-cache.yaml
    ports:
      - '39092:39092'
    volumes:
      - ./config/localtime:/etc/localtime
      - ./config/query-frontend-cache.yaml:/etc/thanos/query-frontend-cache.yaml


  thanos-redis:
    container_name: thanos-redis
    image: 'bitnami/redis:latest'
    volumes:
      - ./redis_data:/bitnami/redis/data
      - /etc/localtime:/etc/localtime:ro
      - /etc/timezone:/etc/TZ:ro
    environment:
      - REDIS_PASSWORD=xxxxxx
    ports:
      - '36379:6379'
    restart: unless-stopped
bucket_storage.yaml
type: S3
config:
  bucket: "thanos"
  endpoint: "192.168.227.121:9000"
  insecure: true
  signature_version2: true
  access_key: "admin"
  secret_key: "xxxxxx"
query-frontend-cache.yaml
type: REDIS
config:
  addr: "192.168.227.121:36379"
  username: ""
  password: "xxxxxx"
  db: 0
  dial_timeout: 5s
  read_timeout: 3s
  write_timeout: 3s
  max_get_multi_concurrency: 100
  get_multi_batch_size: 100
  max_set_multi_concurrency: 100
  set_multi_batch_size: 100
  expiration: 24h0m0s
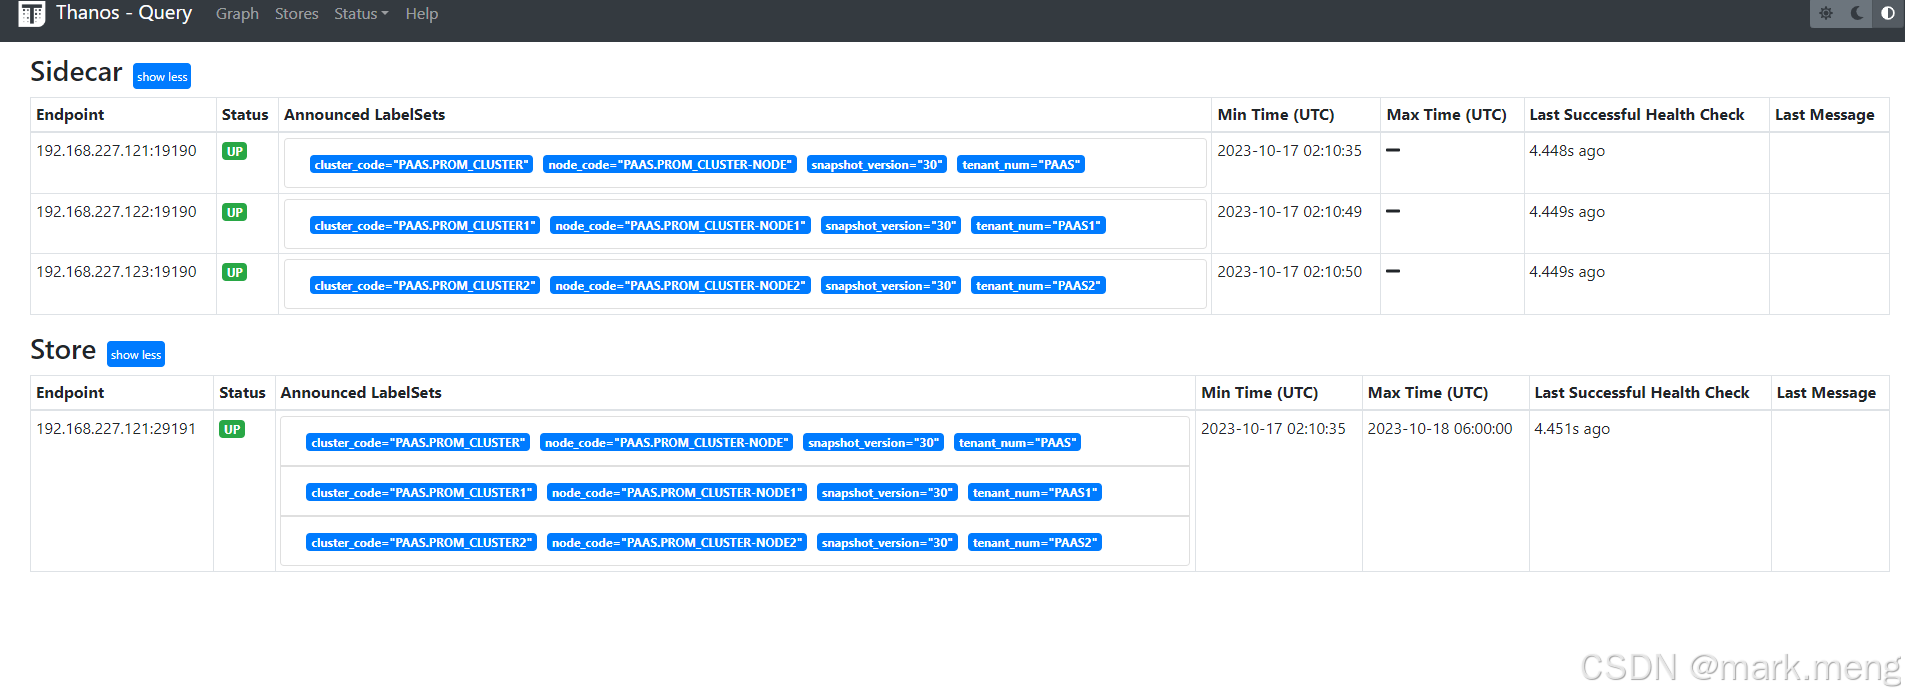
部署完成后查看thanos状态


 2331
2331

 被折叠的 条评论
为什么被折叠?
被折叠的 条评论
为什么被折叠?
 到【灌水乐园】发言


