


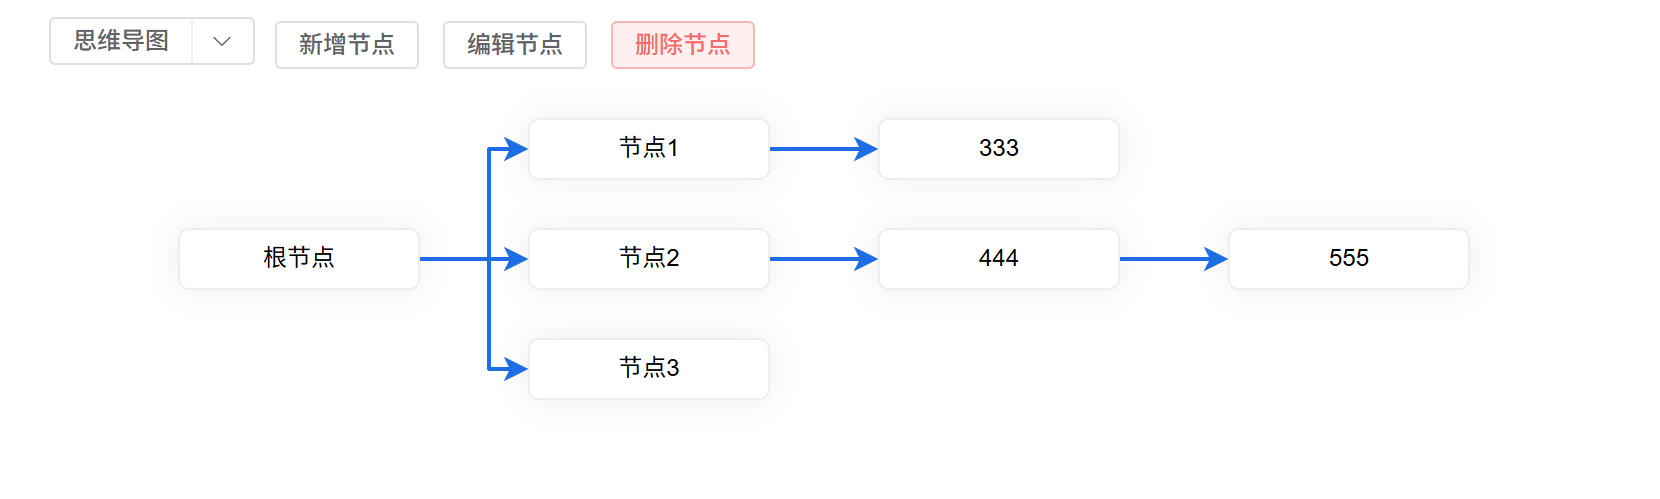
项目需要实现如下效果图表,功能包括节点排序、新增节点、编辑节点、删除节点、选中节点等
思维导图:
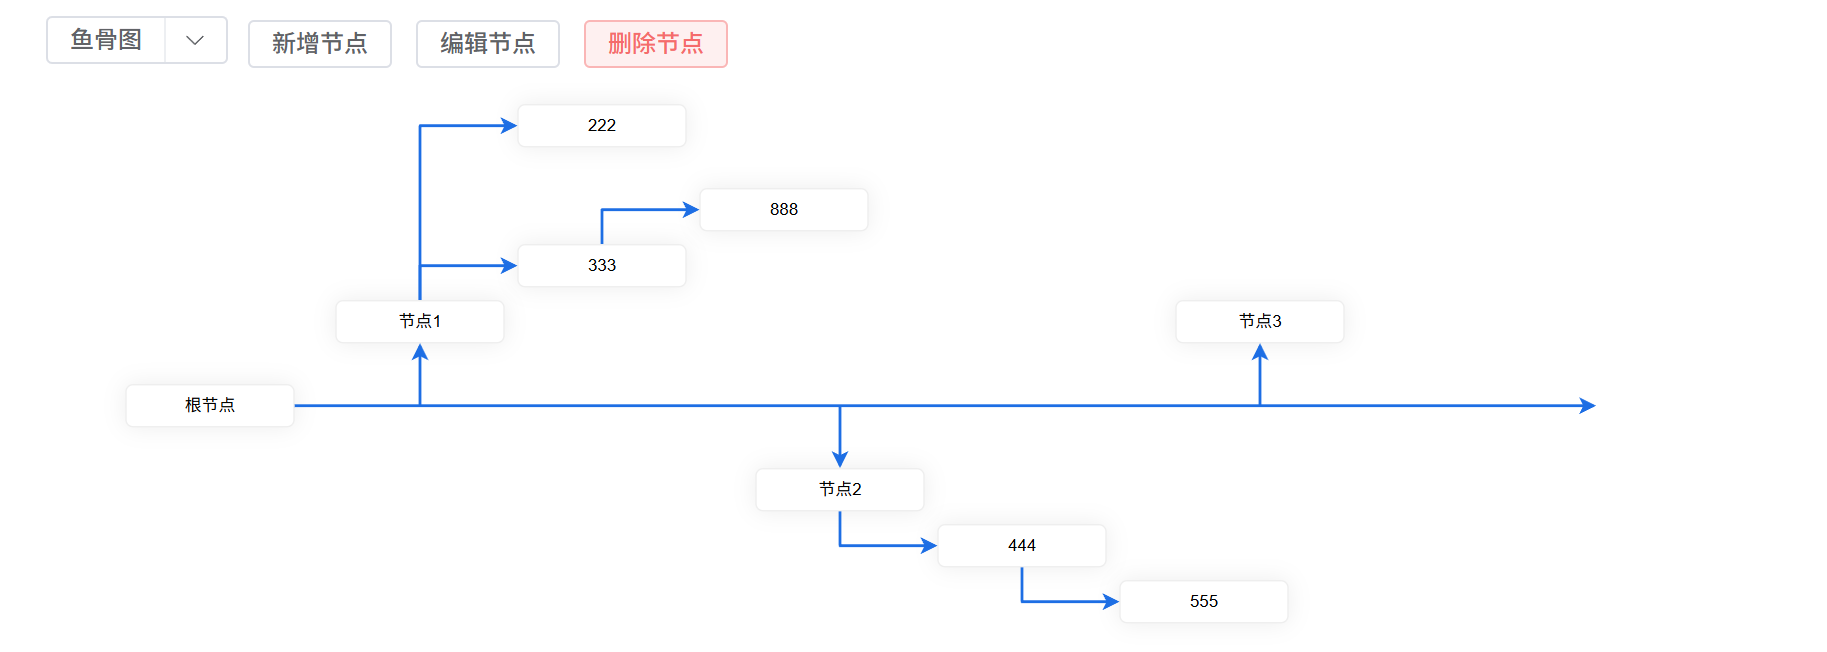
鱼骨图:
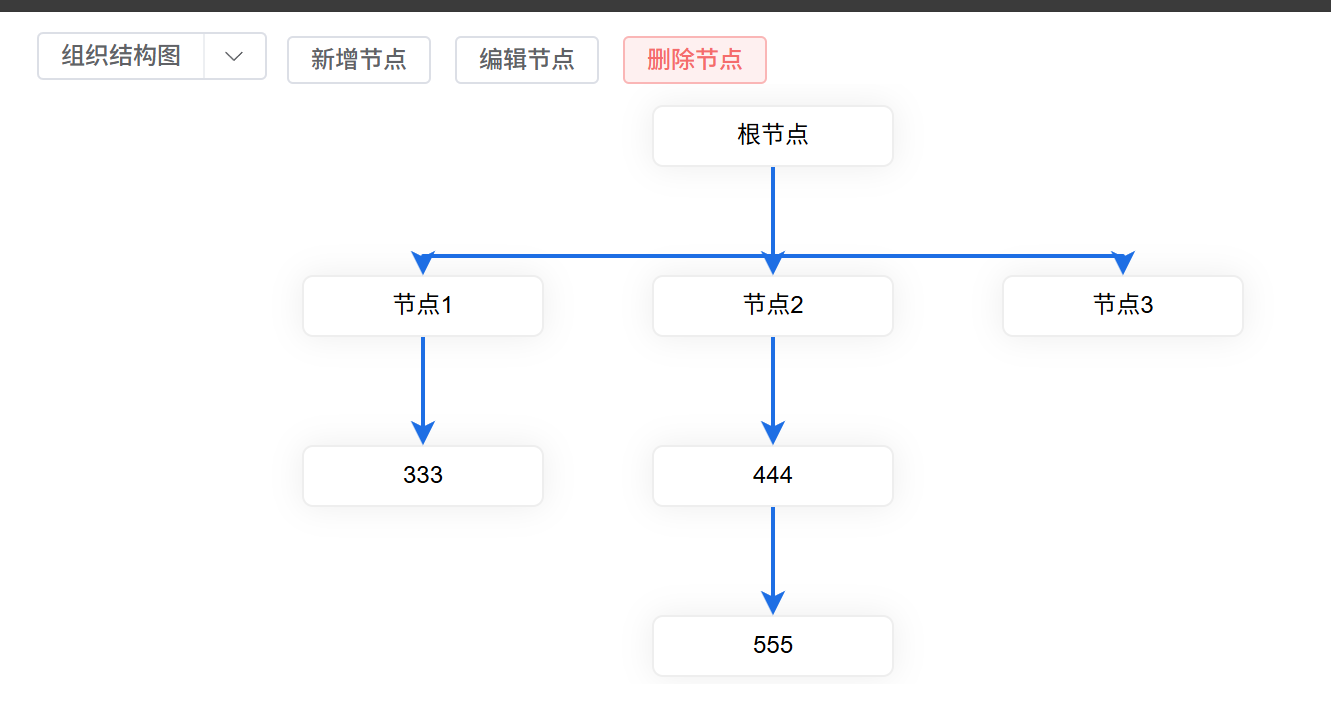
组织结构图:
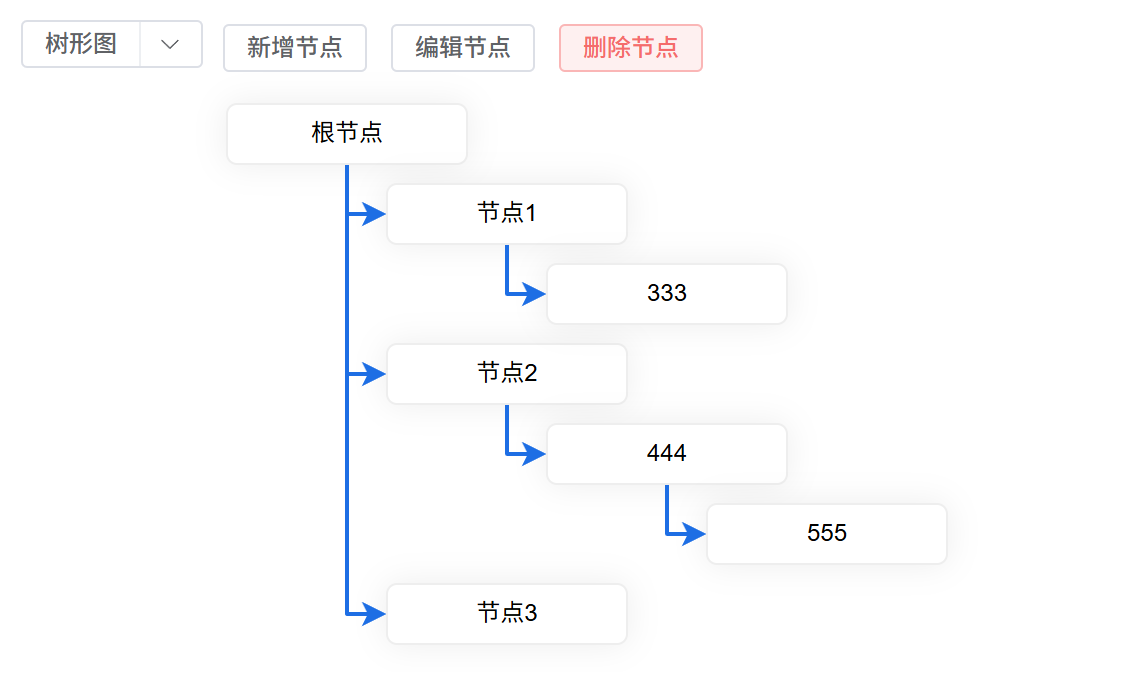
树图:
html部分如下:
<template>
  <div class="MindMapContent">
    <el-dropdown split-button size="small" style="margin-right: 10px" @command="handleCommand">
      {{ mindTypeText }}
      <template #dropdown>
        <el-dropdown-menu>
          <el-dropdown-item command="mindMap">思维导图</el-dropdown-item>
          <el-dropdown-item command="ishikawa">鱼骨图</el-dropdown-item>
          <el-dropdown-item command="organize">组织结构图</el-dropdown-item>
          <el-dropdown-item command="tree">树形图</el-dropdown-item>
        </el-dropdown-menu>
      </template>
    </el-dropdown>
    <el-button size="small" @click="addNode">新增节点</el-button>
    <el-button size="small" @click="updateNode">编辑节点</el-button>
    <el-button size="small" type="danger" plain @click="removeNode">删除节点</el-button>
    <div id="mindContent" style="height: 300px">
      <div id="container"></div>
    </div>

    <el-dialog v-model="visible" :title="pageType == 'edit' ? '编辑' : '新增'">
      <div>
        <el-form class="search-form" ref="formData" size="small" label-width="120px" :model="formData">
          <el-form-item label="节点名称" prop="label" :rules="[{required: true, message: '请输入节点名称',trigger: 'blur'}]">
            <el-input v-model="formData.label" style="width: 60%"></el-input>
          </el-form-item>
        </el-form>
      </div>
      <span slot="footer" class="dialog-footer">
          <el-button @click="cancelDialog">返回</el-button>
          <el-button type="primary" @click="submitData">提交</el-button>
      </span>
    </el-dialog>
  </div>
</template>
定义数据如下:
  data(){
    return{
      graph: null, // 画布实例对象
      objData:{},  //
      visible: false,
      pageType: '',   //弹窗的类型,编辑、新增
      formData: {},  //当前节点
      dagreLayout: null,   //思维导图布局
      organizeLayout: null,   //组织结构布局
      mindType: 'mindMap',   //图标类型
      nowData: {},         //点击选中的数据
    }
  },
  computed: {
    mindTypeText(){
      let map = {
        mindMap: '思维导图',
        ishikawa: '鱼骨图',
        organize: '组织结构图',
        tree: '树形图'
      }
      return map[this.mindType]
    }
  },
需要后端返回的数据格式如下:
mindData: {
    edgeList: [
        {source: '50',target: '54'},
        {source: '50',target: '61'},
        {source: '54',target: '66'},
        {source: '61',target: '67'},
        {source: '67',target: '69'},
        {source: '50',target: '71'},
    ],
    nodeList: [
        {id: '50', label: '根节点', fjdId: null},
        {id: '54', label: '节点1', fjdId: '50'},
        {id: '61', label: '节点2', fjdId: '50' },
        {id: '71', label: '节点3', fjdId: '50'},
        {id: '66', label: '333', fjdId: '54'},
        {id: '67', label: '444', fjdId: '61'},
        {id: '69', label: '555', fjdId: '67'}
     ]
}
获取后端返回数据后, 需要为节点和边设置样式,所以需要对数据进行处理。x6图最好只加载一次,后续再进行操作时只需要更新数据即可。因为在项目中可以为某个节点绑定其它属性id,绑定后仍保持选中状态,所以设置selectNodeId,当有selectNodeId时,需要选中node.id为selectNodeId的节点
    //获取节点数据
    getNodeData(bool,selectNodeId){
        this.objData.nodes = (this.mindData.nodeList || []).map(item => {
          return {
            id: item.id, // String,可选,节点的唯一标识
            width: 120,   // Number,可选,节点大小的 width 值
            height: 30,  // Number,可选,节点大小的 height 值
            label: item.label, // String,节点标签
            fjdId: item.fjdId,
            data: {
              portalId: item.portalId || '',
            },
            attrs: {
              body: {
                stroke: 'rgba(238, 238, 238, 1)',
                strokeWidth: 1,
                rx: 5,
                ry: 5,
                style: {
                  filter: 'drop-shadow(0px 0px 8px rgba(0,0,0,0.07))'
                }
              },
              label: {
                fontSize: 12,
                textWrap: {
                  ellipsis: true,
                  width: 105
                }
              }
            }
          }
        })
        this.objData.edges = this.mindData.edgeList || []
        //初始化加载mind,更新数据时不初始化mind
        if(bool){
          this.initGraph()
        }else {
          this.graph.cleanSelection()
          this.nowData = {}
          //更新节点信息后重新布局
          let gridLayout = new DagreLayout({
            type: 'dagre',
            rankdir: 'LR',
            align: undefined,
            ranksep: 45,
            nodesep: 5,
          })

          this.graph.fromJSON(gridLayout.layout(this.objData))

          //如果有selectNodeId,则选中node.id为selectNodeId的节点
          if (selectNodeId) {
            const node = this.graph.getCellById(selectNodeId)
            if (node) {
              this.graph.resetSelection(node)
              this.nowData = {
                id: node.id,
                label: node.label,
                portalId: node.data.portalId || ''
              }
              //返回选中的数据
              this.$emit('getData', this.nowData)
            }
          }
        }
    },
初始化画布
    // 初始化流程图画布
    initGraph() {
      let container = document.getElementById('container')
      this.graph = null
      this.graph = new Graph({
        container,
        width: '100%',
        height: '100%',
        //最大最小缩放比例
        scaling: {
          min: 0.7,
          max: 1.2
        },
        autoResize: true,
        panning: true,
        mousewheel: true,
        background: {
          color: '#ffffff', // 设置画布背景颜色
        },
      })

      this.dagreLayout = new DagreLayout({
        type: 'dagre',
        rankdir: 'LR',
        align: undefined,
        ranksep: 45,
        nodesep: 5,
      })
      this.organizeLayout = new DagreLayout({
        type: 'dagre',
        rankdir: 'TB',
        align: undefined,
        ranksep: 15,
        nodesep: 45,
      })

      //数据上图
      // this.graph.fromJSON(this.dagreLayout.layout(this.objData))
      this.handleCommand('mindMap')

      //使用x6选中插件
      this.graph.use(
          new Selection({
            enabled: true,
            multiple: false,
            movable: false,
            rubberband: false,
            showNodeSelectionBox: true,
            clearSelectionOnBlank: false
          })
      )

      //节点点击选中
      this.graph.on('node:click', ({ e,node }) => {
        e.stopPropagation()
        tooltip.style.display = 'none'
        this.graph.resetSelection(node)
        this.nowData = {
          id: node.id,
          label: node.label,
          portalId: node.data.portalId || ''
        }
        this.$emit('getData',this.nowData)
      })
      //点击节点外清空点击数据
      this.graph.on('blank:click', ({ e,node }) => {
        this.graph.cleanSelection()
        this.nowData = {}
      })

      //node节点有宽度限制,label超过宽度时显示...,但是需要tooltip显示完整的label
      const tooltip = document.createElement('div')
      tooltip.className = 'x6-tooltip'
      tooltip.style.position = "absolute"
      tooltip.style.display = 'none'
      tooltip.style.padding = '6px'
      tooltip.style.borderRadius = '5px'
      tooltip.style.backgroundColor = '#303133'
      tooltip.style.color = '#ffffff'
      tooltip.style.fontSize = '12px'
      let mindContent = document.getElementById('mindContent')
      mindContent.appendChild(tooltip)
      this.graph.on('node:mouseenter', ({ node }) => {
        if(node.label){
          const position = this.graph.localToGraph(node.getBBox().getCenter())
          tooltip.style.display = 'block'
          tooltip.style.left = `${position.x - 60}px`
          tooltip.style.top = `${position.y - 50}px`
          tooltip.textContent = node.label
        }
      })
      this.graph.on('node:mouseleave', ({ node }) => {
        tooltip.style.display = 'none'
      })
    },
节点操作
    //删除节点
    removeNode(){
      if(!this.nowData.id){
        this.$message.error('请选择需要删除的节点')
      }else{
        this.mindData.nodeList = this.mindData.nodeList.filter(item => item.id != this.nowData.id)
        this.mindData.edgeList = this.mindData.edgeList.filter(item => item.target != this.nowData.id)
        this.getNodeData(false)
      }
    },
    //新增节点
    addNode(){
      this.formData = {}
      this.pageType = 'add'
      if (this.objData.nodes.length == 0){
        this.visible = true
      } else{
        if(!this.nowData.id){
          this.$message.error('请选择父节点')
        }else{
          this.visible = true
        }
      }
    },
    //编辑节点
    updateNode(){
      this.formData = {}
      this.pageType = 'edit'
      if(!this.nowData.id){
        this.$message.error('请选择编辑的节点')
      }else{
        this.formData = this.nowData
        this.visible = true
      }
    },
新增节点和编辑节点弹窗操作
    //cancelDialog
    cancelDialog(){
      this.visible = false
    },
    submitData(){
      // 新增的时候,formData就是新增本身,nowData就是父节点
      // 编辑的时候,获取到nowData,赋值给formData
      this.$refs.formData.validate(valid => {
        if(valid){
          if (this.pageType == 'edit'){
            let obj = this.mindData.nodeList.find(item => item.id == this.formData.id)
            obj.label = this.formData.label
            this.visible = false
            this.getNodeData(false)
          }else{
            let id = Math.random().toString(36).substring(2, 4)
            this.mindData.nodeList.push({
              id, label: this.formData.label,
            })
            this.mindData.edgeList.push({
              target: id, source: this.nowData.id,
            })
            this.visible = false
            this.getNodeData(false)
          }
        }
      })
    },
涉及的样式
<style scoped>
.MindMapContent{
  padding: 10px 25px;
  height: 700px;
  background-color: #ffffff;
}
#mindContent{
  position: relative;
}
</style>
数据上图
根据下拉菜单选中的图表类型展示不同布局的图表,先清空图表的元素,然后根据mindType选择不同的布局样式:
    //修改图类型
    handleCommand(e){
      this.mindType = e
      if(this.graph){
        this.graph.clearCells()
      }
      setTimeout(() => {
        let attrs = {
          line: {
            stroke: '#1d6ee4'
          }
        }
        if(this.mindType == 'mindMap'){
          this.objData.edges = (this.objData.edges || []).map(item => {
            return{
              source: item.source, // String,必须,起始节点 id
              target: item.target, // String,必须,目标节点 id
              router: {
                name: 'manhattan',
                args: {
                  startDirections: ['right'],
                  endDirections: ['left']
                }
              },
              attrs
            }
          })
          this.graph.fromJSON(this.dagreLayout.layout(this.objData))
        }
        if(this.mindType == 'organize'){
          this.objData.edges = (this.objData.edges || []).map(item => {
            return{
              source: item.source, // String,必须,起始节点 id
              target: item.target, // String,必须,目标节点 id
              router: {
                name: 'manhattan',
                args: {
                  startDirections: ['bottom'],
                  endDirections: ['top']
                }
              },
              attrs
            }
          })
          this.graph.fromJSON(this.organizeLayout.layout(this.objData))
        }
      },1000)
    },
鱼骨图
在 handleCommand 方法体里面添加代码(根据根节点计算根节点下子节点坐标,然后使用递归逐级绘制该子节点下的所有层级节点):
        if(this.mindType == 'ishikawa'){
          let data = JSON.parse(JSON.stringify(this.objData))
          console.log('data',data);
          data.edges = []
          //根节点的坐标为[100,100],根节点下第一个子节点为根节点x坐标偏移150
          let fristX = 100 + 150
          let fristY = 100
          let fristId = ''
          //根节点信息
          data.nodes[0].x = 100
          data.nodes[0].y = 100
          fristId = data.nodes[0].id

          let isTop = true
          data.nodes.forEach((item, index) => {
            //计算根节点下子节点坐标
            if(item.fjdId == fristId){
              item.x = fristX
              data.edges.push({
                source: {x: item.x + 60, y: fristY + 15},
                target: item.id,
                attrs
              })
              if(isTop){
                item.y = fristY - 60
              }else{
                item.y = fristY + 60
              }
              //递归展示当前节点下的所有节点
              this.buildFish(data,item,isTop)
              //根据上一个子节点的深度,计算子节点所有层级的宽度,下一个子节点在此基础上计算x坐标
              let nodeWidth = ((this.getNodeDepth(item,data) || 1) * 150)
              fristX += nodeWidth
              isTop = !isTop
            }
          })
          data.edges.push({
            source: fristId,
            target: {x: fristX + 150, y: fristY + 15 },
            attrs
          })
          this.graph.fromJSON(data)
        }
递归展示当前节点下的所有 节点(使用递归计算当前节点下的节点个数,算出当前节点的高度,当前节点的平级节点的高度便在此基础上偏移)
    buildFish(data,item,isTop){
      let nodes = data.nodes
      let edges = data.edges
      let secendX = item.x
      let secendY = item.y
      nodes.filter(_item => _item.fjdId == item.id).forEach(e => {
        // let childNum = nodes.filter(child => child.fjdId == e.id).length + 1
        //使用递归计算当前节点下的节点个数,算出当前节点的高度,当前节点的平级节点的高度便在此基础上偏移
        let childNum = this.getNodeNum(e, data) + 1
        let args = {}
        if(isTop){
          e.x = secendX + 130
          e.y = secendY - 40
          args = {
            startDirections: ['top'],
            endDirections: ['left']
          }
          secendY -= (50 * childNum)
        }else{
          e.x = secendX + 130
          e.y = secendY + 40
          args = {
            startDirections: ['bottom'],
            endDirections: ['left']
          }
          secendY += (50 * childNum)
        }
        edges.push({
          source: item.id,
          target: e.id,
          router: {
            name: 'manhattan',
            args,
          },
          attrs: {
            line: {
              stroke: '#1d6ee4'
            }
          }
        })
        this.buildFish(data,e,isTop)
      })
    },
获取节点下所有节点的个数
    //获取节点下的节点个数
    getNodeNum(item,data){
      const childNode = data.nodes.filter(node => node.fjdId == item.id)
      if(childNode.length == 0) return 0
      let maxNum = childNode.length
      childNode.forEach(e => {
        maxNum += this.getNodeNum(e,data)
      })
      return maxNum
    },
获取节点的深度
    //获取节点深度
    getNodeDepth(item,data, currentDepth = 0){
      const childNode = data.nodes.filter(node => node.fjdId == item.id)
      if(childNode.length == 0) return currentDepth
      let maxDepth = currentDepth
      childNode.forEach(e => {
        const depth = this.getNodeDepth(e, data, currentDepth + 1)
        if(depth > maxDepth) maxDepth = depth
      })
      return maxDepth
    },
树形图
在 handleCommand 方法体里面添加代码(根据根节点计算根节点下子节点坐标,然后使用递归逐级绘制该子节点下的所有层级节点
          if(this.mindType == 'tree'){
              let data = JSON.parse(JSON.stringify(this.objData))
              console.log('data',data);
              data.edges = []
              //根节点信息
              let fristX = 100
              let fristY = 100 + 40
              let fristId = ''
              data.nodes[0].x = 100
              data.nodes[0].y = 100
              fristId = data.nodes[0].id

              data.nodes.forEach((item, index) => {
                  if(item.fjdId == fristId){
                      item.x = fristX + 80
                      item.y = fristY
                      data.edges.push({
                          source: fristId,
                          target: item.id,
                          router: {
                              name: 'manhattan',
                              args: {
                                  startDirections: ['bottom'],
                                  endDirections: ['left']
                              }
                          },
                          attrs
                      })
                      this.buildTree(data,item)
                      let nodeHeight = ((this.getNodeNum(item,data) + 1) * 40)
                      fristY += nodeHeight
                  }
              })
              this.graph.fromJSON(data)
          }
//计算二级后所有节点的位置(树图)
    //计算二级后所有节点的位置(树图)
    buildTree(data,item){
      let nodes = data.nodes
      let edges = data.edges
      let secendX = item.x
      let secendY = item.y
      nodes.filter(_item => _item.fjdId == item.id).forEach(e => {
        let childNum = this.getNodeNum(e, data)
        e.x = secendX + 80
        e.y = secendY + 40
        secendY += (childNum + 1) * 40

        edges.push({
          source: item.id,
          target: e.id,
          router: {
            name: 'manhattan',
            args: {
              startDirections: ['bottom'],
              endDirections: ['left']
            }
          },
          attrs: {
            line: {
              stroke: '#1d6ee4'
            }
          }
        })
        this.buildTree(data,e)
      })
    },


 被折叠的 条评论
为什么被折叠?
被折叠的 条评论
为什么被折叠?
 到【灌水乐园】发言


