


iprofiler是一个命令行工具,与Instruments的作用相同,可以用来采集app数据,采集的数据放在.dtps的文件里,并能用Instruments打开。iprofiler现支持下列功能:Activity Monitor、Allocations、Counters、Event Profiler、Leaks、System Trace、Time Profiler。
下面列出几个iprofiler的简单用法示例,以后知道它们具体怎么用的时候再进行补充:
$iprofiler -timeprofiler -activitymonitor
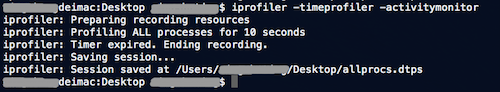
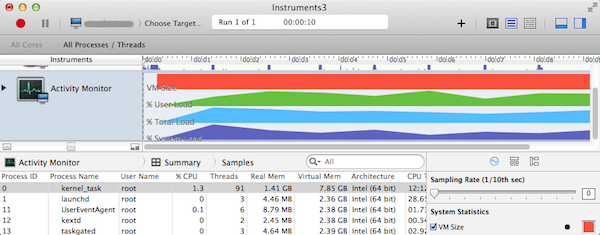
引用原文的说明:This example collects data from all running processes for the current sampling duration set in Instruments using the Time Profiler and Activity Monitor instruments. 该命令会在当前目录下产生allprocs.dtps文件,在Instruments中打开该文件如下图。
$iprofiler -T 8s -d /temp -o YourApp_perf -timeprofiler -a YourApp
-T表示要收集多长时间以内的数据,-d表示产生的文件存在哪个目录里,-o表示产生的文件的名字,-a表示你要收集信息的app名称
上面的命令就表示用Time Profiler对名称为YourApp的app采集8s时间的信息,产生的文件存在/temp/YourApp_perf.dtps。
$iprofiler -T 2500ms -o YourApp_perf -leaks -activitymonitor -a 823
该命令表示用Leaks和Activity Monitor对进程ID为823的进程采集2.5s的信息,产生的文件为当前目录下的YourApp_perf.dtps。(823是怎么获得的?)
$iprofiler -d /tmp -timeprofiler -allocations -a YourApp.app
该命令表示用Time Profiler和Allocations对YourApp.app采集信息,时间为默认时间(默认时间是多少?10s?),产生的文件存在/temp/allprocs.dtps。
$iprofiler -T 15 -I 1000ms -window 2s -o YourApp_perf -timeprofiler -systemtrace /path/to/Your.app arg1
-I表示记录数据的间隔时间
该命令表示用Time Profiler和System Trace采集/path/to/路径下的Your.app,并带有arg1参数,采集时间为15s,但是只保存最后2s的数据,产生的文件存在当前目录下的YourApp_perf.dtps。
官方文档里iprofiler提供的配置参数如下:
|
Command |
Description |
|
|
 最低0.47元/天 解锁文章


 被折叠的 条评论
为什么被折叠?
被折叠的 条评论
为什么被折叠?
 到【灌水乐园】发言


