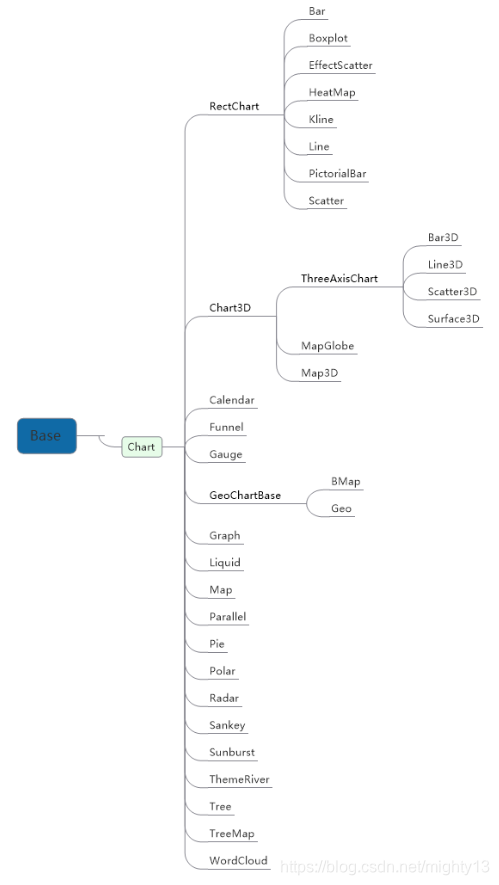
当前pyecharts的版本为1.9.0。
pyecharts/charts/chart.py模块结构
pyecharts/charts/chart.py模块主要元素为4个类:
Chart类:除复合图表之外所有常用图表类的基类,它的父类为Base类。RectChart类:直角坐标系图表类的基类,父类为Chart类。Chart3D类:3D图表类的基类,父类为Chart类。ThreeAxisChart类:三维坐标系图表基类,父类为Chart3D类。
pyecharts常用图表类的继承关系

Chart类
Chart类是除复合图表之外所有常用图表类的基类,它的父类为Base类。
Chart类的签名为class Chart(init_opts)。Chart类的参数主要继承自Base类。Chart类的方法如下:
set_global_opts:设置全局配置。set_series_opts:设置系列配置。add_dataset:添加数据集配置。set_colors:设置颜色集。
这些方法的原理相似,都是将接收的参数更新到options属性中(ECharts配置项)。
Chart类源码
class Chart(Base):
    def __init__(self, init_opts: types.Init = opts.InitOpts()):
        if isinstance(init_opts, dict):
            temp_opts = opts.InitOpts()
            temp_opts.update(**init_opts)
            init_opts = temp_opts
        super().__init__(init_opts=init_opts)
        self.colors = (
            "#c23531 #2f4554 #61a0a8 #d48265 #749f83 #ca8622 #bda29a #6e7074 "
            "#546570 #c4ccd3 #f05b72 #ef5b9c #f47920 #905a3d #fab27b #2a5caa "
            "#444693 #726930 #b2d235 #6d8346 #ac6767 #1d953f #6950a1 #918597"
        ).split()
        if init_opts.opts.get("theme") == ThemeType.WHITE:
            self.options.update(color=self.colors)
        self.options.update(
            series=[],
            legend=[{"data": [], "selected": dict()}],
            tooltip=opts.TooltipOpts().opts,
        )
        self._chart_type: Optional[str] = None

    def set_colors(self, colors: Sequence[str]):
        self.options.update(color=colors)
        return self

    def set_series_opts(
        self,
        label_opts: types.Label = None,
        linestyle_opts: types.LineStyle = None,
        splitline_opts: types.SplitLine = None,
        areastyle_opts: types.AreaStyle = None,
        axisline_opts: types.AxisLine = None,
        markpoint_opts: types.MarkPoint = None,
        markline_opts: types.MarkLine = None,
        markarea_opts: types.MarkArea = None,
        effect_opts: types.Effect = opts.EffectOpts(),
        tooltip_opts: types.Tooltip = None,
        itemstyle_opts: types.ItemStyle = None,
        **kwargs,
    ):
        for s in self.options.get("series"):
            if label_opts:
                s.update(label=label_opts)

            if linestyle_opts:
                s.update(lineStyle=linestyle_opts)

            if splitline_opts:
                s.update(splitLine=splitline_opts)

            if areastyle_opts:
                s.update(areaStyle=areastyle_opts)

            if axisline_opts:
                s.update(axisLine=axisline_opts)

            if markpoint_opts:
                s.update(markPoint=markpoint_opts)

            if markline_opts:
                s.update(markLine=markline_opts)

            if markarea_opts:
                s.update(markArea=markarea_opts)

            if effect_opts:
                s.update(rippleEffect=effect_opts)

            if tooltip_opts:
                s.update(tooltip=tooltip_opts)

            if itemstyle_opts:
                s.update(itemStyle=itemstyle_opts)

            if len(kwargs) > 0:
                s.update(kwargs)

        return self

    def _append_legend(self, name, is_selected):
        self.options.get("legend")[0].get("data").append(name)
        self.options.get("legend")[0].get("selected").update({name: is_selected})

    def _append_color(self, color: Optional[str]):
        if color:
            self.colors = [color] + self.colors
            if self.theme == ThemeType.WHITE:
                self.options.update(color=self.colors)

    def set_global_opts(
        self,
        title_opts: types.Title = opts.TitleOpts(),
        legend_opts: types.Legend = opts.LegendOpts(),
        tooltip_opts: types.Tooltip = None,
        toolbox_opts: types.Toolbox = None,
        brush_opts: types.Brush = None,
        xaxis_opts: types.Axis = None,
        yaxis_opts: types.Axis = None,
        visualmap_opts: types.VisualMap = None,
        datazoom_opts: types.DataZoom = None,
        graphic_opts: types.Graphic = None,
        axispointer_opts: types.AxisPointer = None,
    ):
        if tooltip_opts is None:
            tooltip_opts = opts.TooltipOpts(
                formatter=ToolTipFormatterType.get(self._chart_type, None)
            )
        self.options.update(
            title=title_opts,
            toolbox=toolbox_opts,
            tooltip=tooltip_opts,
            visualMap=visualmap_opts,
            dataZoom=datazoom_opts,
            graphic=graphic_opts,
            axisPointer=axispointer_opts,
        )

        if brush_opts is not None:
            self.options.update(brush=brush_opts)

        if isinstance(legend_opts, opts.LegendOpts):
            legend_opts = legend_opts.opts
        for _s in self.options["legend"]:
            _s.update(legend_opts)

        if xaxis_opts and self.options.get("xAxis", None):
            if isinstance(xaxis_opts, opts.AxisOpts):
                xaxis_opts = xaxis_opts.opts
            self.options["xAxis"][0].update(xaxis_opts)

        if yaxis_opts and self.options.get("yAxis", None):
            if isinstance(yaxis_opts, opts.AxisOpts):
                yaxis_opts = yaxis_opts.opts
            self.options["yAxis"][0].update(yaxis_opts)

        return self

    def add_dataset(
        self,
        source: types.Union[types.Sequence, types.JSFunc] = None,
        dimensions: types.Optional[types.Sequence] = None,
        source_header: types.Optional[bool] = None,
    ):
        self.options.update(
            dataset={
                "source": source,
                "dimensions": dimensions,
                "sourceHeader": source_header,
            }
        )
        return self
RectChart类
RectChart类是直角坐标系图表类的基类,父类为Chart类。
RectChart类的签名为class RectChart(init_opts)。Chart类的参数主要继承自Base类。Chart类的方法如下:
-
extend_axis:扩展 X/Y 轴。def extend_axis( # 扩展 X 坐标轴数据项 xaxis_data: Sequence = None, # 扩展 X 坐标轴配置项,参考 `global_options.AxisOpts` xaxis: Union[opts.AxisOpts, dict, None] = None, # 新增 Y 坐标轴配置项,参考 `global_options.AxisOpts` yaxis: Union[opts.AxisOpts, dict, None] = None, ) -
add_xaxis:新增 X 轴数据。def add_xaxis( # X 轴数据项 xaxis_data: Sequence ) -
reversal_axis:翻转xy轴。 -
overlap:叠加多个基本图表类实例。def overlap( chart: Base )
这些方法的原理相似,都是将接收的参数更新到options属性中(ECharts配置项)。
RectChart类源码
class RectChart(Chart):
    def __init__(self, init_opts: types.Init = opts.InitOpts()):
        super().__init__(init_opts=init_opts)
        self.options.update(xAxis=[opts.AxisOpts().opts], yAxis=[opts.AxisOpts().opts])

    def extend_axis(
        self,
        xaxis_data: Sequence = None,
        xaxis: types.Axis = None,
        yaxis: types.Axis = None,
    ):
        if xaxis is not None:
            if isinstance(xaxis, opts.AxisOpts):
                xaxis = xaxis.opts
            xaxis.update(data=xaxis_data)
            self.options["xAxis"].append(xaxis)
        if yaxis is not None:
            if isinstance(yaxis, opts.AxisOpts):
                yaxis = yaxis.opts
            self.options["yAxis"].append(yaxis)
        return self

    def add_xaxis(self, xaxis_data: Sequence):
        self.options["xAxis"][0].update(data=xaxis_data)
        self._xaxis_data = xaxis_data
        return self

    def reversal_axis(self):
        self.options["yAxis"][0]["data"] = self._xaxis_data
        self.options["xAxis"][0]["data"] = None
        return self

    def overlap(self, chart: Base):
        self.options.get("legend")[0].get("data").extend(
            chart.options.get("legend")[0].get("data")
        )
        self.options.get("legend")[0].get("selected").update(
            chart.options.get("legend")[0].get("selected")
        )
        self.options.get("series").extend(chart.options.get("series"))
        return self
Chart3D类
Chart3D类是3D图表的基类,父类为Chart类。
Chart3D类的签名为class Chart3D(init_opts)。Chart3D类的参数和方法主要继承自Chart类。
最主要的变化就是增加了echarts-gl依赖库用于绘制3D图表。
Chart3D类源码
class Chart3D(Chart):
     def __init__(self, init_opts: types.Init = opts.InitOpts()):
        init_opts.renderer = RenderType.CANVAS
        super().__init__(init_opts)
        self.js_dependencies.add("echarts-gl")
        self.options.update(visualMap=opts.VisualMapOpts().opts)
        self._3d_chart_type: Optional[str] = None  # 3d chart type,don't use it directly
ThreeAxisChart类
ThreeAxisChart类:三维坐标系图表基类,父类为Chart3D类。
ThreeAxisChart类的参数和方法主要继承自Chart3D类。
最主要的变化就是增加了add方法,add方法的签名为:
def add(
    # 系列名称,用于 tooltip 的显示,legend 的图例筛选。
    series_name: str,

    # 系列数据
    data: Sequence,

    # 三维柱状图中三维图形的着色效果。
    # color:只显示颜色,不受光照等其它因素的影响。
    # lambert:通过经典的 lambert 着色表现光照带来的明暗。
    # realistic:真实感渲染,配合 light.ambientCubemap 和 postEffect 使用可以让展示的画面效果和质感有质的提升。
    # ECharts GL 中使用了基于物理的渲染(PBR) 来表现真实感材质。
    shading: Optional[str] = None,

    # 图元配置项,参考 `series_options.ItemStyleOpts`
    itemstyle_opts: Union[opts.ItemStyleOpts, dict, None] = None

    # 标签配置项,参考 `series_options.LabelOpts`
    label_opts: Union[opts.LabelOpts, dict] = opts.LabelOpts(is_show=False),

    # 3D X 坐标轴配置项,参考 `Axis3DOpts`
    xaxis3d_opts: Union[opts.Axis3DOpts, dict] = opts.Axis3DOpts(type_="category"),

    # 3D Y 坐标轴配置项,参考 `Axis3DOpts`
    yaxis3d_opts: Union[opts.Axis3DOpts, dict] = opts.Axis3DOpts(type_="category"),

    # 3D Z 坐标轴配置项,参考 `Axis3DOpts`
    zaxis3d_opts: Union[opts.Axis3DOpts, dict] = opts.Axis3DOpts(type_="value"),

    # 三维笛卡尔坐标系配置项,参考 `Grid3DOpts`
    grid3d_opts: Union[opts.Grid3DOpts, dict] = opts.Grid3DOpts(),
)
ThreeAxisChart类源码
class ThreeAxisChart(Chart3D):
    def add(
        self,
        series_name: str,
        data: Sequence,
        shading: Optional[str] = None,
        itemstyle_opts: types.ItemStyle = None,
        label_opts: types.Label = opts.LabelOpts(is_show=False),
        xaxis3d_opts: types.Axis3D = opts.Axis3DOpts(type_="category"),
        yaxis3d_opts: types.Axis3D = opts.Axis3DOpts(type_="category"),
        zaxis3d_opts: types.Axis3D = opts.Axis3DOpts(type_="value"),
        grid3d_opts: types.Grid3D = opts.Grid3DOpts(),
        encode: types.Union[types.JSFunc, dict, None] = None,
    ):
        self.options.get("legend")[0].get("data").append(series_name)
        self.options.update(
            xAxis3D=xaxis3d_opts,
            yAxis3D=yaxis3d_opts,
            zAxis3D=zaxis3d_opts,
            grid3D=grid3d_opts,
        )

        self.options.get("series").append(
            {
                "type": self._3d_chart_type,
                "name": series_name,
                "data": data,
                "label": label_opts,
                "shading": shading,
                "itemStyle": itemstyle_opts,
                "encode": encode,
            }
        )
        return self


 2063
2063


 被折叠的 条评论
为什么被折叠?


