


0. 环境说明
本例环境基于ubuntu18.04,python3,wps。所有本例用到的类库都使用pip3来安装。首先安装pip3。
sudo apt install pip3
1. python处理word文档
安装处理word文档用到的python类库python-docx。
pip3 install python-docx
1.1 基础操作
一下是官方文档的一段示例代码,此处添加了注释:
# coding=utf-8

from docx import Document  # 文档对象
from docx.shared import Inches # 英尺

# 创建文档对象
document = Document()

# 增加文档标题(0级标题)
document.add_heading('文章标题',0)

# 增加段落
p = document.add_paragraph('你让他用戒指把你套上的时候,我察觉到你脸上复杂的笑容。')

# 段落后追加内容并设置追加的内容为粗体
p.add_run('追加的段落内容,样式为粗体。').bold = True

# 段落后追加内容并设置追加的内容为斜体
p.add_run('追加的段落内容,样式为斜体').italic = True

# 添加一级标题
document.add_heading('一级标题', level = 1)

#添加段落并设置段落为引用样式
document.add_paragraph('添加段落并添加了样式,此处的样式为引用', style= 'Intense Quote')

#增加段落并在段落前面加上项目符号(List Bullet样式为)
document.add_paragraph(
    '此处是项目符号样式', style = 'List Bullet'
)

#增加段落并添加编号
document.add_paragraph(
    '此处是编号样式', style = 'List Number'
)

# 添加图片并设置宽度为5英寸
document.add_picture('xq.jpg', width=Inches(5))


#创建一个二维元组,保存即将操作的表格的内容
records = (
    (1, '张三', '30'),
    (2, '李四', '35'),
    (3, '王五', '38')
)

# 创建一个1行3列的表格
table = document.add_table(rows=1,cols=3)

# 在表格第一行填充内容
hdr_cells = table.rows[0].cells
hdr_cells[0].text= '编号'
hdr_cells[1].text= '姓名'
hdr_cells[2].text= '年龄'

# 将定义好的表格内容追加进表格中
for bh, nl, xb in records:
    # 表格追加一行并分别填充1,2,3单元格
    row_cells = table .add_row().cells
    row_cells[0].text = str(bh)
    row_cells[1].text = nl
    row_cells[2].text = xb

# 添加分页符
document.add_page_break()

#保存文档
document.save('demo.docx')
生成的文档如下图:

1.2关于基础操作的补充:
1.2.1关于Document对象:
- Document对象不仅可以创建文档,还可以打开文档,以下示例代码打开并新建了一个文件:
document = Document('文档.docx')
document.save('新文档.docx')
#此处的操作是基于原来的文档内容新建了一个文档,原来的文档还存在
- 也可以用python的文件操作来打开文档,并转为Document对象
# 此处的b表示以二进制格式打开,以兼容win环境和某些低版本的linux.
f = open('demo.docx', 'rb')
document = Document(f)
f.close()
- Document也可以接受流对象,这对网络传输来说很方便。
from io import BytesIO

with open('demo1.docx', 'rb') as f:
    source_stream = BytesIO(f.read())
document = Document(source_stream)
source_stream.close()
#此处可以对document进行其他操作,最后保存文档
document.save('demo2.docx')
1.2.2 关于段落属性的设置
由于段落有多种属性,通常定义一个段落样式,将很多属性放在样式中,然后样式应用于段落。
水平对齐,用到的是枚举WD_PARAGRAPH_ALIGNMENT的值。可选的值有:
CENTER:居中对齐
DISTRIBUTE:分散对齐
JUSTIFY:两端对齐
THAI_JUSTIFY
JUSTIFY_HI:
JUSTIFY_LOW
JUSTIFY_MED
LEFT:左对齐
RIGHT:右对齐
# coding=utf-8
from docx import Document # 文档对象
from docx.enum.text import WD_ALIGN_PARAGRAPH
document = Document()
# 定义三个段落,分别演示左中右对齐
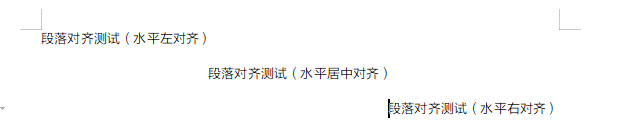
paragraph1 = document.add_paragraph(
'段落对齐测试(水平左对齐)'
)
paragraph2= document.add_paragraph(
'段落对齐测试(水平居中对齐)'
)
paragraph3= document.add_paragraph(
'段落对齐测试(水平右对齐)'
)
# 定义段落样式
paragraph_format1 = paragraph1.paragraph_format
paragraph_format2 = paragraph2.paragraph_format
paragraph_format3 = paragraph3.paragraph_format
# 在段落样式上添加对齐属性,可以添加其他更多属性
paragraph_format1.alignment = WD_ALIGN_PARAGRAPH.LEFT
paragraph_format2.alignment = WD_ALIGN_PARAGRAPH.CENTER
paragraph_format3.alignment = WD_ALIGN_PARAGRAPH.RIGHT
document.save('demo3.docx')
样式如图所示:
- 缩进
from docx.shared import Pt #像素
document = Document()
#定义三个段落,分别演示左中右对齐
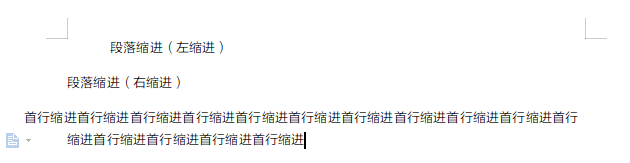
paragraph1 = document.add_paragraph(
'段落缩进(左缩进)'
)
paragraph2= document.add_paragraph(
'段落缩进(右缩进)'
)
paragraph3= document.add_paragraph(
'首行缩进首行缩进首行缩进首行缩进首行缩进首行缩进首行缩进首行缩进首行缩进首行缩进首行缩进首行缩进首行缩进首行缩进首行缩进'
)
#定义段落样式
paragraph_format1 = paragraph1.paragraph_format
paragraph_format2 = paragraph2.paragraph_format
paragraph_format3 = paragraph3.paragraph_format
#左缩进0.5英尺
paragraph_format1.left_indent = Inches(0.5)
#右缩进24像素
paragraph_format2.right_indent = Pt(24)
#首行缩进(负值表示悬挂缩进)
#paragraph_format3.first_line_indent = Inches(0.5)
paragraph_format3.first_line_indent = Inches(-0.5)
document.save('demo4.docx')
样式如下:
- 段间距
#段前间距
paragraph_format.space_before = Pt(18)
#段后间距
paragraph_format.space_after = Pt(12)
- 行间距
from docx.shared import Length
paragraph_format.line_spacing = Pt(18)
- 字符格式
from docx.shared import RGBColor
document = Document()
run = document.add_paragraph().add_run()
font = run.font
#设置字体字号斜体粗体字体颜色
font.name = 'Calibri'
font.size = Pt(12)
font.italic = True
font.bold = True
font.color.rgb = RGBColor(0x42, 0x24, 0xE9)
1.2.3 样式设置
样式分为段落样式,表格样式,段落样式可选:
Body Text,Body Text 2,Body Text 3,Caption,Heading 3,Heading 4,Heading 5,Heading 6,Heading 7,Heading 8,Heading 9,Intense Quote,List,List 2,List 3,List Bullet,List Bullet 2,List Bullet 3,List Continue,List Continue 2,List Continue 3,List Number,List Number 2,List Number 3,List Paragraph,macro,Normal,Header,Footer,Heading 1,Heading 2,No Spacing,Quote,Subtitle,Title,TOC Heading
表格样式可选:
Normal Table,Table Grid,Light Shading,Light Shading Accent 1,Light Shading Accent 2,Light Shading Accent 3,Light Shading Accent 4,Light Shading Accent 5,Light Shading Accent 6,Light List,Light List Accent 1,Light List Accent 2,Light List Accent 3,Light List Accent 4,Light List Accent 5,Light List Accent 6,Light Grid,Light Grid Accent 1,Light Grid Accent 2,Light Grid Accent 3,Light Grid Accent 4,Light Grid Accent 5,Light Grid Accent 6,Medium Shading 1,Medium Shading 1 Accent 1,Medium Shading 1 Accent 2,Medium Shading 1 Accent 3,Medium Shading 1 Accent 4,Medium Shading 1 Accent 5,Medium Shading 1 Accent 6,Medium Shading 2,Medium Shading 2 Accent 1,Medium Shading 2 Accent 2,Medium Shading 2 Accent 3,Medium Shading 2 Accent 4,Medium Shading 2 Accent 5,Medium Shading 2 Accent 6,Medium List 1,Medium List 1 Accent 1,Medium List 1 Accent 2,Medium List 1 Accent 3,Medium List 1 Accent 4,Medium List 1 Accent 5,Medium List 1 Accent 6,Medium List 2,Medium List 2 Accent 1,Medium List 2 Accent 2,Medium List 2 Accent 3,Medium List 2 Accent 4,Medium List 2 Accent 5,Medium List 2 Accent 6,Medium Grid 1,Medium Grid 1 Accent 1,Medium Grid 1 Accent 2,Medium Grid 1 Accent 3,Medium Grid 1 Accent 4,Medium Grid 1 Accent 5,Medium Grid 1 Accent 6,Medium Grid 2,Medium Grid 2 Accent 1,Medium Grid 2 Accent 2,Medium Grid 2 Accent 3,Medium Grid 2 Accent 4,Medium Grid 2 Accent 5,Medium Grid 2 Accent 6,Medium Grid 3,Medium Grid 3 Accent 1,Medium Grid 3 Accent 2,Medium Grid 3 Accent 3,Medium Grid 3 Accent 4,Medium Grid 3 Accent 5,Medium Grid 3 Accent 6,Dark List,Dark List Accent 1,Dark List Accent 2,Dark List Accent 3,Dark List Accent 4,Dark List Accent 5,Dark List Accent 6,Colorful Shading,Colorful Shading Accent 1,Colorful Shading Accent 2,Colorful Shading Accent 3,Colorful Shading Accent 4,Colorful Shading Accent 5,Colorful Shading Accent 6,Colorful List,Colorful List Accent 1,Colorful List Accent 2,Colorful List Accent 3,Colorful List Accent 4,Colorful List Accent 5,Colorful List Accent 6,Colorful Grid,Colorful Grid Accent 1,Colorful Grid Accent 2,Colorful Grid Accent 3,Colorful Grid Accent 4,Colorful Grid Accent 5,Colorful Grid Accent 6
- 段落样式设置
# 以下两种方式都可以设置段落样式
paragraph.style = document.styles['Heading 1']
paragraph.style = 'List Bullet'
- 表格样式设置
table.style = 'Colorful Grid Accent 6'
1.2.4 Sections对象
sections对象是Document的直接子对象,主要 用来操作页面布局以及页边距等,中文叫做段或者节。一个文档通常只有一段,而含有多个段的文档通常是文档中既有横向布局的页面也有纵向布局的页面。
- 改变页面尺寸和方向
from docx.enum.section import WD_ORIENT

document = Document()
#获取节对象
sections = document.sections
section = sections[0]
# 修改页宽和页高
section.page_height = Inches(5)
section.page_width = Inches(8.5)
 # 修改页面布局为横向布局
section.orientation = WD_ORIENT.LANDSCAPE
#修改页面布局为纵向布局
#section.orientation = WD_ORIENT.PORTRAIT
- 修改页边距
#左边距
section.left_margin = Inches(1)
#右边距
section.right_margin = Inches(1)
#上边距
section.top_margin = Inches(1)
#下边距
section.bottom_margin = Inches(1)
# 装订线宽度
section.gutter = Inches(0.5)
#页眉宽度
section.header_distance = Inches(0.5)
#页脚宽度
section.footer_distance = Inches(0.5)
1.2.5 页眉页脚
document = Document()
section = document.sections[0]
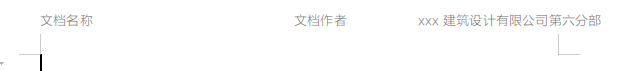
header = section.header
#添加页眉内容并添加样式
paragraph = header.paragraphs[0]
paragraph.text = "文档名称\t文档作者\txxx建筑设计有限公司第六分部"
paragraph.style = document.styles["Header"]
#删除页眉
#is_linked_to_previous是一个布尔属性,添加页眉是此值自动置为False
#将此值手动赋值为True事,将会清除页眉内容
#header.is_linked_to_previous = True
样式如下:
以上介绍了利用python-docx操作word文档的基本内容,更多操作详见官方文档:python-docx
2. python 编辑excel文档
python编辑excel文档可选的库有很多,比如:xlwings(可结合VBA对excel编程),openpyxl(功能广泛),pandas(数据处理能力强大),xlsxwriter(拥有丰富的特性)等等。本例主要使用openpyxl,首先安装openpyxl:
pip3 install openpyxl
2.1 写入示例
from openpyxl import Workbook  # 引入工作薄
import datetime

#创建工作薄
book = Workbook()
#选中活动表(默认第一张表,即Sheet1)
sheet = book.active

#A1单元格设置为42
sheet['A1'] = 42
#追加数据,分别填入单元格A2,B2,C2
sheet.append([1, 2, 3])

#A3单元格设置当前时间
sheet['A3'] = datetime.datetime.now()

# 另一种定位单元格的方法(第四行第二列即B4设置为16)
sheet.cell(row=4, column=2).value = 16

#创建新工作表 员工表(在工作表列表的尾部创建)
emp = book.create_sheet('员工表')

#保存工作薄
book.save("demo02.xlsx")
效果如下:

2.1.1 关于工作表的其他操作
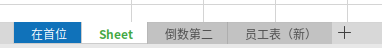
#创建新的工作表(在工作表列表的首位创建)
first = book.create_sheet('在首位',0)
# 在倒数第二的位置创建新的工作表
pen = book.create_sheet('倒数第二',-1)

#工作表重命名
emp.title='员工表(新)'
#工作表标签设置背景色
first.sheet_properties.tabColor = "1072BA"

#删除工作表
#book.remove_sheet(sheet1)

#遍历工作表
for sheet in book:
    print(sheet.title)
效果如下:
2.2 读取操作
import openpyxl
#打开文档
book = openpyxl.load_workbook('demo02.xlsx')
#选择工作表(此处选择之前有值的一个工作表)
sheet = book['Sheet']

#获取单元格A1的值
c = sheet['A1']
#print(c.value)
#使用切片访问单元格范围(返回值是二维元组)
cell_range = sheet['A1':'B4']
for row in cell_range:
    for cell in row:
        print(cell.value)

#获取一列数据
colB = sheet['B']
for cell in colB:
    print(cell.value)

#获取两列数据
col_range = sheet['C:D']
#获取一行数据
row2 = sheet[2]
#获取多行数据
row_range = sheet[1:2]

#获取整个工作表的值
for row in sheet.values:
   for value in row:
     print(value)
2.3 合并/取消合并单元格 插入图片 折叠行列
book = openpyxl.load_workbook('demo02.xlsx')
sheet = book['Sheet']
#合并单元格,仅保留合并区域左上角单元格的值
sheet.merge_cells('A1:B1')
#取消合并单元格
#sheet.unmerge_cells('A1:B1')

#同样可采用制定行列的方式来制定合并区域
#sheet.merge_cells(start_row=2, start_column=1, end_row=4, end_column=4)
#sheet.unmerge_cells(start_row=2, start_column=1, end_row=4, end_column=4)

img = Image('tx.jpeg')
sheet.add_image(img, 'D5')

#折叠AB两列
sheet.column_dimensions.group('A','B',hidden=True)
#折叠1,2两行
sheet.row_dimensions.group(1,2,hidden = True)

book.save("demo02.xlsx")
效果如下:

2.4 关于只读和只写模式的简单说明
当工作表的数据量巨大时,可能会超过openpyxl的负载,这时可以用只读模式或者只写模式,这两种模式可以在恒定的内存消耗下读写无限量的数据。
from openpyxl import load_workbook
#只读模式
book = load_workbook(filename='大文件.xlsx', read_only=True)
sheet = book['bigdata']

#只写模式
book = Workbook(write_only=True)
#只写模式下需要手动创建工作表
sheet = book.create_sheet()
'''
需要说明的是,只写模式下只能通过append追加数据,而不能通过的常规的方法给单元格赋值。
只写模式创建的工作薄没有默认的工作表,必须create_sheet()手动创建工作表。
只写工作薄只能保存一次,再次保存会引发异常。请在保存之前确认所有的追加数据的操作都已完成。
'''
2.5 插入行列,移动单元格
#在第7行之前插入一行
sheet.insert_rows(7)

#删除一行(删除第一行)
sheet.delete_rows(1)

#删除多行(删除1,2,3行)
sheet.delete_rows(1,3)

#删除一列(删除A列)
sheet.delete_cols(1)

#删除多列(删除ABC列)
sheet.delete_cols(1,3)

#移动单元格(向上移动一行,向右移动两列)
sheet.move_range("D4:F10", rows=-1, cols=2)
#移动单元格的同时将公式引用同时移动
shhet.move_range("G4:H10", rows=1, cols=1, translate=True)
2.6 图表
2.6.1 2D区域图
from openpyxl import Workbook
from openpyxl.chart import (
    AreaChart,
    Reference,
    Series,
)

book = Workbook()
sheet = book.active

rows = [
    ['月份', '产品1销量', '产品2销量'],
    [2, 40, 30],
    [3, 40, 25],
    [4, 50, 30],
    [5, 30, 10],
    [6, 25, 5],
    [7, 50, 10],
]

for row in rows:
    sheet.append(row)

#创建图表
chart = AreaChart()
#图表标题
chart.title = "半年销量走势图"
#图表样式
chart.style = 13
#x轴标题
chart.x_axis.title = '月份'
#y轴标题
chart.y_axis.title = '销量'

#月份引用区域
cats = Reference(sheet, min_col=1, min_row=2, max_row=7)
#销量数据引用区域
data = Reference(sheet, min_col=2, min_row=1, max_col=3, max_row=7)
#销量数据添加到图表
chart.add_data(data, titles_from_data=True)
#设置纵轴数据展示
chart.set_categories(cats)

#图表添加位置
sheet.add_chart(chart, "A10")

book.save("2darea.xlsx")
效果如下:

更多图表请查询官方文档
3. python处理ppt
python 处理ppt用到的库是python-pptx.首先安装:
pip3 install python-pptx
3.1 让我们从Hello,World开始
官方文档的hello,word示例,此处加了注释:
from pptx import Presentation

# 新建演示文稿
prs = Presentation()

# 获取幻灯片布局
title_slide_layout = prs.slide_layouts[0]

# 基于布局新增一张幻灯片
slide = prs.slides.add_slide(title_slide_layout)

# 获取标题占位符
title = slide.shapes.title
# 副标题占位符
subtitle = slide.placeholders[1]

# 设置标题和副标题
title.text = "Hello, World!"
subtitle.text = "python-pptx was here!"

# 保存演示文稿
prs.save('demo.pptx')
效果如下:

3.1.1 关于幻灯片布局
title_slide_layout = prs.slide_layouts[0],下标处可取值0-8,对应的幻灯片布局是:
- 标题
- 标题和内容
- 段标题
- 并排项目符号文本框
- 比较
- 仅标题
- 空白
- 带字幕的内容
- 带标题的图片
上面列举的布局并非是一定按照0-8的顺序出现,不同的平台索引也不一样。
3.2 项目符号幻灯片
from pptx import Presentation

# 新建演示文稿
prs = Presentation()

# 获取幻灯片布局
bullet_slide_layout = prs.slide_layouts[1]

#增加幻灯片
slide = prs.slides.add_slide(bullet_slide_layout)

#获取形状对象
shapes = slide.shapes

#获取标题占位符形状
title_shape = shapes.title

#获取页面主体的占位符
body_shape = shapes.placeholders[1]

#幻灯片标题
title_shape.text = 'Adding a Bullet Slide'

# 文本框
tf = body_shape.text_frame
#文本框内容
tf.text = 'Find the bullet slide layout'

# 文本框增加段落
p = tf.add_paragraph()
# 段落内容
p.text = 'Use _TextFrame.text for first bullet'
# 缩进级别(范围0-8)
p.level = 1

p = tf.add_paragraph()
p.text = 'Use _TextFrame.add_paragraph() for subsequent bullets'
p.level = 2

# 保存演示文稿
prs.save('demo.pptx')
效果如下:

3.2.1 关于形状
幻灯片上的几乎所有东西都是形状。唯一不是形状的对象就是幻灯片背景。幻灯片中的形状主要有以下几种:
- 自动形状–具有填充和轮廓的形状
- 文本框
- 占位符
- 连接器
- 图片
- 表格
- 图表–饼图,折线图等
- 媒体剪辑–视频或音频
shapes = slide.shapes可以访问幻灯片上的形状。
自动形状的示例程序(圆角矩形):
from pptx import Presentation
from pptx.enum.shapes import MSO_SHAPE  # 四角形
from pptx.util import Inches, Pt # 尺寸
from pptx.enum.dml import MSO_THEME_COLOR # 主题颜色

prs = Presentation()
slide_layout = prs.slide_layouts[0]
slide = prs.slides.add_slide(slide_layout)
shapes = slide.shapes
#设置位置和尺寸
left = top = width = height = Inches(1.0)
# 添加圆角矩形
shape = shapes.add_shape(
    MSO_SHAPE.ROUNDED_RECTANGLE, left, top, width, height
)
# 对形状进行纯色填充
fill = shape.fill
fill.solid()
#选取颜色
fill.fore_color.theme_color = MSO_THEME_COLOR.ACCENT_1
#颜色深度
fill.fore_color.brightness = 0.25

# 修改形状的轮廓颜色以及宽度
line = shape.line
line.color.theme_color = MSO_THEME_COLOR.ACCENT_6
# 透明度
line.color.brightness = 0.5
# 线宽
line.width = Pt(2.5)
圆角矩形填充前和填充后
自动图形一共有128中可选,详见MSO_AUTO_SHAPE_TYPE枚举,取自官方文档,暂时没有翻译,稍后会进行翻译。
3.2.2 关于例子中颜色 MSO_THEME_COLOR的枚举:
可选值有:
- NOT_THEME_COLO
- ACCENT_1 :强调样式1
- ACCENT_2
- ACCENT_3
- ACCENT_4
- ACCENT_5
- ACCENT_6
- BACKGROUND_1 : 背景样式1
- BACKGROUND_2
- DARK_1:深色主题1
- DARK_2
- FOLLOWED_HYPERLINK :指定单击的超链接的主题颜色。
- HYPERLINK :指定超链接的主题颜色。
- LIGHT_1:浅色1
- LIGHT_2
- TEXT_1:文本1
- TEXT_2
- MIXED:表示使用了多种主题颜色,例如成组的形状。
3.3 占位符
占位符有18种,分别是:标题,中心标题,字幕,正文,内容,图片,剪贴画,图表,表格,智能艺术品,媒体剪辑,日期,页脚,幻灯片编号,标头,垂直主体,垂直对象,垂直标题。
遍历幻灯片布局上的占位符:
prs = Presentation()
slide = prs.slides.add_slide(prs.slide_layouts[8])
# 遍历索引为8的布局上的占位符
for shape in slide.placeholders:
	print('%d %s' % (shape.placeholder_format.idx, shape.name))
#输出结果
'''
0  Title 1
1  Picture Placeholder 2
2  Text Placeholder 3
'''
# 在占位符中插入一张图片
#以这种方式插入的图片将按比例拉伸并裁剪以填充整个占位符。
placeholder = slide.placeholders[1]
picture = placeholder.insert_picture('test.png')
#占位符中插入表格
#graphic_frame = placeholder.insert_table(rows=2, cols=2)
#占位符中插入图表
#from pptx.chart.data import ChartData
#from pptx.enum.chart import XL_CHART_TYPE
#图表数据
#chart_data = ChartData()
#chart_data.categories = ['Yes', 'No']
#chart_data.add_series('Series 1', (42, 24))
#插入饼图
#graphic_frame = placeholder.insert_chart(XL_CHART_TYPE.PIE, chart_data)
# 其他占位符的插入操作不再做详细说明,按照上面的方法插入即可。
3.4 文本
自动形状和表格单元格可以包含文本。其他形状不能。文本分为三种:文本框,段落,追加文本。
3.4.1 遍历文本框
for shape in slide.shapes:
    if not shape.has_text_frame:
        continue
    text_frame = shape.text_frame
3.4.2 段落操作
增加一个具有三个段落的形状:
# 准备三个段落的内容,此处为一个3个元素的数组
paragraph_strs = [
    'Egg, bacon, sausage and spam.',
    'Spam, bacon, sausage and spam.',
    'Spam, egg, spam, spam, bacon and spam.'
]
# 获取文本框
text_frame = shape.text_frame
#清空文本框中可能存在的任何内容
text_frame.clear()
#增加一个段落
p = text_frame.paragraphs[0]
#填充段落内容
p.text = paragraph_strs[0]
#追加后面两个段落
for para_str in paragraph_strs[1:]:
    p = text_frame.add_paragraph()
    p.text = para_str
#一种更快捷的方法将文字插入到段落中
shape.text = 'foobar'
3.4.3 文本框格式
from pptx.util import Inches
from pptx.enum.text import MSO_ANCHOR, MSO_AUTO_SIZE

text_frame = shape.text_frame
text_frame.text = 'Spam, eggs, and spam'
#下边距
text_frame.margin_bottom = Inches(0.08)
#左边距
text_frame.margin_left = 0
#顶部对齐
text_frame.vertical_anchor = MSO_ANCHOR.TOP
#禁止单词被打断
text_frame.word_wrap = False
# 文本框适应文本
text_frame.auto_size = MSO_AUTO_SIZE.SHAPE_TO_FIT_TEXT
3.4.4 段落格式
from pptx.enum.text import PP_ALIGN

text_frame = shape.text_frame
text_frame.clear()

p = text_frame.paragraphs[0]
p.text = paragraph_strs[0]
#左对齐
p.alignment = PP_ALIGN.LEFT
#缩进级别
p.level = 1
3.5.5 字符格式
from pptx.dml.color import RGBColor
from pptx.enum.dml import MSO_THEME_COLOR
from pptx.util import Pt

text_frame = shape.text_frame
text_frame.clear()

p = text_frame.paragraphs[0]
run = p.add_run()
run.text = 'Spam, eggs, and spam'

font = run.font
#字体
font.name = 'Calibri'
#字号
font.size = Pt(18)
#粗体
font.bold = True
#斜体
font.italic = None
#字体颜色
font.color.theme_color = MSO_THEME_COLOR.ACCENT_1
3.5 图表
3.5.1 单系列柱状图
from pptx import Presentation
from pptx.chart.data import CategoryChartData
from pptx.enum.chart import XL_CHART_TYPE
from pptx.util import Inches

prs = Presentation()
slide = prs.slides.add_slide(prs.slide_layouts[5])

#图表对象
chart_data = CategoryChartData()
chart_data.categories = ['East', 'West', 'Midwest']
#图表数据
chart_data.add_series('Series 1', (19.2, 21.4, 16.7))
#图表位置和大小
x, y, cx, cy = Inches(2), Inches(2), Inches(6), Inches(4.5)
#XL_CHART_TYPE.COLUMN_CLUSTERED为柱状图
slide.shapes.add_chart(
    XL_CHART_TYPE.COLUMN_CLUSTERED, x, y, cx, cy, chart_data
)

prs.save('chart-01.pptx')
结果如下:

3.5.2 多系列柱状图
from pptx import Presentation
from pptx.chart.data import CategoryChartData
from pptx.enum.chart import XL_CHART_TYPE
from pptx.util import Inches

prs = Presentation()
slide = prs.slides.add_slide(prs.slide_layouts[5])

chart_data = CategoryChartData()
x, y, cx, cy = Inches(2), Inches(2), Inches(6), Inches(4.5)
chart_data.categories = ['East', 'West', 'Midwest']
chart_data.add_series('Q1 Sales', (19.2, 21.4, 16.7))
chart_data.add_series('Q2 Sales', (22.3, 28.6, 15.2))
chart_data.add_series('Q3 Sales', (20.4, 26.3, 14.2))

graphic_frame = slide.shapes.add_chart(
    XL_CHART_TYPE.COLUMN_CLUSTERED, x, y, cx, cy, chart_data
)
prs.save('chart-01.pptx')
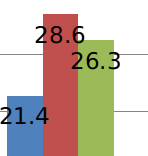
效果如下:

3.5.3 添加数据标签
from pptx.util import Pt
from pptx.dml.color import RGBColor

chart =  graphic_frame.chart
plot = chart.plots[0]
plot.has_data_labels = True
data_labels = plot.data_labels

data_labels.font.size = Pt(13)
data_labels.font.color.rgb = RGBColor(0x0A, 0x42, 0x80)
data_labels.position = XL_LABEL_POSITION.INSIDE_END
3.5.4 添加图例
from pptx.enum.chart import XL_LEGEND_POSITION

chart.has_legend = True
chart.legend.position = XL_LEGEND_POSITION.RIGHT
chart.legend.include_in_layout = False
图例效果如下:

限于篇幅,excel和ppt的更多图表以后会专门写一篇来介绍。
3.6 表格
from pptx import Presentation
from pptx.util import Inches

prs = Presentation()
slide = prs.slides.add_slide(prs.slide_layouts[5])

#位置和尺寸
x, y, cx, cy = Inches(2), Inches(2), Inches(4), Inches(1.5)
#指定行列数
shape = slide.shapes.add_table(3, 3, x, y, cx, cy)

prs.save('table.pptx')
效果如下:
3.6.1 表格其他操作
# 访问单元格
table = shape.table
cell = table.cell(0, 0)
print(cell.text)

# 合并单元格
cell = table.cell(0, 0)
cell1 = table.cell(1, 1)
cell.merge(cell1)
#取消合并单元格
cell = table.cell(0, 0)
ell.split()
OK,关于python处理办公文档的操作就介绍到这里,关于其他更为复杂精细的操作,请参考官方文档。由于本例采用办公套件是wps,与微软office或许有细节上的差异,请自行调整参数或在评论里沟通。


 276
276


 被折叠的 条评论
为什么被折叠?
被折叠的 条评论
为什么被折叠?
 到【灌水乐园】发言


