


介绍
Flume是一款分布式的ETL工具,以流式进行数据接入。它具有分布式、容错机制、可水平扩容的特性,并且使用简单,内置丰富的组件,通过配置文件即可实现数据的转移,不需要编写任何代码,特殊情况下需自行实现接口,编写自定义的组件。
架构
**Source:**数据源,数据通过Source接口进入Flume,内置多种Source,可直接与其他软件进行对接
**Channel:**管道,相当于缓存,Souce中的数据经过处理后会直接进入Channel中
**Sink:**输出,Sink接收Channel中的数据,将数据写入到指定的系统
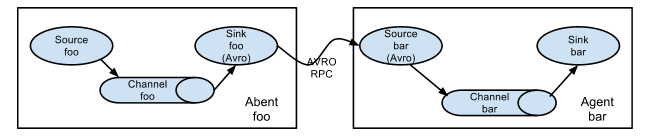
在Flume中是以Agent为单位运行的,通常一个完整的Flume程序包括Source、Channel、Sink三部分,这三个组件串联成一个Data Flow,也就是一个Agent。
一个Agent可以有多个Source、Channel、Sink,在Flume中也可以启动多个Agent并行或串行运行,以Agent为单位组成一个复杂的拓扑图。
下图为官方提供的Agent组成图:

多个Agent串行:
多个Agent组合的复杂拓扑图:

安装
tar -zxvf apache-flume-1.9.0-bin.tar.gz
cd apache-flume-1.9.0-bin
cp conf/flume-env.sh.template conf/flume-env.sh
到此安装就完成了,flume解压完即可,不需要启动后台服务
配置Agent
本文模拟TCP从Rsyslog接入日志,写入Kafka
1、新建一个配置文件,conf/rsyslog-kafka.conf
#Setting Agent Name
a1.sources = r_netstat
a1.channels = c1
a1.sinks = k_kafka

#--------------------------------------------------------------------------------------
#Setting Channel
# 1. ads channel
a1.channels.c1.type = memory
a1.channels.c1.capacity = 500000
a1.channels.c1.transactionCapacity = 50000
a1.channels.c1.keep-alive = 30
a1.channels.c1.byteCapacityBufferPercentage = 40
a1.channels.c1.byteCapacity = 80000000

#--------------------------------------------------------------------------------------
# Seting Sources: r_netstat
a1.sources.r_netstat.type = netcat
a1.sources.r_netstat.bind = tod1
a1.sources.r_netstat.port = 5150
a1.sources.r_netstat.max-line-length = 1024000
a1.sources.r_netstat.channels = c1

#--------------------------------------------------------------------------------------
#Setting Sink To Kafka
# Describe the netstat_k_kafka sink
a1.sinks.k_kafka.type = org.apache.flume.sink.kafka.KafkaSink
a1.sinks.k_kafka.kafka.topic = test-log
a1.sinks.k_kafka.kafka.bootstrap.servers = tod1:9092,tod2:9092,tod3:9092
a1.sinks.k_kafka.kafka.flumeBatchSize = 500
a1.sinks.k_kafka.kafka.producer.acks = 1
a1.sinks.k_kafka.kafka.linger.ms = 1
#a1.sinks.k_kafka.k_kafka = snappy

# Bind the source and sink to the channel
a1.sources.r_netstat.channels = c1
a1.sinks.k_kafka.channel = c1
Haproxy配置
global
   log tod1 local0
   chroot /var/lib/haproxy # 如果非root用户启动,注释掉这行配置
   pidfile /var/run/haproxy.pid
   maxconn 10000
   stats timeout 30s
   user haproxy
   group haproxy
   daemon
   ulimit-n 100000
   stats socket /var/lib/haproxy/stats level admin process 1

defaults
   log global
   option tcplog
   option dontlognull
   retries 3
   timeout connect 5000
   timeout client 50000
   timeout server 50000
   maxconn 10000
#haproxy监控,访问http://tod1:1180/haproxy
listen admin_stats
    bind tod1:1180
    mode http
    stats enable
    stats hide-version
    stats auth admin:admin
    stats realm HAproxy
    stats admin if TRUE
    stats uri /haproxy
    stats refresh 5
#前置监听端口
frontend tcp_front
   bind tod1:514
   mode tcp
   default_backend tcp_back
#后置转发端口
backend tcp_back
   balance source
   mode tcp
   server agent_1 tod1:6551 check
   server agent_2 tod1:6552 check
   server agent_3 tod1:6553 check
Rsyslog配置文件
/etc/rsyslog.conf增加以下配置
module(load="imfile" mode="inotify")
$MainMsgQueueWorkerThreads 1
$MainMsgQueueDequeueBatchSize 30
$MainMsgQueueDequeueSlowdown 300
$MainMsgQueueDiscardSeverity 8
$MainMsgQueueType LinkedList
$MainMsgQueueFileName main_queue_buffer
$MainMsgQueueMaxDiskSpace 1g
$MainMsgQueueSaveOnShutdown on

$imjournalRatelimitInterval 5
$imjournalRatelimitBurst 50000
/etc/rsyslog.d/,新增配置文件my-test.cnf
$WorkDirectory /var/spool/rsyslog

$ActionQueueWorkerThreads 1
$ActionQueueDequeueBatchSize 30
$ActionQueueDequeueSlowdown 300
$ActionQueueDiscardSeverity 8
$ActionQueueType LinkedList
$ActionQueueFileName action_queue_buffer_test
$ActionQueueMaxDiskSpace 10m
$ActionQueueSaveOnShutdown on

$MaxMessageSize 64k

input(type="imfile"
      File="/var/log/messages"
      Tag="test_app1"
      Severity="info"
      PersistStateInterval="20000"
      reopenOnTruncate="on"
      )

template (name="TestFormat_test_app1" type="string" string="<rsyslog>v2 %timestamp:::date-rfc3339% %HOSTNAME% %procid% %$!metadata!filename% [test] %msg%\n")

# Send message to LinkedLog and discard it
if $programname == 'test_app1' then action(type="omfwd" protocol="tcp" target="tod1" port="514" template="LinkedLogFormat_test_app1")
if $programname == 'test_app1' then stop
2、启动
注意:启动-n参数为Agent的名称,要与rsyslog-kafka.conf中的一致。Flume中每个Agent都有一个唯一的名字,不能重复
启动Agent并开启监控功能
nohup ./bin/flume-ng agent -c conf/ -f conf/rsyslog-kafka.conf -n a1 -Dflume.monitoring.type=http -Dflume.monitoring.port=34545 > rsyslog-kafka.log 2>&1 &
#查看运行情况
curl tod1:34545/metrics
# 也可以用python json.tool格式化返回输出
curl tod1:34545/metrics | python -m json.tool

总结
在16C、64
水平一般,能力有限,大数据小学生一枚。文章主要用于个人学习和总结,如果能给他人带来帮助,纯属意外。


 4378
4378


 被折叠的 条评论
为什么被折叠?
被折叠的 条评论
为什么被折叠?
 到【灌水乐园】发言


