


背景:
测试在稳定性测试时发现设备内存耗尽。
分析:
阶段1:判断是用户态泄露还是内核态泄露
使用cat /proc/meminfo查看内存泄露状况
[root@vnf ~]# cat /proc/meminfo
MemTotal:        1868688 kB
MemFree:         1581588 kB
MemAvailable:    1583504 kB
Buffers:             948 kB
Cached:           106224 kB
SwapCached:            0 kB
Active:            94420 kB
Inactive:          80504 kB
Active(anon):      68176 kB
Inactive(anon):     8388 kB
Active(file):      26244 kB
Inactive(file):    72116 kB
Unevictable:           0 kB
Mlocked:               0 kB
SwapTotal:       4194300 kB
SwapFree:        4194300 kB
Dirty:                 0 kB
Writeback:             0 kB
AnonPages:         67792 kB
Mapped:            17984 kB
Shmem:              8812 kB
Slab:              42604 kB
SReclaimable:      18096 kB
SUnreclaim:        24508 kB
KernelStack:        8192 kB
PageTables:         2620 kB
NFS_Unstable:          0 kB
Bounce:                0 kB
WritebackTmp:          0 kB
CommitLimit:     5128644 kB
Committed_AS:     221652 kB
VmallocTotal:   34359738367 kB
VmallocUsed:      193376 kB
VmallocChunk:   34359533052 kB
HardwareCorrupted:     0 kB
AnonHugePages:      6144 kB
HugePages_Total:       0
HugePages_Free:        0
HugePages_Rsvd:        0
HugePages_Surp:        0
Hugepagesize:       2048 kB
DirectMap4k:       61312 kB
DirectMap2M:     2035712 kB
DirectMap1G:           0 kB
对比刚启动和正常运行若干时间后的数据,发现是slab的持续增加导致free的值在不断减少
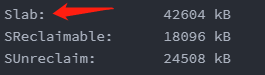
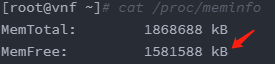
这种slab的泄露基本都是内核态申请资源泄露的。
为啥要区分内核态和用户态内存泄露呢,因为定位方法有些区别。内核态定位更加麻烦些。
阶段2:分析slab确定是slab的哪个地方在泄露
使用cat /proc/slabinfo查看slab使用的情况
 cat /proc/slabinfo
slabinfo - version: 2.1
# name            <active_objs> <num_objs> <objsize> <objperslab> <pagesperslab> : tunables <limit> <batchcount> <sharedfactor> : slabdata <active_slabs> <num_slabs> <sharedavail>
nf_conntrack_ffffffff81a25e00    102    102    320   51    4 : tunables    0    0    0 : slabdata      2      2      0
xfs_dqtrx              0      0    528   62    8 : tunables    0    0    0 : slabdata      0      0      0
xfs_dquot              0      0    472   69    8 : tunables    0    0    0 : slabdata      0      0      0
xfs_icr                0      0    144   56    2 : tunables    0    0    0 : slabdata      0      0      0
xfs_ili             1590   1590    152   53    2 : tunables    0    0    0 : slabdata     30     30      0
xfs_inode           2550   2550   1088   30    8 : tunables    0    0    0 : slabdata     85     85      0
xfs_efd_item          80     80    400   40    4 : tunables    0    0    0 : slabdata      2      2      0
xfs_da_state         136    136    480   68    8 : tunables    0    0    0 : slabdata      2      2      0
xfs_btree_cur         78     78    208   39    2 : tunables    0    0    0 : slabdata      2      2      0
xfs_log_ticket        88     88    184   44    2 : tunables    0    0    0 : slabdata      2      2      0
scsi_cmd_cache        72     72    448   36    4 : tunables    0    0    0 : slabdata      2      2      0
kcopyd_job             0      0   3312    9    8 : tunables    0    0    0 : slabdata      0      0      0
dm_uevent              0      0   2608   12    8 : tunables    0    0    0 : slabdata      0      0      0
dm_rq_target_io        0      0    136   60    2 : tunables    0    0    0 : slabdata      0      0      0
UDPLITEv6              0      0   1152   28    8 : tunables    0    0    0 : slabdata      0      0      0
UDPv6                 56     56   1152   28    8 : tunables    0    0    0 : slabdata      2      2      0
tw_sock_TCPv6          0      0    256   64    4 : tunables    0    0    0 : slabdata      0      0      0
TCPv6                 30     30   2112   15    8 : tunables    0    0    0 : slabdata      2      2      0
uhci_urb_priv        438    438     56   73    1 : tunables    0    0    0 : slabdata      6      6      0
cfq_queue            140    140    232   70    4 : tunables    0    0    0 : slabdata      2      2      0
bsg_cmd                0      0    312   52    4 : tunables    0    0    0 : slabdata      0      0      0
mqueue_inode_cache     36     36    896   36    8 : tunables    0    0    0 : slabdata      1      1      0
hugetlbfs_inode_cache    106    106    608   53    8 : tunables    0    0    0 : slabdata      2      2      0
configfs_dir_cache      0      0     88   46    1 : tunables    0    0    0 : slabdata      0      0      0
dquot                  0      0    256   64    4 : tunables    0    0    0 : slabdata      0      0      0
userfaultfd_ctx_cache      0      0    128   64    2 : tunables    0    0    0 : slabdata      0      0      0
pid_namespace          0      0   2176   15    8 : tunables    0    0    0 : slabdata      0      0      0
user_namespace         0      0    280   58    4 : tunables    0    0    0 : slabdata      0      0      0
posix_timers_cache      0      0    248   66    4 : tunables    0    0    0 : slabdata      0      0      0
UDP-Lite               0      0   1024   32    8 : tunables    0    0    0 : slabdata      0      0      0
RAW                  340    340    960   34    8 : tunables    0    0    0 : slabdata     10     10      0
UDP                   64     64   1024   32    8 : tunables    0    0    0 : slabdata      2      2      0
tw_sock_TCP            0      0    256   64    4 : tunables    0    0    0 : slabdata      0      0      0
TCP                   34     34   1920   17    8 : tunables    0    0    0 : slabdata      2      2      0
blkdev_queue          45     45   2088   15    8 : tunables    0    0    0 : slabdata      3      3      0
blkdev_requests      882    882    384   42    4 : tunables    0    0    0 : slabdata     21     21      0
blkdev_ioc            78     78    104   39    1 : tunables    0    0    0 : slabdata      2      2      0
fsnotify_event_holder    340    340     24  170    1 : tunables    0    0    0 : slabdata      2      2      0
fsnotify_event       136    136    120   68    2 : tunables    0    0    0 : slabdata      2      2      0
sock_inode_cache     561    561    640   51    8 : tunables    0    0    0 : slabdata     11     11      0
net_namespace          0      0   4608    7    8 : tunables    0    0    0 : slabdata      0      0      0
shmem_inode_cache   1008   1008    680   48    8 : tunables    0    0    0 : slabdata     21     21      0
Acpi-ParseExt       6608   6608     72   56    1 : tunables    0    0    0 : slabdata    118    118      0
Acpi-Namespace      4590   4590     40  102    1 : tunables    0    0    0 : slabdata     45     45      0
taskstats             98     98    328   49    4 : tunables    0    0    0 : slabdata      2      2      0
proc_inode_cache    2254   2254    656   49    8 : tunables    0    0    0 : slabdata     46     46      0
sigqueue             102    102    160   51    2 : tunables    0    0    0 : slabdata      2      2      0
bdev_cache            78     78    832   39    8 : tunables    0    0    0 : slabdata      2      2      0
sysfs_dir_cache    29412  29412    112   36    1 : tunables    0    0    0 : slabdata    817    817      0
inode_cache        12925  12925    592   55    8 : tunables    0    0    0 : slabdata    235    235      0
dentry             26292  26292    192   42    2 : tunables    0    0    0 : slabdata    626    626      0
iint_cache             0      0     80   51    1 : tunables    0    0    0 : slabdata      0      0      0
selinux_inode_security  14455  14841     80   51    1 : tunables    0    0    0 : slabdata    291    291      0
buffer_head          156    156    104   39    1 : tunables    0    0    0 : slabdata      4      4      0
vm_area_struct      2611   2738    216   37    2 : tunables    0    0    0 : slabdata     74     74      0
mm_struct             60     60   1600   20    8 : tunables    0    0    0 : slabdata      3      3      0
files_cache          204    204    640   51    8 : tunables    0    0    0 : slabdata      4      4      0
signal_cache         812    812   1152   28    8 : tunables    0    0    0 : slabdata     29     29      0
sighand_cache        540    540   2112   15    8 : tunables    0    0    0 : slabdata     36     36      0
task_xstate          672    672    576   56    8 : tunables    0    0    0 : slabdata     12     12      0
task_struct          552    572   2944   11    8 : tunables    0    0    0 : slabdata     52     52      0
anon_vma            1747   2048     64   64    1 : tunables    0    0    0 : slabdata     32     32      0
shared_policy_node   2380   2380     48   85    1 : tunables    0    0    0 : slabdata     28     28      0
numa_policy          186    186    264   62    4 : tunables    0    0    0 : slabdata      3      3      0
radix_tree_node     1568   1568    584   56    8 : tunables    0    0    0 : slabdata     28     28      0
idr_layer_cache      165    165   2112   15    8 : tunables    0    0    0 : slabdata     11     11      0
dma-kmalloc-8192       0      0   8192    4    8 : tunables    0    0    0 : slabdata      0      0      0
dma-kmalloc-4096       0      0   4096    8    8 : tunables    0    0    0 : slabdata      0      0      0
dma-kmalloc-2048       0      0   2048   16    8 : tunables    0    0    0 : slabdata      0      0      0
dma-kmalloc-1024       0      0   1024   32    8 : tunables    0    0    0 : slabdata      0      0      0
dma-kmalloc-512       64     64    512   64    8 : tunables    0    0    0 : slabdata      1      1      0
dma-kmalloc-256        0      0    256   64    4 : tunables    0    0    0 : slabdata      0      0      0
dma-kmalloc-128        0      0    128   64    2 : tunables    0    0    0 : slabdata      0      0      0
dma-kmalloc-64         0      0     64   64    1 : tunables    0    0    0 : slabdata      0      0      0
dma-kmalloc-32         0      0     32  128    1 : tunables    0    0    0 : slabdata      0      0      0
dma-kmalloc-16         0      0     16  256    1 : tunables    0    0    0 : slabdata      0      0      0
dma-kmalloc-8          0      0      8  512    1 : tunables    0    0    0 : slabdata      0      0      0
dma-kmalloc-192        0      0    192   42    2 : tunables    0    0    0 : slabdata      0      0      0
dma-kmalloc-96         0      0     96   42    1 : tunables    0    0    0 : slabdata      0      0      0
kmalloc-8192          36     48   8192    4    8 : tunables    0    0    0 : slabdata     12     12      0
kmalloc-4096         224    240   4096    8    8 : tunables    0    0    0 : slabdata     30     30      0
kmalloc-2048        1014   1104   2048   16    8 : tunables    0    0    0 : slabdata     69     69      0
kmalloc-1024        2144   2144   1024   32    8 : tunables    0    0    0 : slabdata     67     67      0
kmalloc-512         3454   3456    512   64    8 : tunables    0    0    0 : slabdata     54     54      0
kmalloc-256         2526   4288    256   64    4 : tunables    0    0    0 : slabdata     67     67      0
kmalloc-192         6132   6132    192   42    2 : tunables    0    0    0 : slabdata    146    146      0
kmalloc-128         3520   3520    128   64    2 : tunables    0    0    0 : slabdata     55     55      0
kmalloc-96          1806   1806     96   42    1 : tunables    0    0    0 : slabdata     43     43      0
kmalloc-64         12631  12864     64   64    1 : tunables    0    0    0 : slabdata    201    201      0
kmalloc-32          4480   4480     32  128    1 : tunables    0    0    0 : slabdata     35     35      0
kmalloc-16          7168   7168     16  256    1 : tunables    0    0    0 : slabdata     28     28      0
kmalloc-8           9216   9216      8  512    1 : tunables    0    0    0 : slabdata     18     18      0
kmem_cache_node      192    192     64   64    1 : tunables    0    0    0 : slabdata      3      3      0
kmem_cache           192    192    256   64    4 : tunables    0    0    0 : slabdata      3      3      0
[root@vnf ~]#
运行一段时间进行对比发现 <active_objs> 列的 kmalloc-8192一直在增长

阶段3:打开内核调试选项
这个阶段需要打开Linux内核的调试编译选项,重新编译内核
1,内核编译选项:
下载源码,或者打开自己定制的linux内核,使用make menuconfig打开配置。(具体的内核命令得看自己使用的编译方式)


 2,重新编译的内核就可以查看slab详细信息。因为我这是kmalloc-8192在涨所以我就看kmalloc-8192。这个需要具体情况判断。
 cat /sys/kernel/slab/kmalloc-8192/
/sys/kernel/slab/kmalloc-8192/aliases
/sys/kernel/slab/kmalloc-8192/align
/sys/kernel/slab/kmalloc-8192/alloc_calls
/sys/kernel/slab/kmalloc-8192/cpu_partial
/sys/kernel/slab/kmalloc-8192/cpu_slabs
/sys/kernel/slab/kmalloc-8192/ctor
/sys/kernel/slab/kmalloc-8192/destroy_by_rcu
/sys/kernel/slab/kmalloc-8192/free_calls
/sys/kernel/slab/kmalloc-8192/hwcache_align
/sys/kernel/slab/kmalloc-8192/min_partial
/sys/kernel/slab/kmalloc-8192/object_size
/sys/kernel/slab/kmalloc-8192/objects
/sys/kernel/slab/kmalloc-8192/objects_partial
/sys/kernel/slab/kmalloc-8192/objs_per_slab
/sys/kernel/slab/kmalloc-8192/order
/sys/kernel/slab/kmalloc-8192/partial
/sys/kernel/slab/kmalloc-8192/poison
/sys/kernel/slab/kmalloc-8192/reclaim_account
/sys/kernel/slab/kmalloc-8192/red_zone
/sys/kernel/slab/kmalloc-8192/reserved
/sys/kernel/slab/kmalloc-8192/sanity_checks
/sys/kernel/slab/kmalloc-8192/shrink
/sys/kernel/slab/kmalloc-8192/slab_size
/sys/kernel/slab/kmalloc-8192/slabs
/sys/kernel/slab/kmalloc-8192/slabs_cpu_partial
/sys/kernel/slab/kmalloc-8192/store_user
/sys/kernel/slab/kmalloc-8192/total_objects
/sys/kernel/slab/kmalloc-8192/trace
/sys/kernel/slab/kmalloc-8192/validate
# cat /sys/kernel/slab/kmalloc-8192/
3,查看alloc和free的情况
# cat /sys/kernel/slab/kmalloc-8192/alloc_calls
      3 timer_cpu_notify+0x18c/0x1f4 age=411895/411909/411920 pid=1 cpus=0
      1 qos_policy_perhost_table_init+0x64/0x100 age=411552 pid=1 cpus=3
     15 os_alloc_mem+0x1c/0x34 age=386584/404626/411488 pid=1-1093 cpus=1-3
   3103 __alloc_skb+0x98/0x238 age=430/366961/410069 pid=0-1467 cpus=1,3
     29 pskb_expand_head+0xa0/0x2b0 age=22161/203241/396156 pid=0-1467 cpus=1
      1 ipv4_sysctl_init_net+0xb0/0x11c age=411447 pid=1 cpus=2
      1 mac_filter_init+0x38/0x280 age=411551 pid=1 cpus=3
# cat /sys/kernel/slab/kmalloc-8192/free_calls
   2546 <not-available> age=382073 pid=0 cpus=0
      2 ubifs_iget+0x3a4/0x620 age=400698/405547/410397 pid=672-784 cpus=1
      2 RoutingTabDestory+0xcc/0xe4 age=396474/396474/396475 pid=694 cpus=3
    603 skb_free_head+0x74/0x94 age=1348/194381/410033 pid=0-1474 cpus=0-1,3
#
4,发现__alloc_skb申请较多,经过长时间运行后发现它一直在增长

阶段4:增加内核打印详细信息,找具体调用栈
找调用栈。
理论上有两种方法:1,在内核代码添加__alloc_skb()中添加dump_stack()函数,对内核重新编译后可以打印出调用栈;2,使用echo 1> /sys/kernel/slab/kmalloc-8192/trace 打开slab跟踪,也可以打出slab相关调用栈。
调用栈如下:因为打印较多必须得细心查看,到这里基本可以查看自己的代码逻辑了,看是否申请的资源没有被释放。
CPU: 3 PID: 0 Comm: swapper/3 Tainted: P           O   3.18.21 #9
Stack : 00000000 00000004 00000006 81383900 00000000 00000000 00000000 00000000
          80ffb812 00000041 00000000 00000000 00000000 00000000 80a72e04 80ff5b5c
          8fc4ddc8 80badce7 00000000 00000000 00002240 81250000 00000000 80945f48
          89204078 8003130c 00000000 00000000 80a77994 8fcabbcc 8fcabbcc 80a72e04
          81250000 00000000 00000000 00000000 00000000 00000000 00000000 00000000
          ...
Call Trace:
[<80015ad4>] show_stack+0x88/0xa4
[<80948ee8>] dump_stack+0x6c/0x8c
[<8079f940>] __alloc_skb+0x1e8/0x238
[<807d195c>] skbmgr_alloc_skb4k+0xc8/0x124
[<806baf60>] RTMP_AllocateRxPacketBuffer+0x40/0x1b0
[<805ef068>] pci_get_pkt_dynamic_page_ddone+0x120/0x3bc
[<805ef3d0>] pci_rx_dma_done_handle+0xcc/0x194
[<805ebf50>] pci_rx_data_done_func+0x12c/0x26c
[<80033f20>] tasklet_hi_action+0x100/0x1cc
[<8003464c>] __do_softirq+0x1e8/0x308
[<80034a1c>] irq_exit+0x78/0x84
[<800101ec>] ret_from_irq+0x0/0x4
[<80011e54>] r4k_wait_irqoff+0x18/0x20
[<8006791c>] cpu_startup_entry+0x13c/0x1b0

CPU: 3 PID: 0 Comm: swapper/3 Tainted: P           O   3.18.21 #9
Stack : 00000000 00000004 00000006 81382500 00000000 00000000 00000000 00000000
          80ffb812 00000041 00000000 00000000 00000000 00000000 80a72e04 80ff5b5c
          8fc4ddc8 80badce7 00000000 00000000 00002240 81250000 00000000 80945f48
          89204078 8003130c 00000000 00000000 80a77994 8fcabbcc 8fcabbcc 80a72e04
          81250000 00000000 00000000 00000000 00000000 00000000 00000000 00000000
          ...
Call Trace:
[<80015ad4>] show_stack+0x88/0xa4
[<80948ee8>] dump_stack+0x6c/0x8c
[<8079f940>] __alloc_skb+0x1e8/0x238
[<807d195c>] skbmgr_alloc_skb4k+0xc8/0x124
[<806baf60>] RTMP_AllocateRxPacketBuffer+0x40/0x1b0
[<805ef068>] pci_get_pkt_dynamic_page_ddone+0x120/0x3bc
[<805ef3d0>] pci_rx_dma_done_handle+0xcc/0x194
[<805ebf50>] pci_rx_data_done_func+0x12c/0x26c
[<80033f20>] tasklet_hi_action+0x100/0x1cc
[<8003464c>] __do_softirq+0x1e8/0x308
[<80034a1c>] irq_exit+0x78/0x84
[<800101ec>] ret_from_irq+0x0/0x4
[<80011e54>] r4k_wait_irqoff+0x18/0x20
[<8006791c>] cpu_startup_entry+0x13c/0x1b0

CPU: 3 PID: 19 Comm: ksoftirqd/3 Tainted: P           O   3.18.21 #9
Stack : 00000000 00000004 00000006 81383d00 00000000 00000000 00000000 00000000
          80ffb812 00000044 00000000 00000000 00000000 00000000 80a72e04 80ff5b5c
          8fc4c158 80badce7 00000000 00000000 00002240 81250000 00000000 80945f48
          00100007 8003130c 00000000 00000000 80a77994 8fcebc2c 8fcebc2c 80a72e04
          81250000 00000000 00000000 00000000 00000000 00000000 00000000 00000000
          ...
Call Trace:
[<80015ad4>] show_stack+0x88/0xa4
[<80948ee8>] dump_stack+0x6c/0x8c
[<8079f940>] __alloc_skb+0x1e8/0x238
[<807d195c>] skbmgr_alloc_skb4k+0xc8/0x124
[<806baf60>] RTMP_AllocateRxPacketBuffer+0x40/0x1b0
[<805ef068>] pci_get_pkt_dynamic_page_ddone+0x120/0x3bc
[<805ef3d0>] pci_rx_dma_done_handle+0xcc/0x194
[<805ebf50>] pci_rx_data_done_func+0x12c/0x26c
[<80033f20>] tasklet_hi_action+0x100/0x1cc
[<8003464c>] __do_softirq+0x1e8/0x308
[<800347b8>] run_ksoftirqd+0x4c/0x6c
[<80050a90>] smpboot_thread_fn+0x1c8/0x1d0
[<8004bebc>] kthread+0xd8/0xf0
[<80010230>] ret_from_kernel_thread+0x10/0x18
阶段5:具体函数具体分析
由于阶段4,我们的目标函数比较底层,所以栈打印较多。需要逐个分析调用栈,找到怀疑点后,还需要在怀疑点多基础上分析栈上的函数。用时可多可少。。。
总结:
1,写这个看起来简单,实际上用了7个工作日才找到内存泄漏点
2,其实在第3个工作日已经找到方法了,但是打印的栈信息太多分析时漏掉了几个栈的代码,导致一直在错误的路上(栈里)走了好几天,分析代码。。。。
3,如果已经打印出栈信息,就不能放过任何一个,尽量都分析下。我走歪路的原因就是认为那几个我分析的栈是不可能有问题的。。。最后确实是那几个我忽略的栈出的问题。
4,不能太自信,往往错过的才是真的,而貌似正确的确带着你走向深渊


 1107
1107


 被折叠的 条评论
为什么被折叠?
被折叠的 条评论
为什么被折叠?
 到【灌水乐园】发言


