


上次没查到根本原因,这次继续排查,发现和我们发的包有很大的关系,根据上次rx_drop的含义,丢的数据可能是以下几种原因:
The softnet backlog full
Bad VLAN tags
Packets received with unknown or unregistered protocols
IPv6 frames when the server is configured only for ipv4
一 dropwatch使用
1.1 使用
丢包排查的神器,上篇已经说过,这次在仔细用下,dropwatch目前要求首先内核必须大于等于2.6.30。
yum install dropwatch
采用交互方式运行:
[root@localhost ~]# dropwatch -l kas
>start
启动,按ctrl+C停止。
dropwatch> start
Enabling monitoring...
Kernel monitoring activated.
Issue Ctrl-C to stop monitoring
15 drops at ip6_mc_input+1ad (0xffffffff8164414d)
117 drops at ip_rcv+cf (0xffffffff815ca47f)
2 drops at __udp4_lib_mcast_deliver+2ad (0xffffffff815fbe3d)
6 drops at ip_rcv_finish+1b4 (0xffffffff815c9e04)
2 drops at __netif_receive_skb_core+3d2 (0xffffffff81586d82)
2 drops at ip_forward+1d0 (0xffffffff815cbee0)
1 drops at skb_queue_purge+18 (0xffffffff81572ec8)
13 drops at ip_rcv_finish+1b4 (0xffffffff815c9e04)
7 drops at tcp_v4_rcv+87 (0xffffffff815f0197)
25 drops at ip6_mc_input+1ad (0xffffffff8164414d)
15 drops at ip_rcv_finish+1b4 (0xffffffff815c9e04)
118 drops at ip_rcv+cf (0xffffffff815ca47f)
3 drops at ip_forward+1d0 (0xffffffff815cbee0)
1 drops at __brk_limit+3e1e36a8 (0xffffffffc05f46a8)
1 drops at __netif_receive_skb_core+3d2 (0xffffffff81586d82)
4 drops at ip_rcv_finish+1b4 (0xffffffff815c9e04)
7 drops at tcp_v4_rcv+87 (0xffffffff815f0197)
17 drops at ip6_mc_input+1ad (0xffffffff8164414d)
112 drops at ip_rcv+cf (0xffffffff815ca47f)
6 drops at ip_forward+1d0 (0xffffffff815cbee0)
5 drops at ip_rcv_finish+1b4 (0xffffffff815c9e04)
丢包主要几种在:118 drops at ip_rcv+cf (0xffffffff815ca47f)这个函数,查看drop位置:
#grep -w "ip_rcv" /boot/System.map-$(uname -r)  -A10
ffffffff815ca3b0 T ip_rcv
ffffffff815ca7c0 t ip4_frag_match
ffffffff815ca810 t ipqhashfn
ffffffff815ca8c0 t ip4_hashfn
ffffffff815ca8f0 t ip4_frag_free
ffffffff815ca910 t ip4_frag_init
ffffffff815ca9f0 t ipv4_frags_exit_net
ffffffff815caa30 t ipv4_frags_init_net
ffffffff815cab30 t ip_expire
ffffffff815cac50 T ip_defrag
ffffffff815cba30 T ip_check_defrag
我们注意到0xffffffff815ca47f在ffffffff815ca3b0和ffffffff815ca7c0之间。如果dropwatch显示的地址,则可以通过以下命令进行定位:
cat /proc/kallsyms|grep xxx(地址前面xx位)
找下内核源码去查看:
找到相应版本后,搜索ip_rcv
[https://elixir.bootlin.com/linux/v3.10.69/source/net/ipv4/ip_input.c#L375](https://elixir.bootlin.com/linux/v3.10.69/source/net/ipv4/ip_input.c#L375)
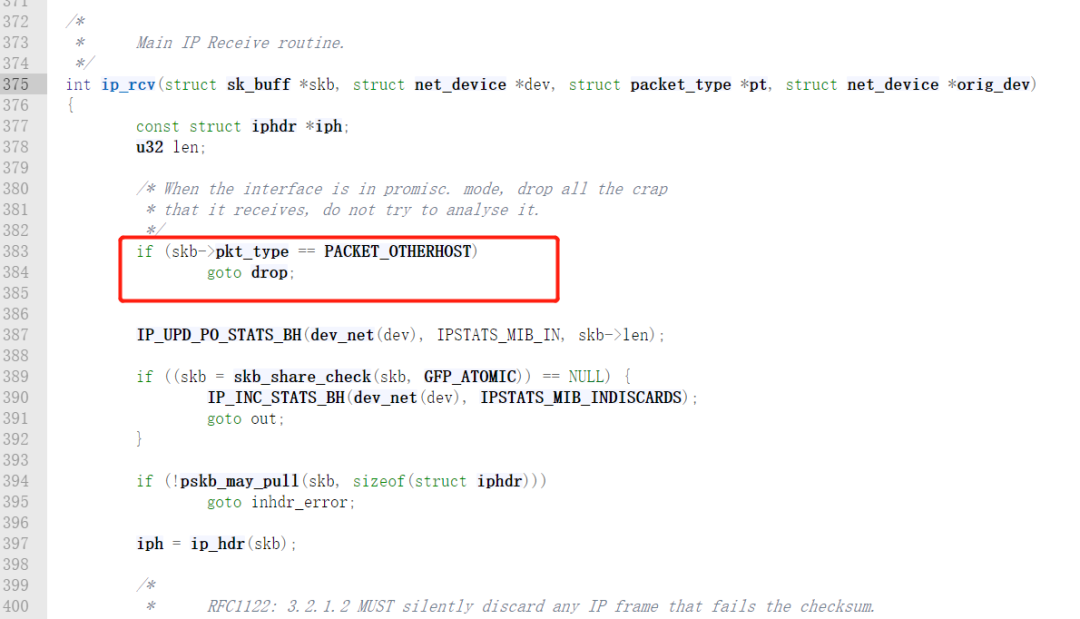
大概是pkt_type类型不对,丢弃掉不是发往本机的报文,skb->pkt_type在网卡接收报文处理以太网头时会根据dst mac设置,协议栈的书会讲不是发往本机的广播报文会在二层被丢弃,但是这个和我们的不符合,我们是采用混杂模式,所以不存在mac不匹配的问题。
二 其他丢包查询办法
2.1 ip查看丢包
 $ip -s -s link ls eno2
24: eno2: <BROADCAST,MULTICAST,PROMISC,UP,LOWER_UP> mtu 1500 qdisc mq state UP mode DEFAULT qlen 1000
    link/ether 78:ac:44:0f:16:00 brd ff:ff:ff:ff:ff:ff
    RX: bytes  packets  errors  dropped overrun mcast
    16179332325329 79927306089 0       123106137 0       315991391
    RX errors: length   crc     frame   fifo    missed
               0        0       0       0       0
    TX: bytes  packets  errors  dropped carrier collsns
    0          0        0       0       0       0
    TX errors: aborted  fifo   window heartbeat transns
               0        0       0       0       8
2.2 netstat 查看丢包情况
$ netstat -i
Kernel Interface table
Iface             MTU    RX-OK RX-ERR RX-DRP RX-OVR    TX-OK TX-ERR TX-DRP TX-OVR Flg
eno1             1500   132108      0  24242 0          7034      0      0      0 BMRU
eno2             1500 80057630017      0 123636508 0             0      0      0      0 BMPRU
eno3             1500 173704853      0 527651 0      52369033      0      0      0 BMPRU
eno4             1500     8497      0      0 0             0      0      0      0 BMU
enp59s0f0        1500        0      0      0 0             0      0      0      0 BMU
enp59s0f1        1500        0      0      0 0             0      0      0      0 BMU
lo              65536 581220807      0      0 0      581220807      0      0      0 LRU
vboxnet0         1500        0      0      0 0         20880      0      0      0 BMRU
virbr0           1500        0      0      0 0             0      0      0      0 BMU
2.3 查看具体协议的丢包
比如udp丢包
netstat -su
IcmpMsg:
    InType0: 112
    InType3: 165692
    InType8: 7
    InType11: 7434
    OutType0: 7
    OutType3: 169248
    OutType5: 7
    OutType8: 153
Udp:
    126528161 packets received
    77827 packets to unknown port received.
    20408348 packet receive errors
    120504641 packets sent
    20408348 receive buffer errors
    0 send buffer errors
UdpLite:
IpExt:
    InNoRoutes: 4
    InMcastPkts: 26550045
    OutMcastPkts: 2576
    InBcastPkts: 456933
    OutBcastPkts: 36
    InOctets: 1176854170075
    OutOctets: 1113352074110
    InMcastOctets: 7163508127
    OutMcastOctets: 165775
    InBcastOctets: 138811485
    OutBcastOctets: 2808
    InCsumErrors: 21934887
    InNoECTPkts: 1058031660
    InECT0Pkts: 2361
2.4查看各个协议的收发情况
#cat /proc/net/snmp
Ip: Forwarding DefaultTTL InReceives InHdrErrors InAddrErrors ForwDatagrams InUnknownProtos InDiscards InDelivers OutRequests OutDiscards OutNoRoutes ReasmTimeout ReasmReqds ReasmOKs ReasmFails FragOKs FragFails FragCreates
Ip: 1 64 1054834458 21934887 0 5631 159 0 652874483 636977013 0 52 256 3409 889 256 7277 0 23887
Icmp: InMsgs InErrors InCsumErrors InDestUnreachs InTimeExcds InParmProbs InSrcQuenchs InRedirects InEchos InEchoReps InTimestamps InTimestampReps InAddrMasks InAddrMaskReps OutMsgs OutErrors OutDestUnreachs OutTimeExcds OutParmProbs OutSrcQuenchs OutRedirects OutEchos OutEchoReps OutTimestamps OutTimestampReps OutAddrMasks OutAddrMaskReps
Icmp: 173245 34807 0 165692 7434 0 0 0 7 112 0 0 0 0 169415 0 169248 0 0 0 7 153 7 0 0 0 0
IcmpMsg: InType0 InType3 InType8 InType11 OutType0 OutType3 OutType5 OutType8
IcmpMsg: 112 165692 7 7434 7 169248 7 153
Tcp: RtoAlgorithm RtoMin RtoMax MaxConn ActiveOpens PassiveOpens AttemptFails EstabResets CurrEstab InSegs OutSegs RetransSegs InErrs OutRsts InCsumErrors
Tcp: 1 200 120000 -1 547226 349549 365407 43767 184 505212431 516379275 219665 0 489834 0
Udp: InDatagrams NoPorts InErrors OutDatagrams RcvbufErrors SndbufErrors InCsumErrors
Udp: 126561398 77827 20408348 120536958 20408348 0 0
UdpLite: InDatagrams NoPorts InErrors OutDatagrams RcvbufErrors SndbufErrors InCsumErrors
UdpLite: 0 0 0 0 0 0 0
三 参考
[如何分析linux tcp/ip 丢包问题](https://blog.csdn.net/vertor11/article/details/108609419)
[systemtap能做什么?第一篇](https://vcpu.me/systemtap-skills/)


 1079
1079


 被折叠的 条评论
为什么被折叠?
被折叠的 条评论
为什么被折叠?
 到【灌水乐园】发言


